Share your thoughts
placeholder
Article
#‌$NVDA NVDA AT $231: NVIDIA REMAINS ONE OF THE STRONGEST AI STOCKS — FULL MARKET ANALYSIS, NFP IMPACT & TRADING PLAN
NVIDIA remains one of the most powerful names in the global technology market, and in my view NVDA continues to deserve serious attention because the AI infrastructure story is far from finished. With NVDA around the $231 area, the stock is sitting in an important decision zone where momentum, fundamentals, AI demand, macroeconomic pressure and valuation are all coming together. The latest verified Friday close was approximately $230.36, after NVDA traded as high as $234.76 and
post-image
#​MU Micron Technology (MU) – Market Analysis (Data as of September 6, 2026, based on the September 4 regular session)
Micron closed its last completed trading session on Friday, September 4, 2026, at USD 1,014.95, up USD 56.46 or approximately 5.89 percent from the prior close of 958.49. The session ranged from 969.00 to 1,017.77 on roughly 30.7 million shares, the heaviest volume in twenty sessions at about 2.3 times its average, and the stock finished near its session high. US equities do not carry a rolling 24-hour change figure, so the latest full trading day is used here. That single-day
post-image
MU+5.89%
These returns have me feeling nervous, worried that the market will come to its senses tomorrow and blacklist me.
When I opened the chart this morning, it was still grinding sideways. The key was that the bottom held, while volume was quietly picking up and signs of funds entering were all too obvious. With a signal like that right in front of me, not taking it would have been letting all those late nights down. So I entered directly at 91.82, set my stop-loss, closed the software, and went back to work.
When I returned to my computer, the price had already reached 103.5, with the position’s r
post-image
ADA+0.32%
SNDK+0.39%
#HYPEBreaks88HitsNewAllTimeHigh
HYPE has entered a major price-discovery phase after breaking above $88 and printing a fresh all-time high of $88.11 on September 3. The token is currently trading around $85.4–$85.6, meaning it remains only about 2.8% below its record high despite the profit-taking that followed the breakout. The recent structure is especially interesting because HYPE has not collapsed after reaching $88.11; instead, it has been consolidating mainly between $83.5 and $86.4. From the August 31 area near $79.6 to the $88.11 ATH, HYPE gained approximately 10.7%, while the move fr
post-image
🎉 Make a post for a chance to win 6,000 USDT!
Gate's global user base has officially surpassed 60 million!
This time, we're not just celebrating—we're giving away rewards directly 👇
🍀 1 person will exclusively win a 6,000 USDT futures position trial voucher
🎁 Plus, 60 more people will be drawn to receive a 60 USDT futures position trial voucher each
💙 More rewards for quality content: 1 $GT / Gate merchandise blind box
It's simple to participate:
Post on Gate Square with #Gate用户突破6000万 for a chance to become the 6,000U super lucky winner!
Don't know what to post? Just talk about your sto
GT-4.92%
  • 6
  • 1
#RedBullTradingTourSeason6
Red Bull Trading Tour Season Six Kicks Off With High Energy
Red Bull Trading Tour is back for its sixth run, and buzz is high across the trading crowd. Known for mixing pro insight with bold live action, the tour turns chart reading into a real-world arena. This season brings new cities, new faces and a fresh prize pool, with a focus on skill, speed and clear risk control. Early sign-ups show strong interest, as both past finalists and new challengers aim to claim a seat on the leaderboard.
① What Makes This Tour Stand Out
Unlike pure online contests, this tour blen
  • 8
  • 2
No one cares about a monthly salary of 40,000; a two-character bio moves hearts.
post-image
Everyone’s staring at 0.849, but the 4H just whispered a secret about PONS that most will ignore.

$PONS /USDT - SHORT

Trade Plan:
Entry: N/A – N/A
SL: N/A
TP1: N/A
TP2: N/A
TP3: N/A

Why this setup?
- 1D is *range*, not a breakout—so chasing longs is a trap.
- RSI on 15m at 42.93 = weak bounce fuel, not reversal strength.
- SHORT bias armed at 0.849 with 55% confidence: the edge is fading rallies into resistance, not buying dips.
- Why now? The 4H timeframe says the path of least resistance is down while price hugs the middle of the range.

Debate:
Is 0.849 the ceiling for PONS thi
PONS-13.50%
After $FARTCOIN broke above its previous high, it did not accelerate directly but instead quickly pulled back. I treated the breakout level as a key reference level and entered long when the pullback held above it. This is a standard breakout-and-retest confirmation; as long as this level holds, the logic remains unchanged.

After entry, the price did not continue pulling back and rose directly. On the first surge, I followed the plan and took profit on 70% first, while gradually moving the protection level higher on the remaining 30% to let the profits run.

The biggest mistake in this proc
post-image
FARTCOIN+6.74%
SOL+2.66%
ETH+0.40%
btc market update
live-cover
LIVE1,781
$ETH Long Opportunity】2459 long lower-shadow rebound, supported by 4H EMA20
$ETH 2459 long lower-shadow rebound, with the candlestick closing at 2474 and trading near the 4H EMA20. The 1H MACD negative histogram is expanding, RSI at 41 is not oversold, and order book depth is imbalanced by -35.13%, with sellers clearly dominant. However, genuine buying support remains below 2470, with consecutive lower shadows appearing in the 2450-2470 range. The current price is near the 4H Bollinger middle band, with bulls and bears directly clashing. Support above 2450 remains solid, and with a risk-rewar
post-image
ETH+0.40%
I opened a short position on this drop. Luck played only a small part—the level was simply textbook.
At the time, the wick up just reached below the previous high, but the bulls failed to break through twice in a row while volume kept declining, a typical exhaustion candlestick structure. I entered near the resistance level, with my stop-loss set just above the previous high, so the risk was easy to control.
Soon after entry, the market quickly pulled back. During the session, there was a small rebound, so I reduced part of the position. Seeing that the retest lacked strength, I continued hold
post-image
CYS-0.78%
BNB-3.75%
LAB-3.00%
This was purely the market being in a good mood, casually sprinkling some gold coins that just happened to land on my head.
Right after lunch, when I checked the charts, $SNXX was still alarmingly red, but something felt off in the order book: the sell orders kept getting eaten away, while the buy orders were lined up neatly. Repeated choppiness is when it’s easiest to trick people into exiting, but I refused to leave and directly shared a long idea, telling those following me not to panic. The longer this buildup lasts, the more decisively it will break out.
Everyone saw what happened next:
post-image
SNXX+0.86%
BNB-3.75%
SNDK+0.39%
respect the pump.
$LINK
PUMP+2.13%
💰 Don’t let great content earn only likes! Have you activated Gate Social Subscriptions?
Share analysis in the Square or discuss market trends in livestreams—any content can be set as subscriber-only! Market reviews, trading strategies, market observations… Give subscribers access to deeper content while sharing and building a core following!
🔥 Set your own price with 0% revenue share! Activate now: https://www.gate.com/post
📖 Learn more: https://www.gate.com/help/community-center/moments/23369
  • 7
Financial News, Crypto Updates, Real-World Strategies
live-cover
LIVE1,293
The early-session price pulled back to around 0.1816 and stabilized, so I went long directly. The plan is simple: as long as the hourly candle body does not break down, the upside target is the high-volume trading zone, with the stop-loss placed at the same time.

After entering, it consolidated for a short while, with one wick in between, but I did not adjust the position. Once the hourly candle closed bullish again and pushed upward on increased volume, I took profit on 70% when the first target was reached, and moved the stop-loss on the remaining position directly above the breakeven leve
post-image
ZEC+14.91%
DOGE+1.62%
$RAY Signal】Long: 1H overbought persistence + negative-funding short squeeze
$RAY RSI 1H 77.38, 4H 86.11; overbought persistence without a death cross. MACD 4H bullish expansion, 1H histogram shortening. Sell-side depth leads by -17.47%; price is rejecting a deep decline, with strong support at the 1H low of 1.2852. Funding rate -0.0112%, with shorts still paying. The 4H Bollinger upper band at 1.2740 has been broken, and the price is tracking along the upper band.
🎯Direction: Long
⚡Entry/limit order: 1.330297 - 1.334300
🛑Stop-loss: 1.320957
🚀Target 1: 1.354315
🚀Target 2: 1.364322
🛡️Trad
post-image
RAY+55.97%
BTC-0.33%
ETH+0.50%
SOL+2.73%
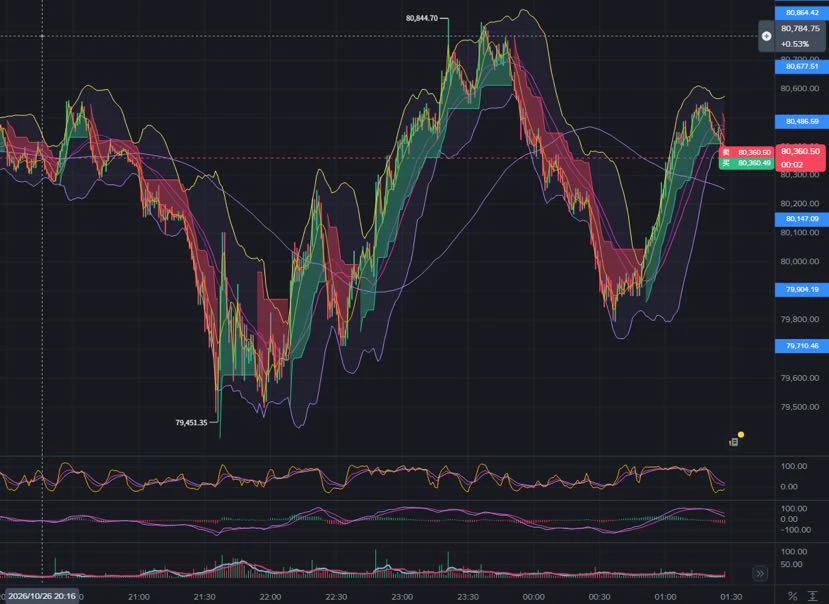
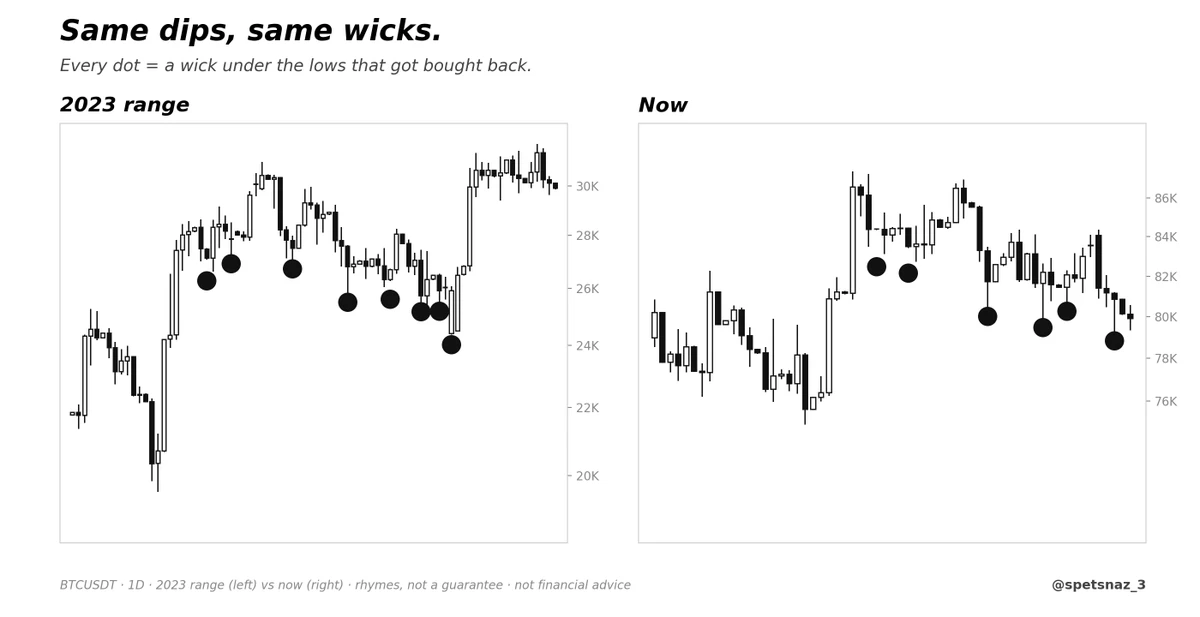
Bitcoin Returns to $80,000: Rally or Trap?
Bitcoin reclaimed the psychological $80,000 level after briefly coming under pressure from strong US NFP data. A 5% rise in 24 hours raises the question: is this the start of a new bullish trend or merely a temporary short squeeze?
Catalysts Behind the Rally
BTC's move was driven by changing interest rate expectations after Fed Governor Christopher Waller expressed support for holding rates in September. The probability of a rate hike fell from 70% to roughly 50/50, pushing risk assets including Bitcoin higher.
Although the August NFP figure (162,000)
BTC-0.33%
  • 13
  • 2
Load More

Join 40 M users in our growing community

⚡️ Join 40 M users in the crypto craze discussion

💬 Engage with your favorite top creators

👍 See what interests you

View More