Square
Following
Hot
News
Notifications
Profile
Share your thoughts
placeholder
Article
When will the bottom form before the halving?❓
Historical cycle bottoms typically occur about 17 months (16.9–17.8 months) before the next halving:
January 2015 low → about 542 days before the 2016 halving
December 2018 low → about 513 days before the 2020 halving
November 2022 low → about 516 days before the 2024 halving
The timing of all three bottoms is highly concentrated, with only about 29 days between them
When will the top form after the halving?❓
Mature cycles (since 2016) have shown highly consistent tops, occurring 525–546 days (about 17–18 months) after the halving:
2016 halving →
post-image
$ETH Nothing good to post, so just posting a random update. I've almost forgotten about this account. ‌
ETH-1.26%
Trenches
mihao
m
bade
b
mihao
4Cxj...pump
Market Cap
$.
Change
.
24h Vol
$.
Holders
.
Snoopy
S
bade
b
Snoopy
7mEh...47Cn
Market Cap
$.
Change
.
24h Vol
$.
Holders
.
AGT
A
bade
b
AGT
0x5d...e274
Market Cap
$.
Change
.
24h Vol
$.
Holders
.
NIO
N
bade
b
NIO
7SL2...pump
Market Cap
$.
Change
.
24h Vol
$.
Holders
.
IDOL
I
bade
b
IDOL
0x3b...ab07
Market Cap
$.
Change
.
24h Vol
$.
Holders
.
Finally seeing some life in $HOME . Let's see if this momentum can last, or if it's messing with us again. Take profit: 0.004350Stop loss: 0.003815
Hot coins:
$BANANAS31 : Current price 0.004159 - 24-hour change: +9.22%
$BTC : Current price 63,846.4 - 24-hour change: -6.31%
post-image
HOME-0.31%
BANANAS31-3.28%
BTC-0.67%
ETH | Short 🔴 | Bearish | 15m 24 hours: -8.17% | Volume: 13603.2M USDT Short rationale: Price below EMA200; EMA20/50/200 bearishly aligned; RSI14 at 29.2; MACD histogram negative; ADX14 at 56.9; volume is 0.40x the 20-candle average; trend pullback/continuation. Entry: 1750.23 Stop loss: 1798.44 Take profit 1: 1689.97 | Take profit 2: 1653.81 | Take profit 3: 1605.6 Entry levels are for reference only; do not chase the price. This strategy is invalidated if the stop-loss level is hit. Technical analysis strategy only, not investment advice. $ETH
post-image
ETH-1.23%
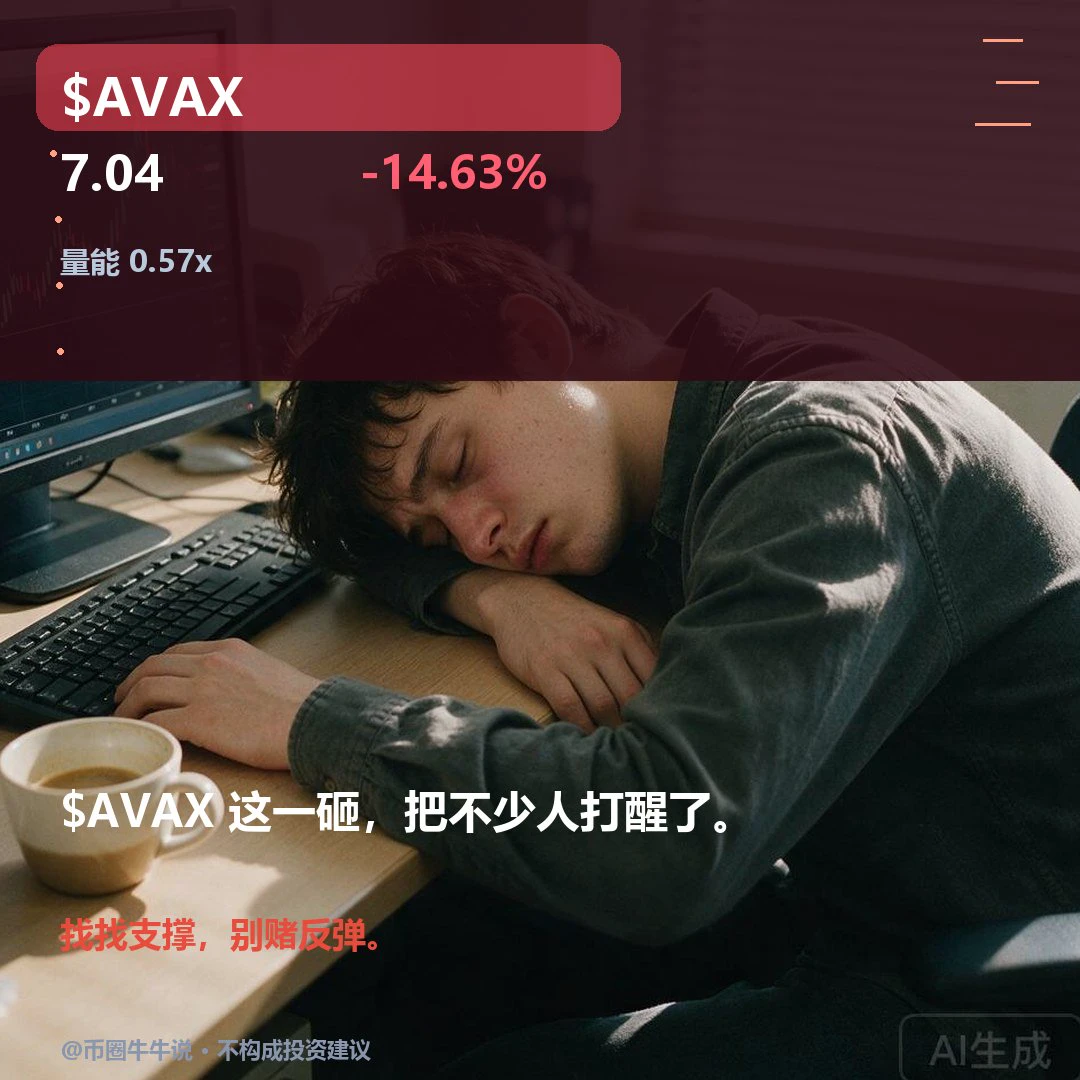
$AVAX Currently trading at 7.044, down 14.63% over 24H (range: 6.936–8.263). The 1H trend is weak, with an RSI of 12; the 4H trend is weak, with an RSI of 20. If it decisively breaks above 8.253, continue watching for further upside. If it falls below the 6.936 support, the short-term structure may weaken. Market volatility is high; for observation only.
post-image
AVAX-0.10%
$BTC With Bitcoin’s sharp drop, I know many people are at a loss. If you’re unsure what to do, you can refer to Ao Ying’s comments. Ao Ying said he had originally planned to make 2 million, but ended up making 10 million dollars by accident.
post-image
BTC-0.67%
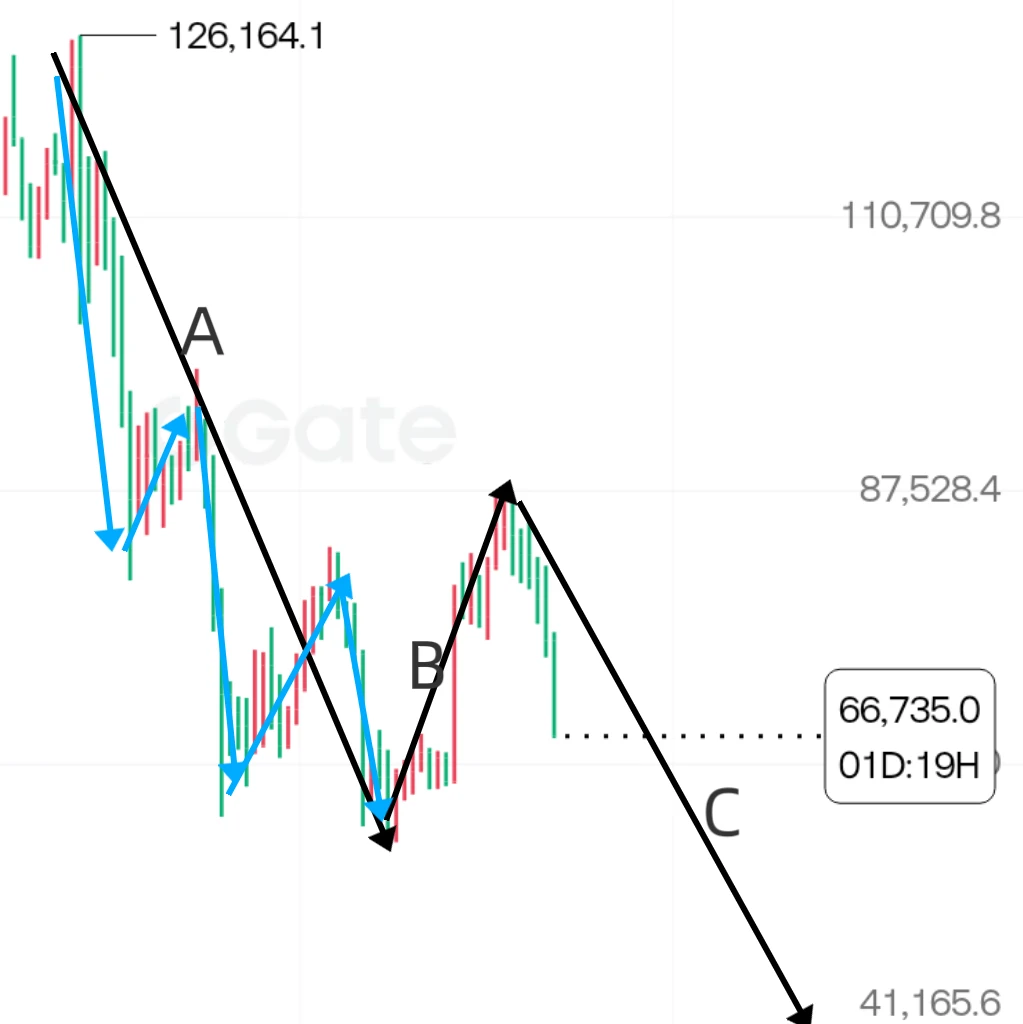
Yesterday’s livestream briefly discussed the risks. You can check the title and structural analysis. Bitcoin and Ethereum’s weekly large C-waves are extending. This decline will break below 57,600, then after consolidating, continue to target the 40k range. The large C-wave has begun, and any decent rebound along the way is an opportunity for long positions to get out. Like the chart from yesterday #ETH一度跌破2000美元
post-image
BTC-0.67%
ETH-1.26%
  • 1
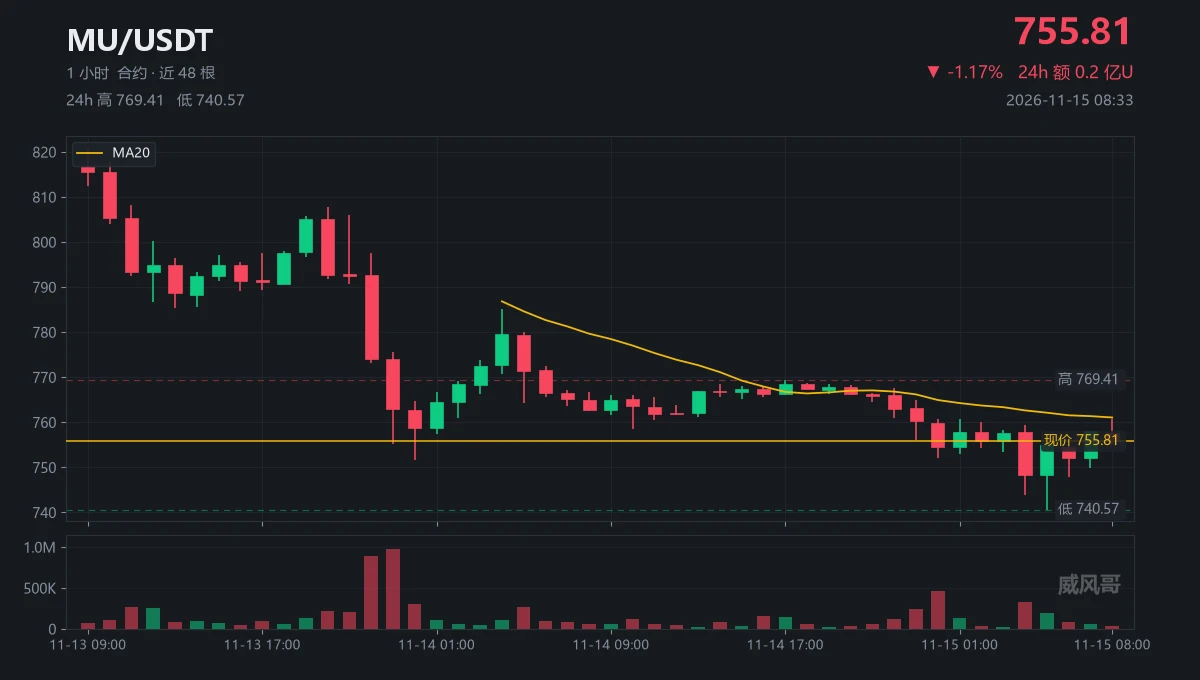
Is the washout over?
That's what everyone in the group is saying.
On the evening of 11-13, two bars: 896k contracts, 971k contracts.
Average volume: 154k, roughly six times normal.
But the price plunged from 792.68 to 763.04.
The heaviest volume hit at the highs.
What about the bar at the 740.57 low?
197k contracts.
Three rebound bars: 82k, 66k, and 37k.
Volume contracted.
So I accept the flush-out, but I don't think it's time to buy.
$MU is now at 755.81, with MA20 at 761.08.
If it can't get above that, it's still just a rebound.
(Not investment advice; you are responsible for your own gains
post-image
MU-0.63%
  • 2
BTC Falls Below $64,000: Rebound or Further Decline? Key Levels for Bulls and Bears

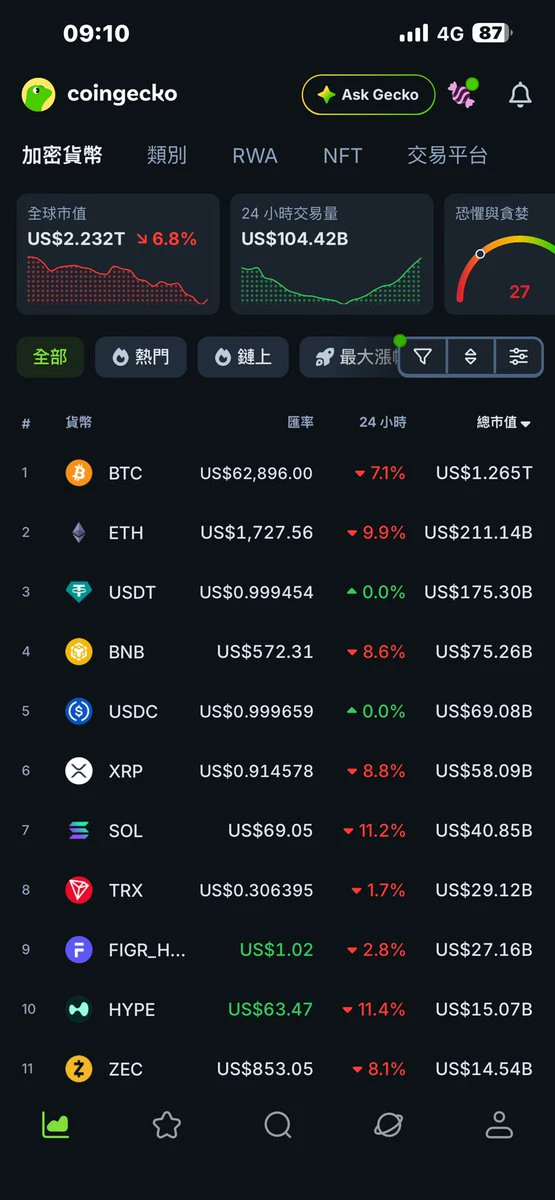
Bitcoin is currently trading around $63,700, with $64,000 having shifted from a support level to a key threshold that needs to be reclaimed. For technical traders, once price breaks below support, that former support often turns into resistance on a rebound. Whether BTC can regain and hold above $64,000 over the next few trading sessions will directly shape the short-term market outlook.
At the bull-bear dividing line, $63,000 is an important short-term level to watch. If price forms consecutive lower wicks in
NVDA-1.92%
BTC-0.65%
  • 34
This won't trap anyone? Most people say they'll buy the dip at 60. Do you dare buy now?$CRCL
post-image
CRCL-1.70%
cryto live now
live-cover
LIVE982
November 30: a crucial battle for Strategy’s fate! A capital drama Bitcoin investors must understand!

November 30 is a date worth watching for Strategy investors.
MSCI has confirmed that Strategy will be removed from the relevant stock indexes, with the change taking effect after the market closes that day.
A capital drama may unfold next: index funds adjust their positions, other investors look for trading opportunities, and the Bitcoin market watches closely for the next move by this mega Bitcoin-holding company.
There are three important things to watch.
First, selling pressure. How much p
NVDA-1.92%
  • 25
All set, bro. Go ahead and open a starter position.
post-image
On the morning of November 15, ETH rebounded after a sharp drop, but overall remains in a weak recovery phase. Don’t rush to treat the rebound as a reversal.

First watch 1778–1785 overhead, with particular attention to resistance at 1789–1796. If the rebound weakens again in this area, the short-term bias remains toward waiting for opportunities as the rebound meets resistance. Watch for support at 1734–1742; holding this range would leave room for a further rebound, while a break below it could lead to another test of 1727–1730.

If it can hold above 1800 later, then watch for a recovery tow
post-image
ETH-1.23%
  • 1
$BTC The 63272 level was tested twice this morning. The 5-minute candle at 4:50 a.m. plunged straight from 65412 to 64444, with volume instantly surging to over 560k; the 1-hour candle at 6 a.m. continued lower from 64422, and the lows of the 5-minute candles at 6:10 and 6:50 a.m. both landed exactly at 63272. The current price is hovering around 63710. Last night I still viewed 66400 as support, but it was all gone by the time I woke up. I don't see this move as an opportunity for an oversold bounce. 63272 is this morning's low; if it breaks below that level, don't rush to buy the dip. Place
post-image
BTC-0.67%
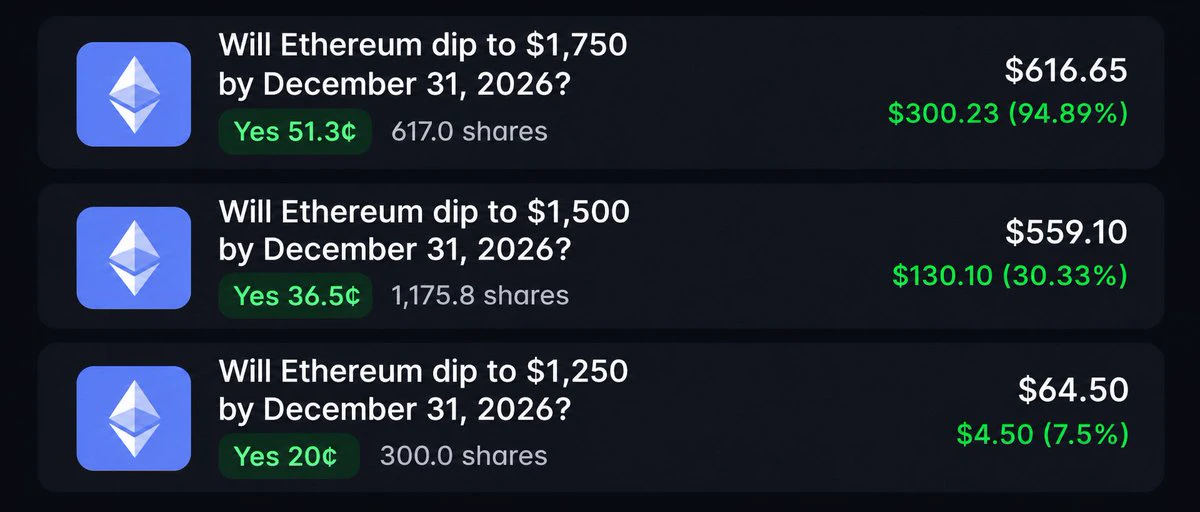
I love trading on @Polymarket The mechanics are really interesting.
Your stop loss is time-based, not price-based.
Opened these ethereum:native shorts back in August.
ETH rallied HARD and put my positions deep into drawdown.
Today, it came back down to $1,750 and hit my target.
You don’t need the perfect entry, and you don’t have to sweat every temporary pump or wick.
You have time for the trade to play out.
post-image
ETH-1.23%
Oh my God‼️ Is that you, Jensen Huang?
Aster reported more than $35B in taker trading volume for USD1 RWA Boost on November 11.
The total covers the first 10 campaign epochs, with the eleventh underway at the time of the update.
@Aster_DEX @Leonard_Aster
ASTER-0.07%
USD1+0.00%
RWA-0.39%
🔹South Korean Chip Stocks Rebound Against the Trend! KOSPI Gains Over 2, While SK Hynix and Samsung
live-cover
LIVE1,061
Load More

Join 40 M users in our growing community

⚡️ Join 40 M users in the crypto craze discussion

💬 Engage with your favorite top creators

👍 See what interests you

Trending Topics

GateIPOAccessAnthropic

334.5K Views2.9K Discussing

Gate IPO Access Phase 3 features Anthropic (ANT), with USDT subscription interest starting from 100 USDT. Successful allocations will be delivered as real shares to Gate Stock Accounts. Indicative price: $70–$78/share Subscription: Nov 12–17 (UTC+8) Allocation is not guaranteed. Please manage risk accordingly.

Dr.HanOxfordUnionSpeech

149.8K Views674 Discussing

USOctoberPPIBelowExpectations

474K Views1.6K Discussing

View More