#BTC短线回调 #Gate广场中秋团圆局 The Battle Between $84K and $90K September 26, 2026
Bitcoin is sitting at a critical point after a strong recovery from the September lows. BTC recently reached around $87,300 before pulling back toward $84,000, creating a roughly 3.7% retracement from the recent high. The important question now is not simply whether Bitcoin is bullish or bearish. The real question is whether this pullback is a normal reset before another attempt at $90,000, or whether BTC needs a deeper correction toward $82,500–$80,000 before buyers return.
Here is the complete market picture.
BTC Price, Range & Market Structure
Bitcoin is currently trading around $84,092, down approximately 0.8% over the last 24 hours, while still holding a weekly gain of roughly 2.75%. The current 24-hour range is approximately $83,175–$85,257.
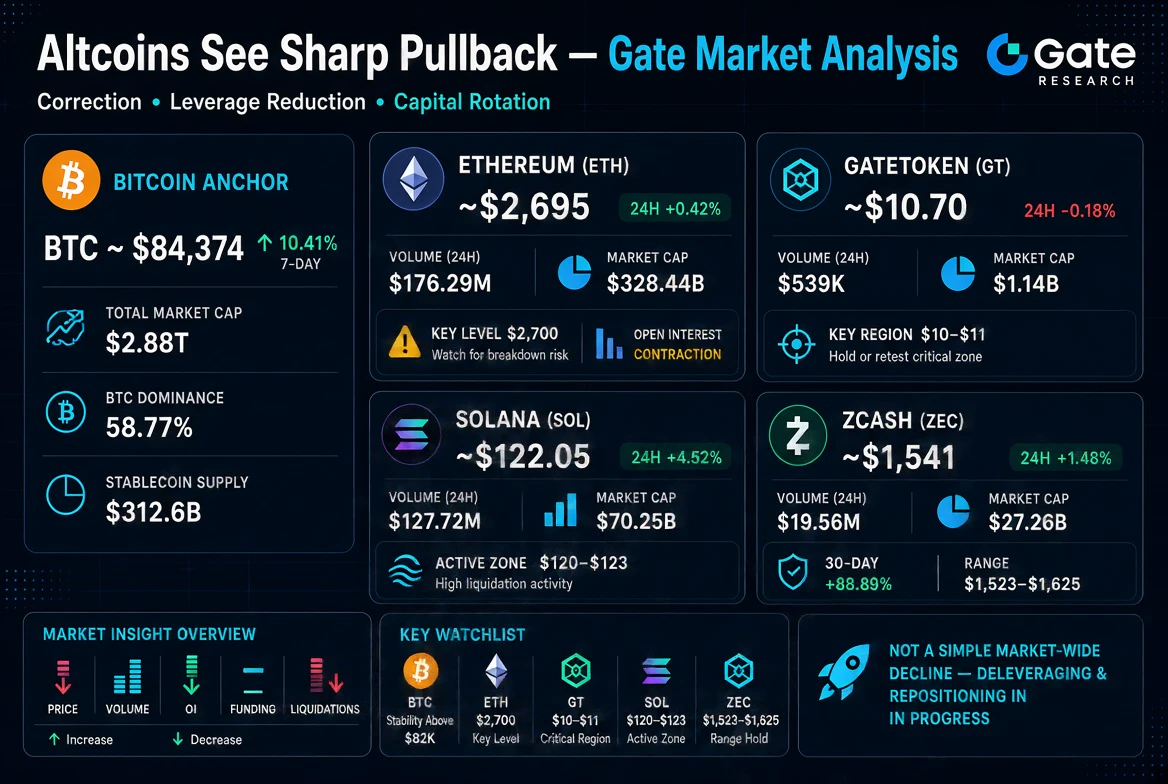
BTC's market capitalization is around $1.67 trillion, while the total cryptocurrency market is near $2.92 trillion. Bitcoin dominance is approximately 58.5%, showing that Bitcoin continues to capture a large portion of overall crypto liquidity.
The recent high near $87,300 on September 22 is the first major reference point. From that level, BTC has pulled back only around 3.7%. A pullback of this size after a sharp rally is not, by itself, evidence that the larger trend has reversed.
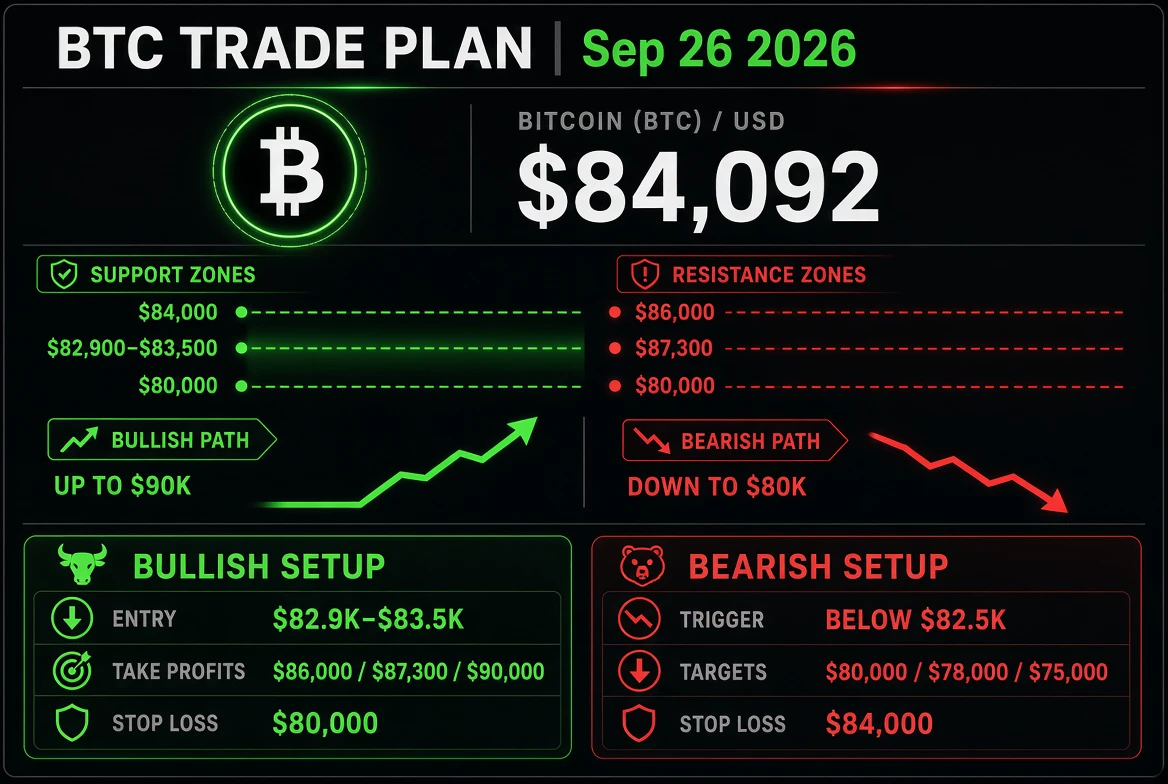
The immediate battle is around $84,000. If buyers defend this area, BTC can attempt another move toward $86,000 and $87,300. If $84,000 fails decisively, attention shifts toward $82,500, followed by the major psychological level at $80,000.
Technical Structure: Short-Term Weakness, Bigger Trend Still Constructive
The technical picture is mixed rather than completely bullish or bearish.
On the 1-hour timeframe, moving-average alignment is bearish and price is near the lower portion of the Bollinger structure. Short-term momentum has therefore weakened.
However, the higher timeframes remain more constructive. The daily structure continues to show bullish alignment, while the 3-day trend remains positive.
Important indicators and levels include:
RSI: ~45 — neutral
MACD: slightly negative — short-term momentum cooling
1H ADX: ~13 — weak trend strength
Daily ADX: ~42 — stronger broader trend
200-day MA: ~$82,922
Bollinger lower band: ~$83,531
Bollinger middle band: ~$84,103
Bollinger upper band: ~$84,675
The most interesting technical area is therefore $82,900–$83,500, because the 200-day moving average and lower Bollinger region are clustered there.
That makes the zone important for both buyers defending the broader structure and traders looking for a better-defined risk/reward setup.
Volume & Liquidity: The Missing Breakout Confirmation
Liquidity remains substantial, with total crypto 24-hour trading volume above $109 billion.
However, BTC spot taker buy/sell activity around 0.94 indicates that sellers currently have a slight advantage. This explains why Bitcoin has struggled to immediately reclaim the upper part of its recent range.
A move above $86,000 becomes much more meaningful if it comes with expanding spot volume. Without volume confirmation, a breakout can turn into another rejection and send BTC back into consolidation.
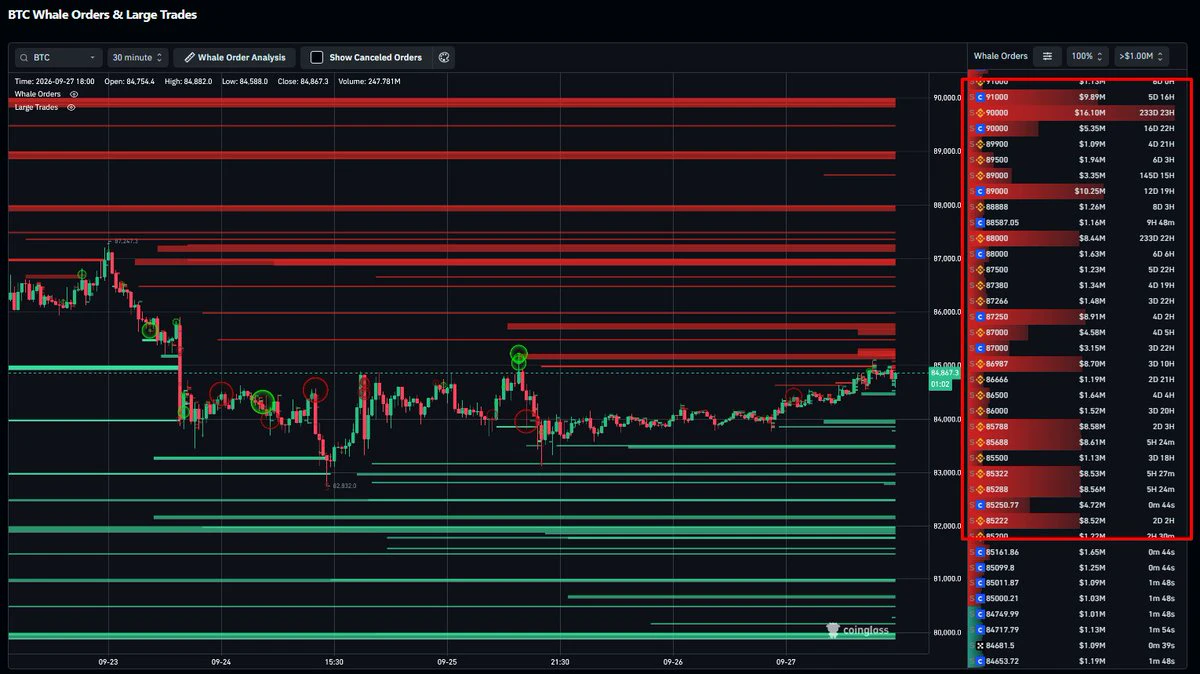
The previous move above $86,000 also produced roughly $1 billion in short liquidations, demonstrating how leverage can accelerate Bitcoin's price movements.
This is why traders should watch both price and liquidity. A resistance break without sufficient volume can be vulnerable to a false breakout.
Derivatives: Deleveraging Instead of Panic
The derivatives market is sending mixed but relatively controlled signals.
Open interest is around $55.5 billion, down approximately 2.6% over 24 hours. This suggests that some leveraged positions have already been reduced.
Funding is slightly negative at approximately -0.003%, while the long/short ratio is around 1.11.
This combination does not show extreme one-sided positioning. Instead, it suggests that the market has gone through some deleveraging while traders remain slightly tilted toward longs.
For BTC, that can be healthier than an environment where excessive leverage builds while price rises vertically.
The key risk is a sudden expansion in open interest while price remains trapped under resistance. That could increase the probability of another sharp liquidation event.
ETF & Institutional Demand
Institutional flows remain one of the most important pieces of the Bitcoin story.
Spot Bitcoin ETFs recorded approximately $190.6 million of net inflows on September 24, with total ETF assets around $108.9 billion.
This is important because BTC has been pulling back while institutional demand has remained notable. Price weakness accompanied by continued ETF demand can indicate that some larger investors are using weakness to accumulate exposure.
Earlier ETF inflows also reached their strongest levels since October 2025, coinciding with Bitcoin's move toward the $87,300 area.
However, ETF flows should not be treated as a guarantee of higher prices. They are one component of the market structure, alongside liquidity, derivatives, macro conditions and spot demand.
On-Chain Signals to Watch
The current dataset does not provide enough detailed on-chain information to make a strong claim about whale accumulation or distribution.
Instead, traders should monitor:
Exchange reserves
Exchange inflows and outflows
Active addresses
Whale transactions
Long-term holder activity
Stablecoin liquidity
If exchange reserves continue falling while price consolidates, it can support an accumulation interpretation. Conversely, rising exchange inflows during resistance rejection could increase selling-pressure concerns.
The important point is to combine these signals rather than relying on a single metric.
Fed, Rates & Macro Liquidity
Macro remains one of Bitcoin's biggest external risks.
The Federal Reserve's September 16 decision and expectations surrounding future monetary policy have kept liquidity conditions uncertain. Higher rates can pressure risk assets by making financial conditions tighter.
Yet BTC's price response is equally important.
Bitcoin was around $75,800 on September 16 and is now trading above $84,000, representing roughly an 11% recovery despite the macro uncertainty.
That shows Bitcoin has demonstrated significant relative strength during this period.
However, this does not remove macro risk. Upcoming Fed communication, inflation data, Treasury yields and changes in global liquidity can still create sharp BTC moves.
Therefore, traders should avoid assuming that the recent rally automatically means macro pressure has disappeared.
Geopolitics: Iran-US Talks Could Increase Volatility
Geopolitical developments are another major catalyst.
The US and Iran resumed talks on September 23, while tensions remain unresolved. Iran reportedly proposed conditions involving the reopening of the Strait of Hormuz and restarting nuclear negotiations.
Oil prices above $100 per barrel add another layer of uncertainty because higher energy prices can increase inflation pressure and influence global risk sentiment.
For Bitcoin, the impact is not one-directional.
Further escalation could trigger short-term risk-off selling across risk assets. On the other hand, meaningful progress toward an agreement could improve risk sentiment and reduce some energy-related inflation pressure.
This means geopolitical headlines can produce sudden BTC volatility in either direction. Traders using leverage should be particularly careful around major headlines.
Market Sentiment
Current sentiment remains relatively strong.
The Fear & Greed Index is around 72, indicating greed, while the Altcoin Season Index is around 63.
This suggests that confidence has returned to the crypto market, but sentiment has not yet reached the extreme levels associated with maximum euphoria.
Bitcoin dominance near 58.5% also shows that BTC continues to hold significant market leadership.
Still, sentiment should be treated as a secondary indicator. A high sentiment reading does not guarantee continuation, just as a moderate reading does not guarantee a reversal.
The Road Toward $90,000
The $90,000 level is now the major psychological target, but no reliable date can be assigned to it.
The technical path is:
$84,000 → $86,000 → $87,300 → $90,000
First, Bitcoin needs to defend the current support region. Then buyers need to reclaim $86,000 with convincing volume.
Above $86,000, the next major challenge is the recent $87,300 high.
A clean breakout above $87,300 would place $90,000 firmly back in focus.
Above $90,000, the next potential extension area discussed by traders is around $92,500, but that should be treated as a scenario rather than a guaranteed target.
The bearish alternative is equally important.
If BTC loses $84,000, the market could revisit $82,500. A sustained break below the $82,000–$82,500 region would weaken the current structure further and put $80,000 into focus.
Trader's Level Map
For traders planning around defined levels:
Current price: ~$84,092
Immediate support: ~$84,000
Major support zone: $82,900–$83,500
Deeper support: ~$80,000
First resistance: ~$84,675
Major breakout level: ~$86,000
Recent high: ~$87,300
Major psychological target: $90,000
Potential extension: ~$92,500
Possible Accumulation Zone
$82,900–$83,500
This zone is technically significant because it overlaps with the 200-day moving average and lower Bollinger region.
Breakout Setup
A stronger breakout setup would require BTC to reclaim $86,000 with increasing volume and hold above that level rather than immediately falling back into the range.
Potential Targets
TP1: $84,675
TP2: $86,000
TP3: $87,300
TP4: $90,000
Risk / Invalidation
A daily close below approximately $82,000 would materially weaken the current bullish structure.
A tighter invalidation can be considered around $82,800, while a wider risk level may be around $81,500, depending on the setup and position size.
The exact stop should always match the trader's entry and risk tolerance rather than being copied blindly.
Final Market Picture
Bitcoin's current structure is best understood as a battle between support and resistance, not as a confirmed reversal.
BTC has moved from around $75,800 to above $84,000, recently reached $87,300, and is now experiencing a roughly 3.7% pullback.
The broader trend remains constructive, while short-term momentum has cooled.
Institutional ETF flows remain important, BTC dominance is near 58.5%, open interest has declined, funding is slightly negative, and market sentiment remains in the greed zone.
The most important level right now is $84,000.
Holding this area keeps the path toward $86,000 → $87,300 → $90,000 open.
Losing $84,000 shifts attention toward $82,500, while a deeper breakdown could expose $80,000.
The biggest catalysts to watch are ETF flows, spot volume, derivatives positioning, Fed policy, inflation data, global liquidity and Iran-US developments.
For traders, the key is not to chase the middle of the range. Let price come to important levels, watch for volume confirmation, define the invalidation before entering, and keep leverage under control.
Bitcoin does not need to break $90,000 today. It needs to prove that buyers can defend the important support levels first.