Square
Following
Hot
News
Profile

IntradayDancer

vip
Active for: 0.5y
Peak Tier 0
Only engage in intraday ultra-short-term trading; the intraday chart is your dance partner. Choose a direction within the first 30 minutes of the open, enter and exit according to the rhythm during the session, and avoid holding overnight positions.
64
Following
11
Followers
1
Liked
11.64% looks great, but holding it for too long can let drift losses wear you down to tears—understand it first before jumping in.
Jens
$ETH5L is up 11.64%, with 0.029986 shown in the screenshot.
The larger move comes with leveraged exposure and rebalancing effects. I wouldn’t assume it will track five times ETH’s return across a longer holding period.
Understanding the product comes before choosing a target.
I’ve spent the past couple of days looking into the various ways AI Agents can interact automatically. To be honest, very few people are actually scrutinizing security; most are in a hurry to hype the narrative. Automated portfolio rebalancing sounds hassle-free in theory, but in practice, once you sign the contract approval, it’s all bots running in the background. If the code contains any hidden agenda, there may not even be time to fall back on safeguards.
My approach is very simple: make manual dollar-cost-averaging investments at low frequency, and before each operation, personally review
Recently, I’ve adjusted my mindset to a new version: I’m no longer chasing every new PFP narrative or hoarding membership cards. I used to think buying a membership card meant getting a seat at the table and borrowing a brand’s identity, but later realized that most of the time I was just helping others maintain the hype while staying up late to watch the floor price.
There are also countless labels on on-chain data tools now, such as “smart money” and “institutional holdings.” They look pretty mysterious, but you don’t know whether the activity reflects accumulation or a setup. The data is la
Chase only after breaking above 950; don’t rush to get in.
CryptocurrencyAnalysis
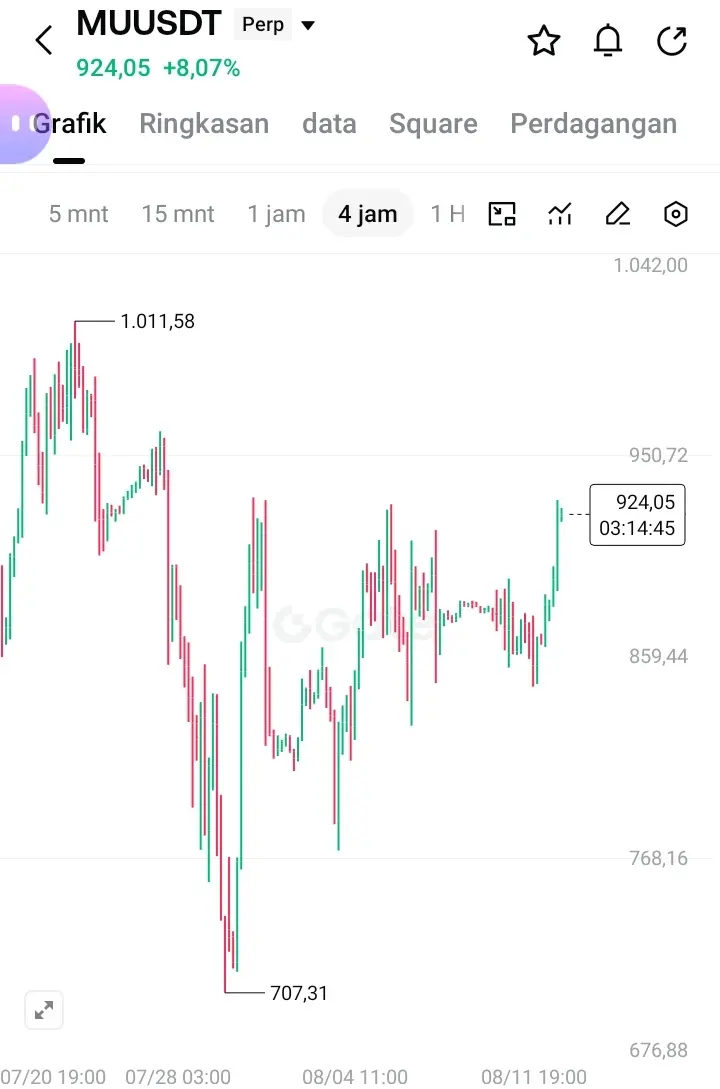
MARKET TALK - MU/USDT
​Current Price: 924.05 (+8.07%)
​Trend Structure: The short-term trend is undergoing a fairly strong recovery (bullish reversal/bounce) after previously touching a local low (swing low) at 707.31.
​Momentum: The last 4-hour candle shows a fairly sharp green impulsive breakout toward the upper area of local resistance.
​Key Levels (Support & Resistance)
​Main Resistance 1: 950.72 (The nearest resistance level that was previously tested).
​Main Resistance 2: 1,011.58 (Previous swing high).
​Nearest Support: 859.44 (Local consolidation/swing low area before this sharp rise).
​Strong Support: 768.16 – 707.31 (Critical lower boundary if a deep correction occurs).
​Price Movement Scenarios
​Bullish Scenario:
If the candle manages to break through and close above 950.72, the upward momentum could continue toward the previous peak at 1,011.58.
​Retest / Normal Correction Scenario:
Considering that the upward candle was quite impulsive without a brief consolidation, there is potential for a light pullback first toward the 880.00 – 900.00 range before continuing upward.
​Bearish Scenario:
If the price fails to break through 950 and reverses downward, breaking the 859.44 support, this short-term bullish structure becomes invalidated and the price risks retesting the 768 – 707 area.
​Strategy Recommendations
​For Buyers (Long): Avoid FOMO buying directly at the current running price (924.05) because it is approaching the 950.72 resistance. The best option is to wait for a pullback to the 880–900 area with a Stop Loss below 859, or wait for a confirmed breakout & retest above 950.72.
​For Sellers (Short): Monitor the price reaction around 950.72. If a rejection candle appears (such as a shooting star or bearish engulfing), there is an opportunity to scalp short with a target of returning to the 880–900 range.
$MU ‌#StockTradingShareChallenge
repost-content-media
Over the past couple of days, I’ve started trying to do some market making. Honestly, I’d been just watching other people talk about AMM curves before, but once I actually got in myself, I realized “impermanent loss” isn’t something you can treat lightly.
People say market making is basically effortless profit, but when you look at U-denominated curves, the losses caused by price going up and down can directly wipe out your fee revenue. Put simply, it’s not as straightforward as “just being wrong about direction.” It’s a bit better if you’re pairing with stablecoins—but if you’re trading a sma
Moving from Bitcoin mining companies to a high-performance computing index, is Grayscale trying to reposition its ETF by riding the AI compute-power boom? With the name changed, just how deep is the overlap—this needs careful consideration.
Original content no longer visible
BTC0.00%
$300 million ransom flow is all on-chain—now Web3 transparency is a double-edged sword: evidence for law enforcement, a tombstone for the hackers.
WuSaidBlockchainW
The EU has sanctioned ransomware core member Stern, whose associated wallet received more than $300 million in ransom.
The EU, citing Chainalysis, has imposed sanctions on Russian national Vitaly Kovalev (alias Stern), identifying him as a senior member of Trickbot and involved in the operation of ransomware such as Ryuk and Conti; the related wallets’ ransom exceeds $300 million, and financial flows involve networks including Diavol, Karakurt, Royal, and Quantum. The EU also sanctions LummaC2 developers, personnel linked to Media Land LLC and GRU Unit 29155, as well as pro-Russian hacker organizations CARR and Z-Pentest.
HIP-3: This share has been rising a bit too absurdly—on-chain trading of U.S. stocks really has become a new track.
WuSaidBlockchainW
Hyperliquid’s HIP-3 market’s share of platform perpetual futures trading volume has risen from about 2% at the start of the year to nearly 50%, mainly driven by demand for on-chain stock trading. TradeXYZ is currently the largest participant, offering XYZ100 to track the Nasdaq 100 index, as well as perpetual contracts for individual stocks such as Nvidia and Tesla, all settled in stablecoins. (The Block)
XLM’s chart is a typical bottoming-and-building-up pattern. Stellar’s payments narrative has always been there—it just depends on when the capital is willing to step in and push the price higher.
2In1
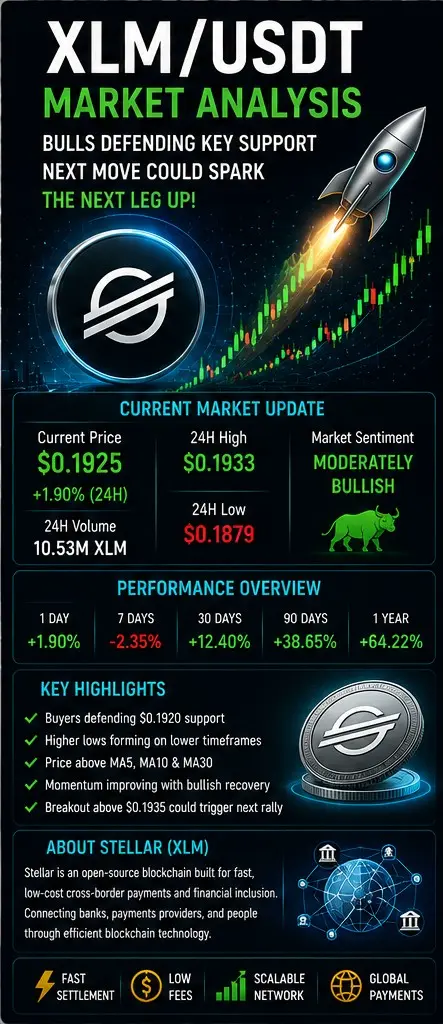
XLM/USDT Market Analysis
Market Overview
XLM/USDT is trading around $0.1925 at the time of analysis, showing a modest intraday recovery after defending the $0.1920 area.
Buyers have regained short-term momentum, but price remains close to an important resistance zone.
The market is currently in a consolidation phase where a breakout above resistance could trigger the next bullish leg, while rejection may lead to another retest of support.
Current Market Update
XLM has gained approximately 1.9% over the past 24 hours. Price has bounced from the session low near $0.1879 and is attempting to establish higher lows on lower timeframes.
Market sentiment remains cautiously bullish as buyers continue absorbing selling pressure.
Live/Current Price Overview (At the Time of Posting)
Current Price: $0.1925
24H High: $0.1933
24H Low: $0.1879
Daily Change: +1.9%
24H Volume: Moderate
Price Performance
XLM has stabilized after recent volatility and is attempting to recover lost ground.
While the broader trend still requires confirmation, short-term momentum has improved significantly.
Technical Analysis
Price is trading near the short-term moving averages while attempting to break above immediate resistance.
The recent bounce from support suggests buyers remain active.
Current structure indicates consolidation before the next directional move.
Market Structure
Short-term Structure: Bullish Recovery
Medium-term Structure: Neutral
Long-term Structure: Gradually Improving
Higher lows continue to develop, suggesting accumulation.
Trend Analysis
Immediate Trend: Mild Bullish
Intraday Trend: Positive
Overall Trend: Neutral to Bullish
Support Levels
Immediate Support: $0.1920
Major Support: $0.1900
Strong Demand Zone: $0.1880-$0.1890
Resistance Levels
Immediate Resistance: $0.1935
Major Resistance: $0.1950
Breakout Resistance: $0.1980
Psychological Resistance: $0.2000
Key Buying Zones
Conservative Entry: $0.1915-$0.1922
Aggressive Entry: $0.1885-$0.1900
Breakout Entry: Above $0.1935 with strong volume.
Key Selling Zones
Partial Profit: $0.1950
Main Profit Zone: $0.1980-$0.2000
Extended Target: $0.2050
Bullish Scenario
If XLM successfully breaks above $0.1935, buying momentum could accelerate toward $0.1950, followed by $0.1980 and eventually $0.2000. Increasing volume would strengthen the probability of continuation.
Bearish Scenario
Failure to hold $0.1920 could trigger a decline toward $0.1900.
Losing that level may expose $0.1880, where buyers are expected to defend aggressively.
Volume Analysis
Trading volume remains moderate.
A significant increase in buying volume during a breakout would confirm stronger bullish momentum.
Low volume near resistance may result in another rejection.
Momentum Indicators (RSI, MACD, Moving Averages)
RSI
RSI is recovering from neutral territory, indicating improving momentum without entering overbought conditions.
MACD
MACD is flattening after bearish momentum weakened. A bullish crossover would strengthen upside expectations.
Moving Averages
Price trades around MA5, MA10 and MA30.
Short-term moving averages are beginning to align positively.
Sustained trading above these averages would improve bullish confidence.
AI & Semiconductor Industry Update
Although XLM is not directly linked to AI or semiconductor companies, continued institutional investment into AI infrastructure has improved overall risk appetite across technology and digital assets.
Strong equity markets often provide indirect support for cryptocurrencies through improved investor sentiment.
Company Background
Stellar is an open-source blockchain focused on low-cost international payments, financial inclusion, and efficient cross-border settlements.
The Stellar network aims to connect banks, payment providers, and financial institutions through fast and inexpensive transactions.
Business Fundamentals
Stellar continues expanding through payment partnerships, tokenization initiatives, and real-world asset integrations.
Development activity remains healthy while network utility continues improving.
Institutional & Investor Sentiment
Institutional interest in payment-focused blockchain networks remains stable.
Long-term investors continue monitoring Stellar's ecosystem growth, partnerships, and adoption trends before increasing exposure.
Market Catalysts
Bitcoin market direction.
Overall crypto market sentiment.
Stablecoin adoption.
Cross-border payment demand.
New ecosystem partnerships.
Regulatory developments.
Increased blockchain adoption.
Risk Factors
High cryptocurrency volatility.
Bitcoin-led market corrections.
Weak trading volume.
Regulatory uncertainty.
Failure to break major resistance.
Global macroeconomic risks.
Today's Market Outlook
Today's outlook remains slightly bullish as long as XLM trades above $0.1920. A confirmed breakout above $0.1935 could trigger additional buying pressure.
Short-Term Outlook
Bias remains cautiously bullish.
Expected Range: $0.1920-$0.1950
Mid-Term Outlook
If XLM maintains higher lows and breaks above $0.2000, momentum could improve significantly with potential continuation toward higher resistance zones.
Long-Term Outlook
Long-term prospects remain constructive, supported by Stellar's focus on global payments, network development, and expanding blockchain adoption.
Futures Market Analysis
Open interest should be monitored for confirmation.
Rising Open Interest + Rising Price = Strong Bullish Signal
Rising Open Interest + Falling Price = Bearish Pressure
Funding Rate normalization would support sustainable upside.
Advanced Trading Strategy
Day Trade
Entry: $0.1918-$0.1923
Stop Loss: Below $0.1900
Targets:
TP1: $0.1935
TP2: $0.1950
TP3: $0.1980
Breakout Trade
Wait for a confirmed candle close above $0.1935 accompanied by strong volume before entering.
Risk Management Tips
Risk only 1-2% of total capital per trade.
Always use a stop loss.
Scale profits at resistance levels.
Avoid chasing breakouts without volume confirmation.
Monitor Bitcoin before opening leveraged positions.
Essential Support & Resistance Levels
Support
$0.1920
$0.1900
$0.1880
Resistance
$0.1935
$0.1950
$0.1980
$0.2000
Key Price Targets
Bullish Targets
$0.1935
$0.1950
$0.1980
$0.2000
$0.2050
Bearish Targets
$0.1920
$0.1900
$0.1880
Trading Plan for Swing & Day Traders
Swing Traders
Accumulate near support while maintaining stops below major demand. Consider scaling out near resistance.
Day Traders
Trade only confirmed breakouts or pullbacks toward support. Avoid overleveraging during consolidation.
Investment Perspective
For long-term investors, Stellar remains an interesting blockchain focused on payments and financial infrastructure.
Short-term volatility is expected, but gradual accumulation near strong support levels may offer favorable risk-reward if adoption continues to grow.
Conclusion
XLM is attempting to build bullish momentum after defending key support around $0.1920.
The next major test lies near $0.1935-$0.1950.
A breakout above resistance with increasing volume could open the door toward $0.2000, while losing support may lead to another pullback toward $0.1900.
Traders should remain disciplined and manage risk carefully until a clear directional breakout develo.
#XLMMarketAnalysis
repost-content-media
XLM-1.35%
Robinhood Chain data is interesting—SpaceX tokenization is actually almost catching up to Nvidia, and the on-chain experiments by traditional brokerages are indeed working.
WuSaidBlockchainW
According to Token Terminal data, the number of tokenized stock and ETF holding addresses on the Robinhood Chain has reached 37k, accounting for 6.9% of all tokenized stock holding addresses. The related assets cover 88 reference stocks and 94 tokenized assets. By reference stock, the tokenized tokens related to Nvidia, SpaceX, Apple, and Google have approximately 4,500, 4,400, 4,300, and 3,600 holding addresses, representing 12.1%, 12.0%, 11.6%, and 9.8%, respectively.
HOOD+2.02%
SPCX+6.33%
SPCXG+4.72%
SPCXX+4.54%
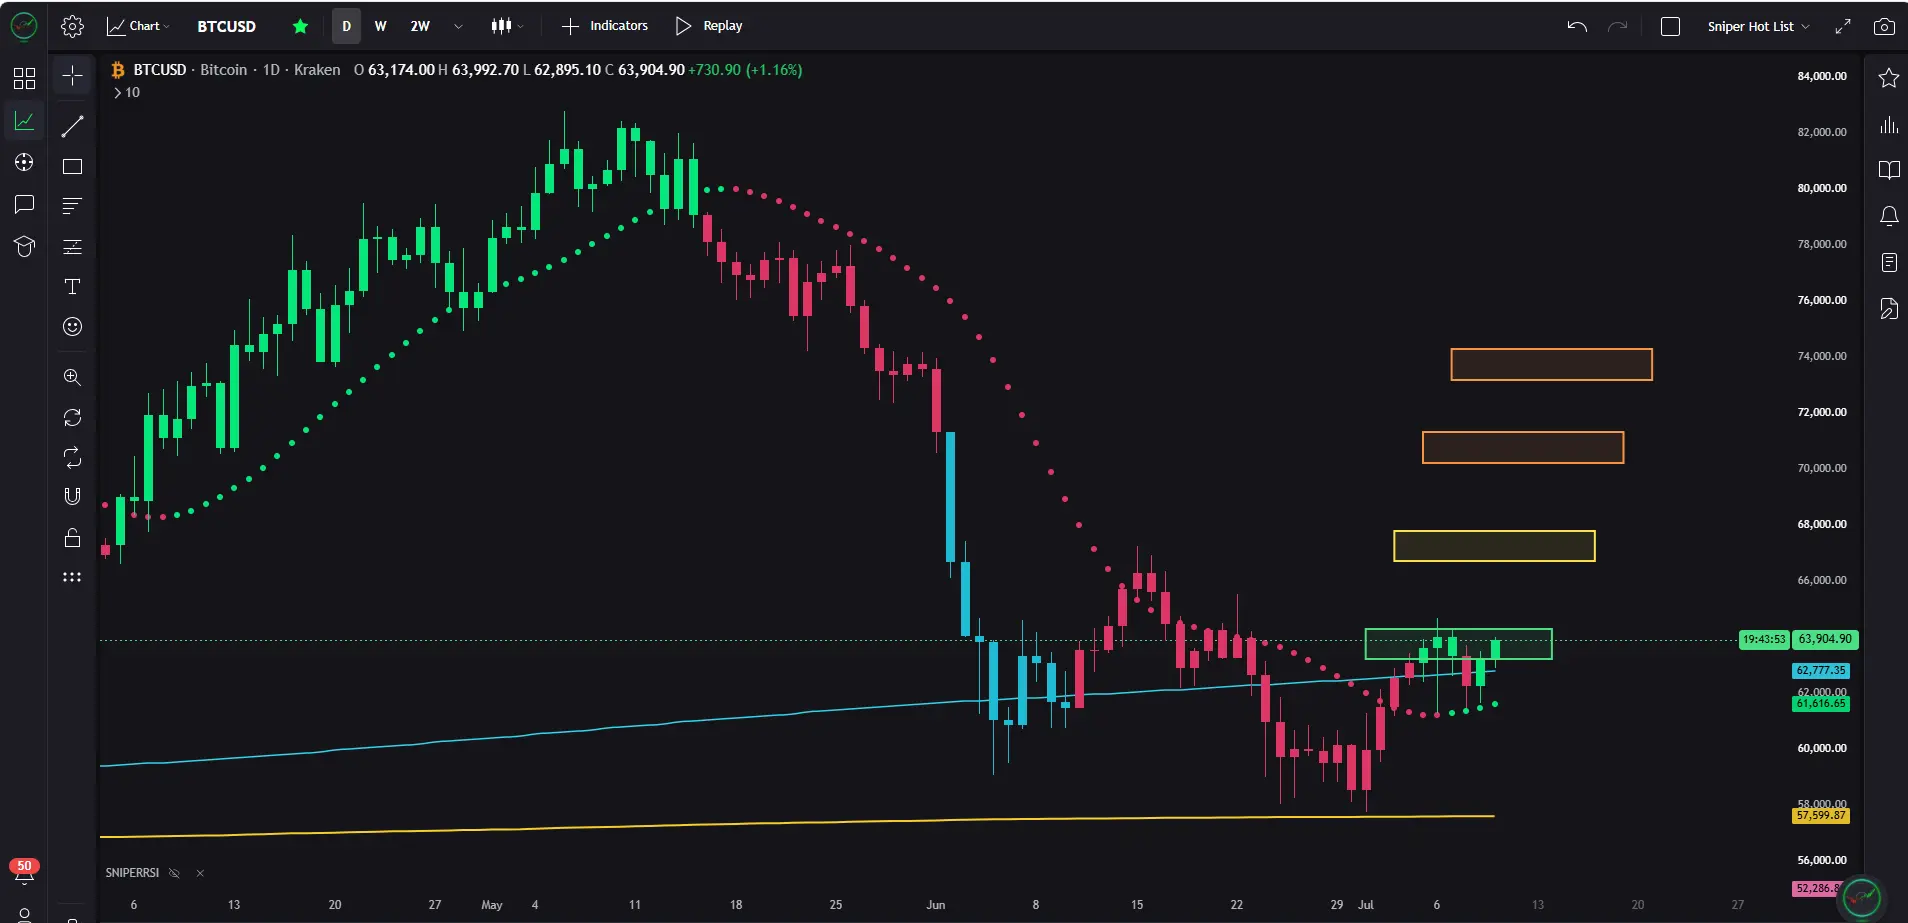
The daily structure is stable, the probability of the yellow target area increases, continue to observe volume support.
CryptoZeno
$BTC is bullish on the daily chart, bounce continues.
Bullish divergence -> Target one hit -> Higher low -> Trending dots retested
Probabilities have increased of hitting yellow box.
repost-content-media
Citadel’s move is very realistic: there’s no money to be had by continuing the US lawsuit, so it simply shifts to filing for bankruptcy in the UK to pursue debt collection, and the Portofino founder is going to have a headache.
WuSaidBlockchainW
According to CoinDesk, global market maker Citadel Securities has withdrawn its U.S. trade secrets lawsuit against crypto market maker Portofino Technologies and has applied to the High Court of England and Wales to seek a declaration that Portofino founder Leonard Lancia is bankrupt. Citadel said that it previously obtained approximately £5.98 million in compensation and related costs in a London arbitration, but has been unable to collect the payment, and therefore continuing to pursue the U.S. lawsuit has no practical economic significance. Portofino was founded in 2021 by former Citadel Securities executives and primarily provides digital asset market making, over-the-counter (OTC) trading, and liquidity services to institutional clients.
The situation in the Strait of Hormuz is about to shake the energy supply chain again, and the geopolitical risk premium is likely to rise.
Original content no longer visible
Indicators are static, but trading systems are dynamic. Black swan events like geopolitical conflicts cannot wash away those who truly understand the trend. The upside space is still there; wait for the level notification.
HundredfoldLittleWei
Eight consecutive wins, let's briefly analyze the market:
Since the start of July, there has been a small upward trend, and we fully captured it—eight consecutive wins plus a trend long order. The last trade was our smallest gain (partially took profit, the rest hit breakeven). Recently, I feel the market will undergo some consolidation before choosing a direction. With the bearish factor of the US-Iran geopolitical conflict, it's a downward correction amid consolidation.
For now, the direction is still upward (high probability). As long as there are no major bearish events, this is a phase of washout, accumulation, and consolidation. There's still room to rise above, and the consolidation range will shake out many people. The trend isn't over yet. Let the market play out a bit, and I'll notify specific entry points later.
I don't like doing indicator analysis because indicators constantly change and many people can't understand them. Relying entirely on indicators can control and limit you. My personal analysis is based on my own trading system (current indicators + trend analysis + experience summary).
repost-content-media
Parallel sharding is getting lively again, everyone in the groups is talking about how high TPS can get. I looked back at my record of being stuck on a bridge for the third time, forget it, let's not talk about performance for now.
Simply put, the excitement belongs to others, but the private key is your own. Last week, I saw the U.S. dollar index and risk assets bouncing around together, with rate cut expectations swinging like a pendulum. Anyway, I'm a low-frequency DCA investor, so I can't be bothered to guess. On-chain funds are indeed moving, but where they flow and who is actually buying
USIDX-0.11%
An exchange opened by the son of a politician, built by the co-founder’s investment in Ripple—what a perfectly timed moment during the Clarity Act negotiations.
Original content no longer visible
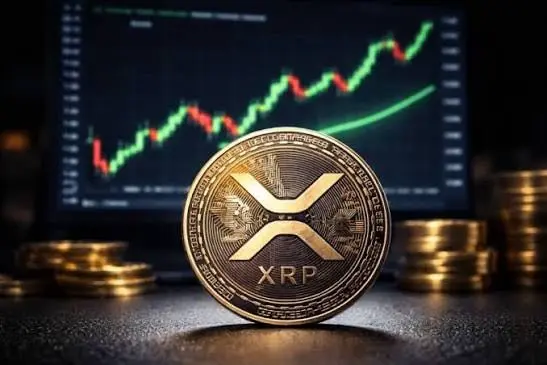
Short-term fluctuations are fluctuations, but in the long run, XRP's position in global digital payments is solid. Continue to observe key levels.
KingAlpha
XRP Latest News
XRP is attracting renewed attention as investors monitor growing institutional interest and broader adoption of blockchain-based payment solutions.
Market analysts believe XRP could benefit from increasing demand for faster and lower-cost cross-border transactions if overall crypto market sentiment continues to improve.
Trading activity has remained active, with investors watching key support and resistance levels for signs of the next major price movement.
While short-term volatility is expected, many analysts remain optimistic about XRP's long-term role in the global digital payments ecosystem.#GateStocksTransferLive #CirclePlunges17% #PredictWorldCup🇵🇹vs🇭🇷 #GateCardPointsSystemLaunched #NFPCountdown $XRP ‌$XRP ‌
repost-content-media
XRP-0.67%
Traditional financial giants are accelerating their on-chain transformation, seven major currencies are available for 24/7 programmable settlement — this pace makes native DeFi protocols sweat.
Original content no longer visible
The BIS report is quite interesting: stablecoins haven't weakened the dollar but have instead become an accelerator of dollarization. Central banks in developing countries will be losing sleep.
Original content no longer visible
Sofi, with $36 billion in assets under management, enters the Bitcoin Lightning Network. The attitude of the US banking industry towards Crypto is undergoing a structural shift—remittance scenarios are just the first step; the reconstruction of payment infrastructure has only just begun.
Original content no longer visible
SOFI+0.06%
BTC-0.53%