
Square
Following
Hot
News
Profile
Share your thoughts
placeholder
Article
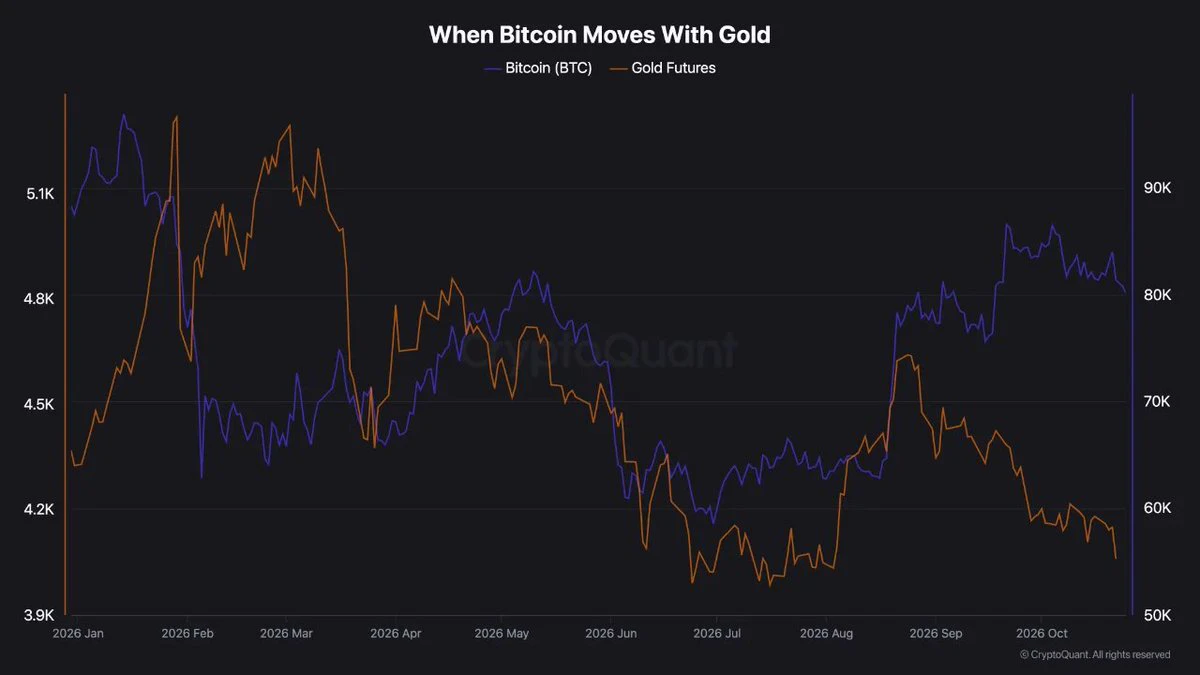
#美国9月PPI大超预期 The “data vacuum” is approaching. How will gold and silver prices move?
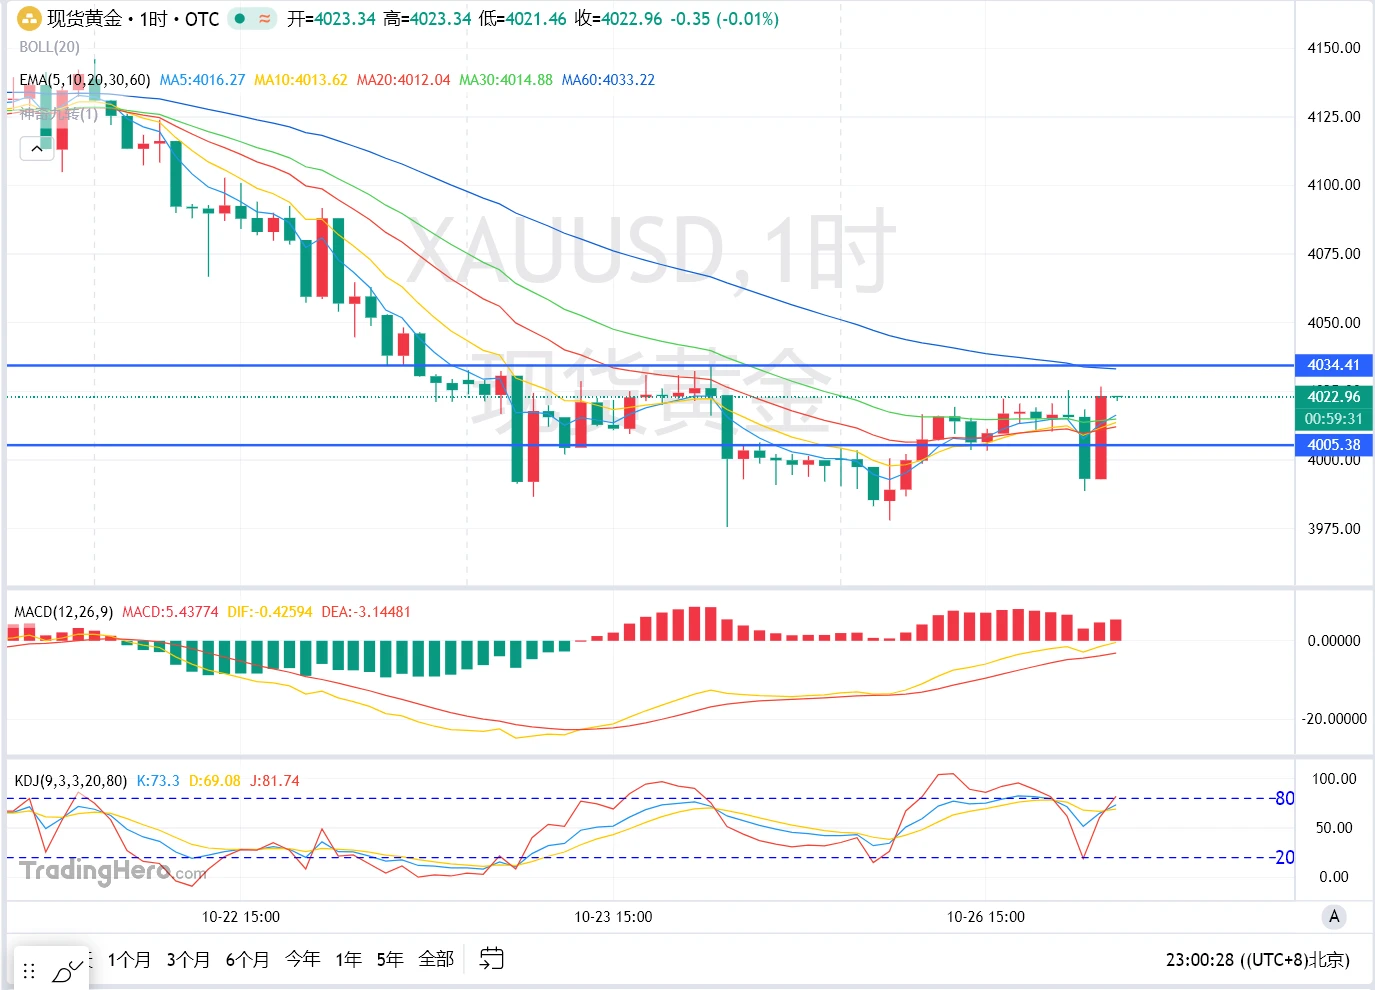
Recently, gold and silver prices rebounded somewhat after a downturn, showing signs of stabilizing. Wang Weimang, an analyst at Zhonghui Futures, told Futures Daily that the rebound in gold and silver prices was driven by interest rates and safe-haven demand.
“The rapid decline in long-term U.S. Treasury yields was the direct driver of the rebound in gold and silver prices,” Wang Weimang said. Against the backdrop of U.S. September inflation data exceeding expectations, AI technology stocks faced a global sell
post-image
GLDX-0.17%
PAXG-0.17%
XAU-0.11%
XAG-0.19%
🔥GRAM can’t move higher! Anyone who chased the pump is left holding the bag!
GRAM surged to $1.37 today and then fizzled out, with a 24h change of +0% and shrinking volume. The bulls have fired their last bullets. Anyone jumping in now is lining up to hold the bag. Nine out of ten people chasing the highs are just helping the market makers cash out; the other one is paying tuition. Charging in at these levels isn’t bravery—it’s having money to burn.
1. Event: GRAM failed to break above its 24h high of $1.37 and pulled back after its run-up. Bullish momentum has completely dried up. Stalling a
post-image
GRAM-0.20%
Trenches
AGT
A
bade
b
AGT
0x5d...e274
Market Cap
$.
Change
.
24h Vol
$.
Holders
.
TSI
T
bade
b
TSI
0xf1...7b07
Market Cap
$
Change
.
24h Vol
$.
Holders
CNPY
C
bade
b
CNPY
0xc6...ddd2
Market Cap
$.
Change
.
24h Vol
$.
Holders
.
Q
Q
bade
b
Q
0xc0...0589
Market Cap
$.
Change
.
24h Vol
$.
Holders
.
Gato
G
bade
b
Gato
55A3...pump
Market Cap
$.
Change
.
24h Vol
$.
Holders
.
🔥 $HBAR
After rebounding from recent lows, bullish rebound signs have emerged! Buyers entered near the $0.082 support zone, pushing the price back up to around $0.087. If bullish momentum continues and resistance is broken, HBAR could continue to rebound to higher levels. 🚀Take Profit: 0.11572Stop Loss: 0.08125Go Long $HBAR 👇
post-image
HBAR+1.80%
$XMR Breakout! Early buyers are reaping big gains
Remember when I recommended buying $XMR below $400? Look at the price now. XMR has nearly reached $600, and buyers who entered around $400 are up nearly 50%. This is exactly why I always say to buy near strong support instead of chasing prices after a major rally. Bullish momentum remains strong, and the price is currently testing the resistance zone around $600. A decisive break above $600 could pave the way for further gains toward $650 and $700. Early buyers are already sitting on substantial profits. This breakout is unfolding as expected.
post-image
XMR+0.00%
#沃什IMF讲话 #ShareWeekly
Warsh’s IMF Speech: What Could It Mean for Inflation, Interest Rates, Bitcoin, and Global Markets?
Global financial markets are paying close attention to monetary policy as investors evaluate inflation risks, interest rate expectations, and the future direction of the US economy. Against this backdrop, has become an important topic for market discussion, particularly among investors following Bitcoin, technology stocks, gold, and other risk-sensitive assets.
Remarks by Kevin Warsh at an International Monetary Fund event can attract attention because markets are constantl
post-image
BTC+0.28%
XAU-0.11%
#每周来晒 #美国9月PPI大超预期 The week after the double inflation beat: what the market actually did
Two hot inflation reports landed in two days, and the verdict is in. Stocks fell, bonds steadied, the Fed odds cooled and Bitcoin held its ground. Here is the final scorecard as of Sunday, October 18, followed by an if-then framework for next week.
What the data said
September CPI rose 3.7% against 3.6% expected, and producer prices rose 1.3% on the month and 6.3% on the year. The surprise sat in the details, since core PPI rose 0.7% against a 0.3% forecast.
How each market responded
US stocks: tech took
BTC+0.28%
MU-5.66%
AMD-5.98%
DOW+0.96%
GLD-0.16%
Ring rebounded after nearing 75.28, with support at 75.2. Amid a broad-based sell-off, Ring is holding up relatively well. Figure 2 shows its wave pattern and range. $CRCL ‌
CRCL+0.16%
Caught $ERA
’s breakout move, with huge volume and negative funding rates pushing the price above the range high. 🟢 cleanly profited 93% on this move. 🚀 ✅ Profit: $213. Continue watching $ETH and keep an eye on $EPIC .
post-image
EPIC+21.83%
Last night, I followed a friend's trades and turned a swing trade into a big move, making 154 points overnight.
The sleep trades were posted at 12 a.m.
The long at 2398 made 26 points, the short at 2416 made 61 points, the long at 2366 made 55 points, and the short at 2416 this morning made 12 points. 154 points in total.
No stop-losses. It went very smoothly.
The streamer has just started livestreaming. You can subscribe to the sleep trades for 1GT. Please follow.
You can watch the replay to see whether the streamer is fake.$ETH
post-image
ETH-0.45%
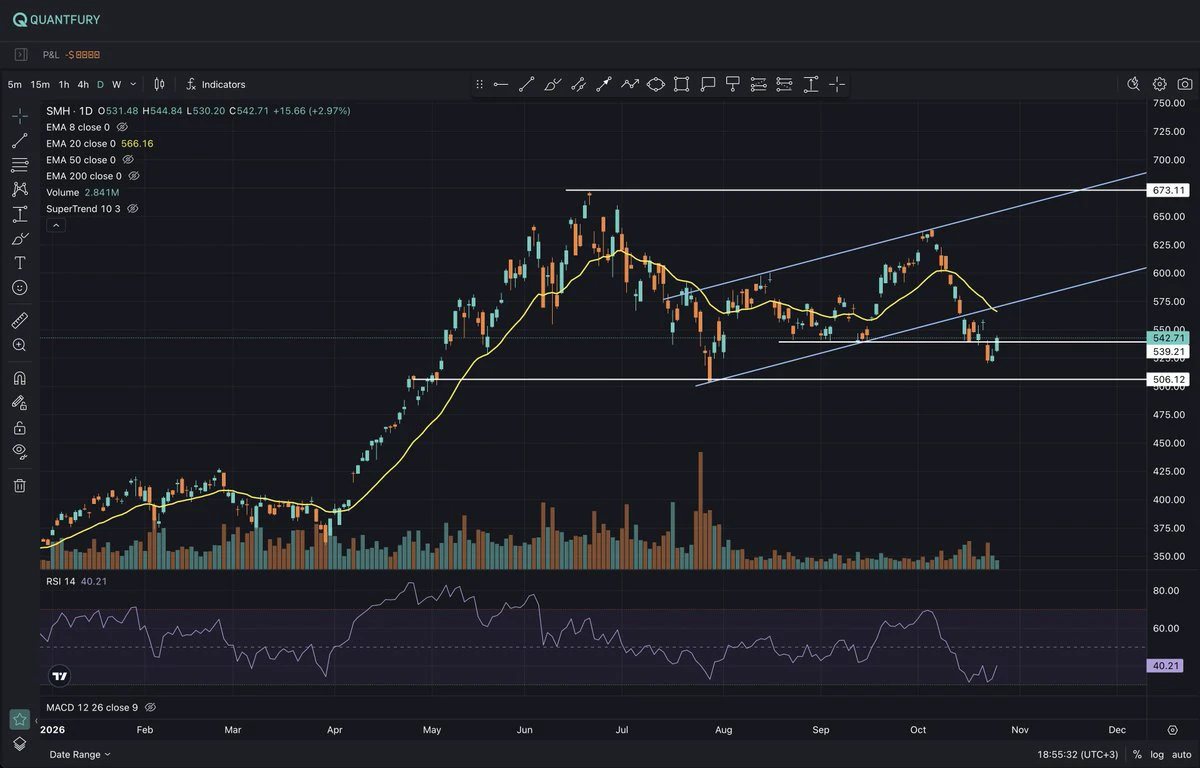
$SOXS Strong Bullish Rebound
As SOXS surges from 33.63 to 50.94, the rally is gaining strong momentum, rebounding an impressive 51% from its recent low. Buyers have broken through multiple resistance levels, and the 4-hour chart continues to show higher highs and higher lows. The key zone to watch now is 49–50. As long as this area holds, the price could test 53.30 again, and even 55–58. A drop below 49 could trigger a deeper pullback. The rebound is strong, with plenty of momentum. The bulls remain in control for now. $SOXS
post-image
SOXS+12.63%
It rained all day yesterday🌧️, so I stayed home all day. Woke up to bright sunshine today, and when I opened the exchange, my BTC long at 80888, ETH long at 2376, and Sol long had all filled. Did you guys get filled and make money? I placed small orders before bed, and the market maker woke me up with a whole day’s worth of spending coupons.
post-image
BTC+0.26%
ETH-0.45%
SOL-0.91%
BTC MARKET UPDATES
live-cover
LIVE1,551
$btc short
4.45R
Details on chart
0.3% risk
BTC+0.26%
I think 2026 is a transition window from the late depression phase of the fifth Kondratiev wave (information technology) to the recovery phase of the sixth (AI + energy)
The defining feature is not broad-based prosperity, but repeated bottoming and structural divergence. High interest rates (the 10-year yield at around 5.1%) remain the main constraint.
Asset outlook:
• U.S. tech stocks/Nasdaq: The long-term direction is right, but volatility is likely in the medium term; dollar-cost averaging is preferable to chasing highs
• Bitcoin: The early recovery is continuing, but it looks more like a h
post-image
BTC+0.28%
EIA data determines the short-term direction of crude oil
live-cover
LIVE32
#GateBTCAndETHFuturesVolumeRanksTop3
Gate BTC and ETH Futures Trading Volume: Can the Momentum Continue?
In my view, the momentum Gate is seeing in the derivatives market could persist; however, sustainable growth depends on whether this increased trading activity is driven by lasting demand rather than mere short-term speculation.
The reported figures are encouraging: with BTC and ETH in an uptrend, Gate ranks among the top three exchanges globally for futures trading volume in both assets, with BTC futures volume reaching approximately $7.18 billion over a 24-hour period.
Nevertheless, high
BTC+0.26%
ETH-0.45%
Sentiment Shift: Is Returning "Greed" Fueling the Next Leg Up, or Is the Market Overheating?
The Crypto Fear & Greed Index has shifted back into the Greed zone as risk appetite improves across the market. With $BTC , $ETH , and other major assets showing signs of strength, market sentiment is recovering quickly. This raises a crucial question: will this greed fuel the next leg higher, or is the market starting to overheat?
Rather than relying on emotions, let's break down the current technical picture for BTC and ETH based on recent price action.
📊 Bitcoin (BTC/USDT) Analysis
Looking at the dai
BTC+0.28%
ETH-0.39%
#每周来晒 #USSeptemberPPIDataRelease
#USSeptemberPPIBeatsExpectations
September PPI beat expectations by a wide margin, and the market's reaction tells a more interesting story than the number itself. The report came out at 20:30 Beijing time on Thursday, October 15. Producer prices rose 1.3% on the month against about 0.6% expected, and the annual rate hit 6.3% against a consensus of 5.5%, with energy up 10.8%. That makes the monthly gain more than double the forecast, so the answer to whether it exceeded expectations is a clear yes.
Inflationary pressure on the production side is strong, and i
CME+1.49%
US500-1.06%
BTC+0.28%
Load More

Join 40 M users in our growing community

⚡️ Join 40 M users in the crypto craze discussion

💬 Engage with your favorite top creators

👍 See what interests you

Trending Topics

USSeptemberPPIBeatsExpectations

91.35k Views1.93k Discussing

US September PPI came in at 6.3% YoY, well above the 5.3% market expectation, pointing to renewed producer-side inflation pressure. Weekly jobless claims were 199K, broadly in line with forecasts. Could hotter inflation further reduce room for rate cuts, and what does it mean for $BTC, US stocks, and gold?

GateWCTCS9GlobalTradingCompetition

37.87k Views6.7k Discussing

GateBTCAndETHFuturesVolumeRanksTop3

53.8k Views1.84k Discussing

View More