Square
Following
Hot
News
Notifications
Profile
Share your thoughts
placeholder
Article
#ShareWeekly #BTC #WCTCS9

Bitcoin approaching the $80,000 level creates an interesting situation for the crypto market. This is not just another psychological price milestone. It could become an important turning point for market sentiment, especially if a large number of leveraged short positions are forced to close.

The reported $1.45 billion in potential short liquidations deserves attention, but I believe traders should understand how a short squeeze actually develops before assuming that BTC will automatically experience a massive rally.

Why Is $80,000 So Important?

The $80,000 level
BTC-0.65%
  • 1
One week, 13 trades, 12 wins. Return: 3509.17%, average return per trade: 269.94%.
The numbers don't lie.
Trading isn't that mysterious; it's just eight words: lose less when you lose, make more when you win. $ETH ‌$BTC ‌#10月非农数据聚焦
ETH-1.23%
BTC-0.65%
Trenches
ZIG
Z
bade
b
ZIG
0x8c...1145
Market Cap
$.
Change
.
24h Vol
$.
Holders
.
BTC
B
bade
b
BTC
C5xp...pump
Market Cap
$.
Change
.
24h Vol
$.
Holders
.
Diamond
D
bade
b
Diamond
5VCE...pump
Market Cap
$.
Change
.
24h Vol
$.
Holders
.
DOGE
D
bade
b
DOGE
DoGE...fm7R
Market Cap
$.
Change
.
24h Vol
$.
Holders
.
STONK
S
bade
b
STONK
6GmA...UNgx
Market Cap
$.
Change
.
24h Vol
$.
Holders
.
GT markets predictions
live-cover
LIVE2,273
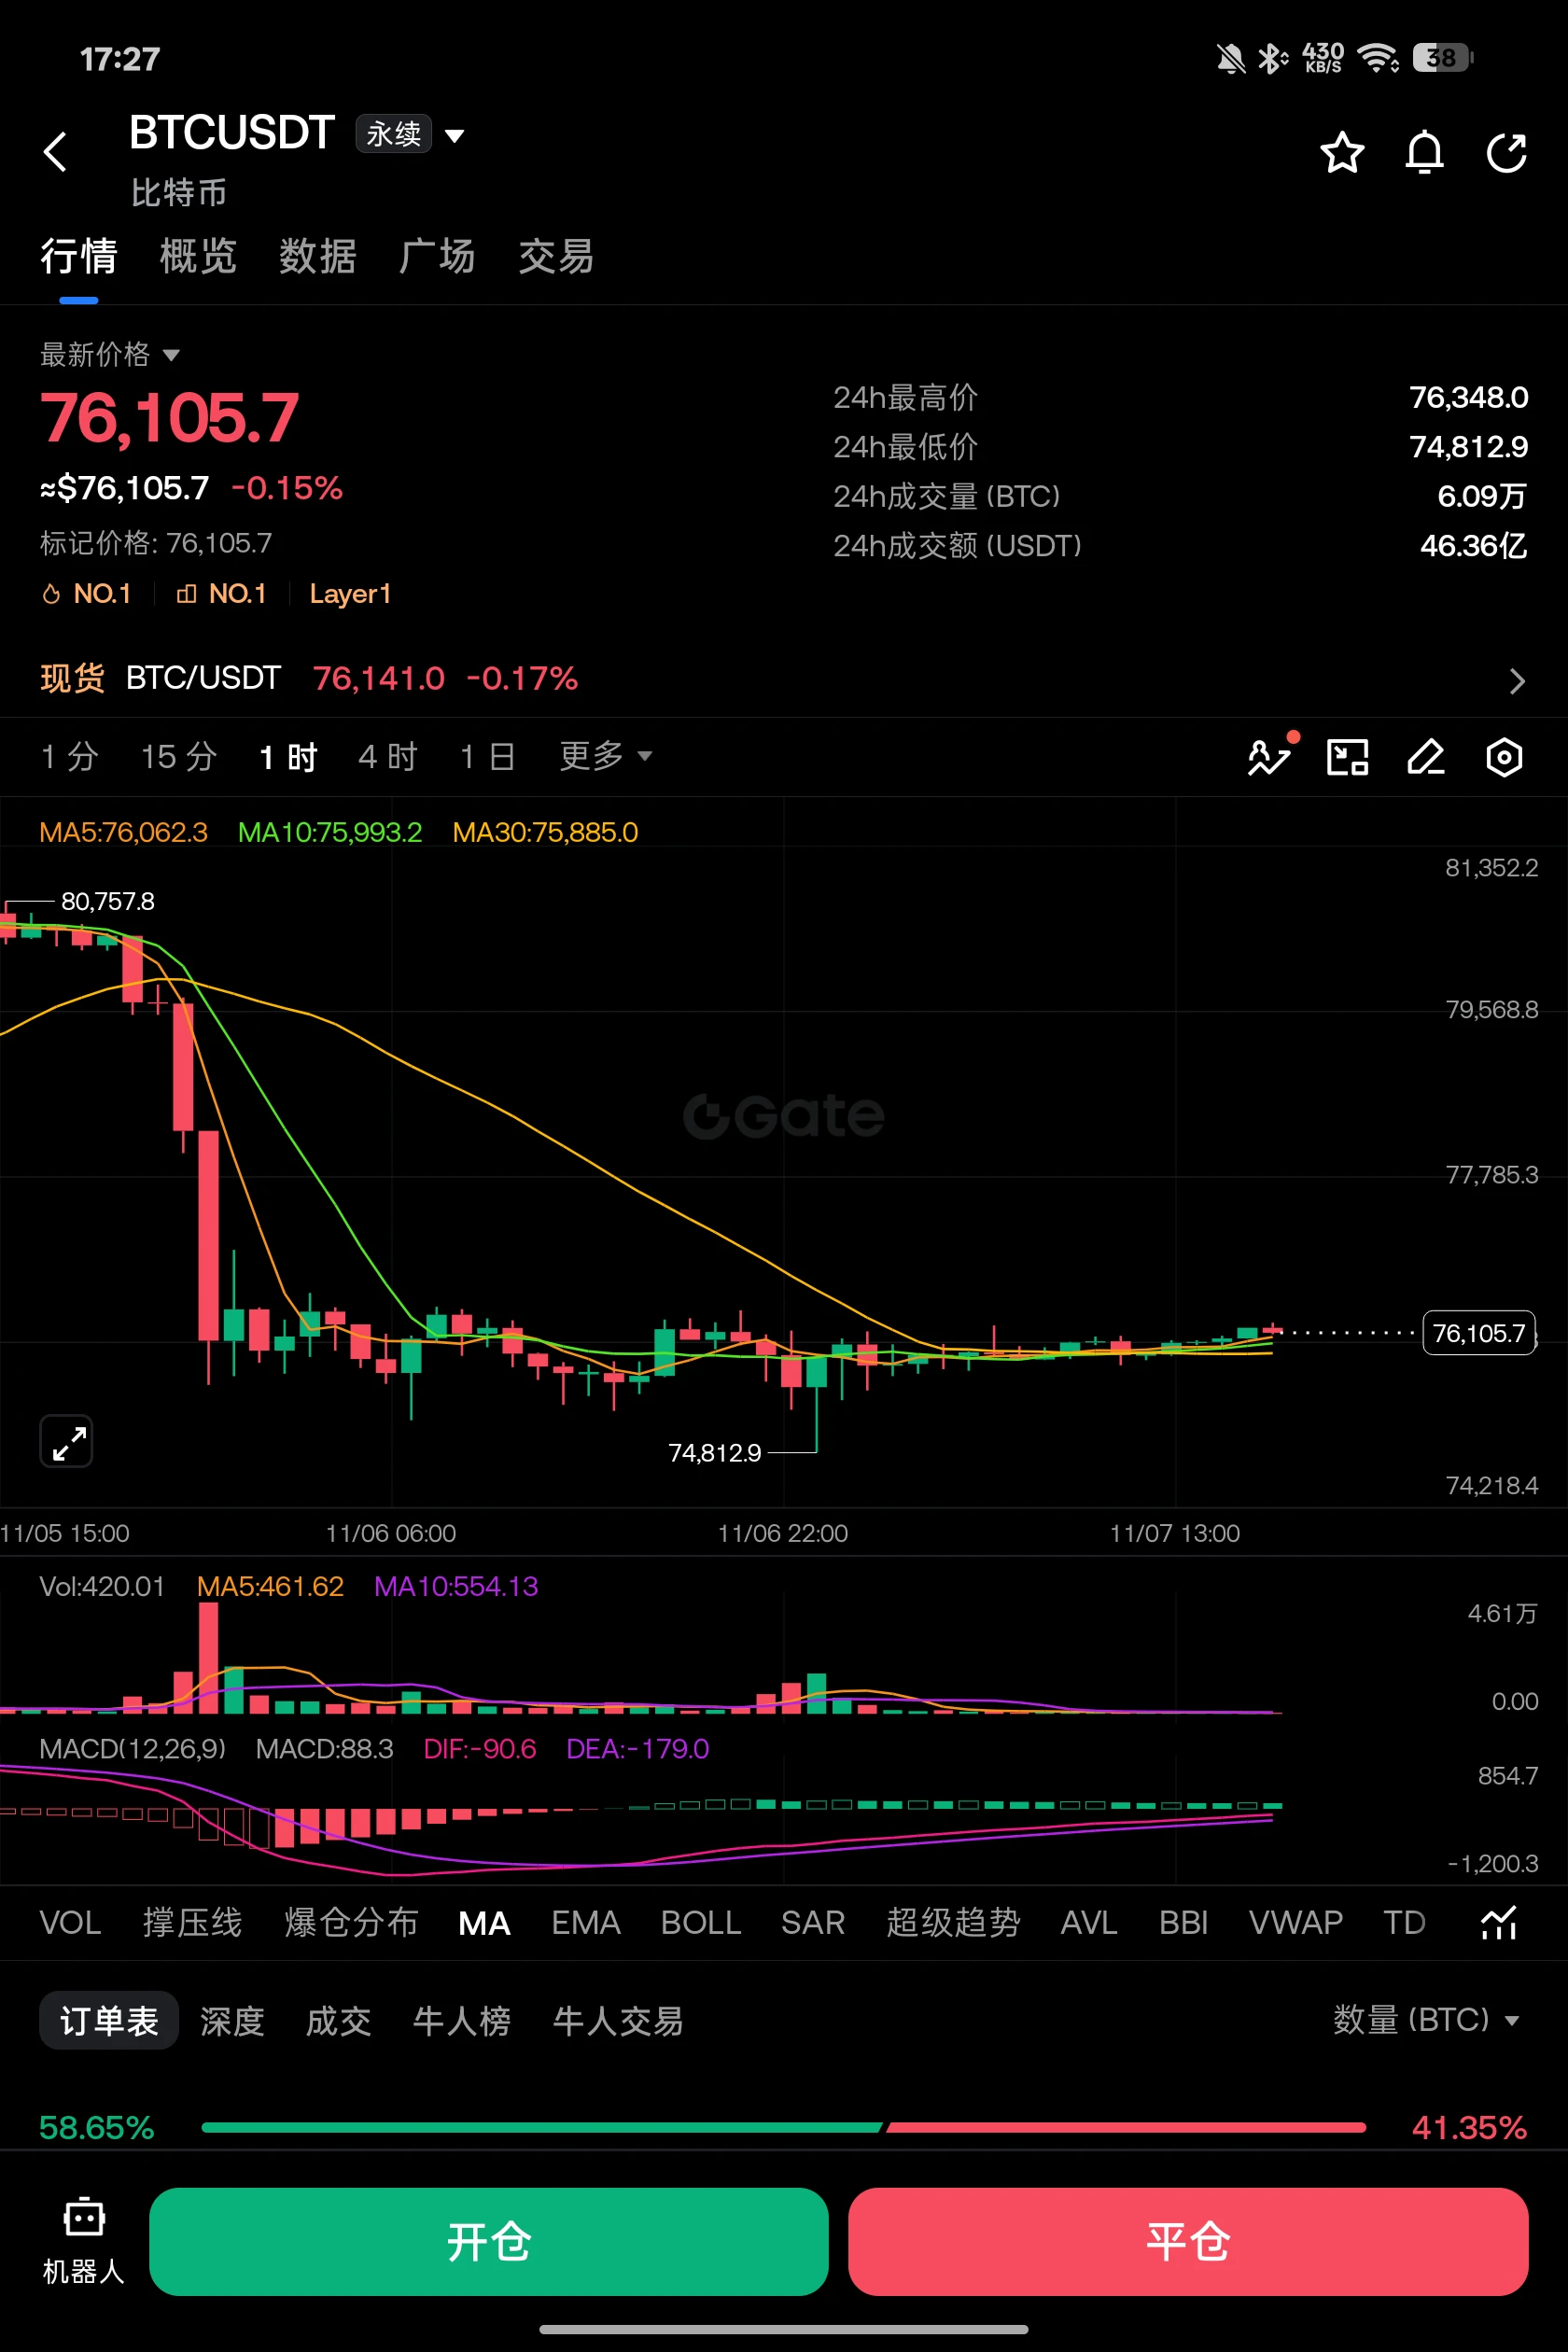
At $76,200 BTC, would you still dare to buy the dip?
BTC at 76,200, would you still dare to buy the dip? ETFs saw $1.28 billion in outflows in a week, payrolls blew past expectations, and more than $1 billion in longs got buried—75k just held. Is this the final leg down, or just the appetizer before a bear market?

First, the surface picture: trading between 75k and 76.5k—looks like things have stabilized?
Volatility has narrowed over the past 24 hours. Weekend liquidity is low, and the price is moving sideways between 75,000–76,500. You open the chart, see 75k holding, and think: Could things
post-image
BTC-0.67%
ETH-1.26%
SOL-0.77%
Compared with the dot-com bubble, the Nasdaq has only climbed 2.2x during this AI boom, versus 4.2x over the same period in 1999. This time around, things are much less frenzied, and the valuation gap is actually much smaller. So don’t force the bubble narrative—slower gains don’t mean there’s no upside. Can $BTC hit $120,000? We’ll know by the end of the month. If you’re watching, follow along.
post-image
NAS100-0.07%
BTC-0.67%
Just came across this from Keplr
Another social login incident
The team says some wallets created using Google or Apple login
Had unauthorized transactions
These two login methods have been paused
They’re investigating with Web3Auth
Accounts restored with a recovery phrase
Hardware wallet users
Are preliminarily assessed to be unaffected
If you created your account by clicking social login
Don’t transfer any new funds into it
And don’t rush to export it elsewhere and set it up again
Treat all unofficial recovery links as scams
Convenience and holding your own keys
Will always be at odds
I’m go
post-image
“I Only Do Three Things a Day, and My Account Became More Stable”) I used to watch the market for twelve hours a day, and my account kept shrinking. Later, I turned trading into a “clock-in, clock-out” routine, and my account became more stable. 06:30 Wake up. Don’t look at prices yet; just check where the daily candle closed and whether the 4H direction has changed. Is it up or down? Is volume higher or lower than yesterday? A quick glance tells you. If the direction is unclear, I don’t trade that day. This takes five minutes and can save me from a whole day of impulsive trades. 12:00 Take on
post-image
BTC-0.65%
ETH-1.23%
  • 1
  • 1
How should you read on-chain data? How can large transfers indicate market trends?
In the cryptocurrency market, many people watch candlestick charts and trading volume every day, but overlook a very important source of information: on-chain data.
Especially when large Bitcoin transfers occur, many traders immediately speculate: Is a whale preparing to sell? Are institutions buying in large quantities?
But do large transfers really mean that prices are about to change?
First, distinguish between funds flowing into and out of exchanges. Large amounts of BTC transferred to exchanges may mean hol
post-image
BTC-0.67%
“My Trading Journal Has Only Five Columns, but It Has Saved Me Many Times” Memory can deceive you. You remember the trades where you “almost made money,” while losing trades automatically get blurry. So don’t rely on memory—write things down. My journal has just five columns; even one more would feel like a hassle:

1. Date + coin: 2026-11-07 BTC
2. Reason for entry (one sentence): 4H broke below 75,400 and failed to reclaim it on the retest; went short
3. Three planned prices: Entry 75,300|Stop-loss 76,200|Target 73,500
4. Result: Stopped out -0.9R
5. Emotion + error tag: A little impatient,
post-image
BTC-0.65%
“Smart Money Blogger Weekly Review” Episode 15 · Gold Strategy: All 20 Trades Entered, Uniform Stop-Losses, Steady as Clockwork

Keep losing money on your own trades? It’s not because you aren’t trying hard enough—you just need a reliable reference. Every week, we review well-known influencers across the internet, letting real results and data speak for themselves.

This guy posted 20 gold signals in half a month, and every single one could be entered. His trade setups are the most complete: entry range, two targets, and a stop-loss, all provided at once, with nothing left vague. The ranges ar
XAU+0.38%
I often see a certain big shot sharing LP arbitrage strategies. He often trades on aero, and the returns look pretty high. The actual LP range is 0.1%.
If you increase it to 1%, the returns drop rapidly, and may even be lower than on Pancake. At least Pancake still has 260%, while aero may only have 20%.
AERO-2.98%
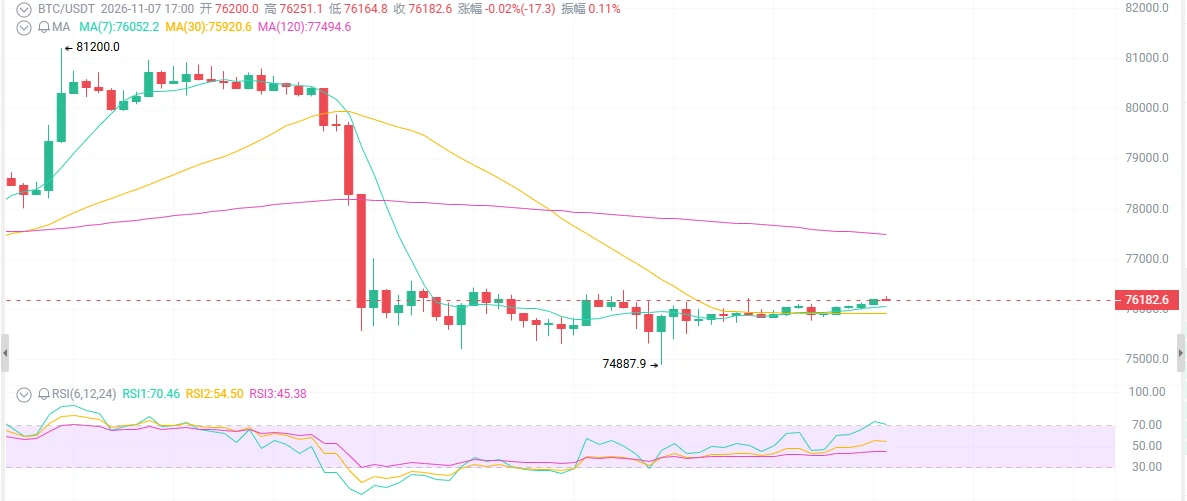
From 81,196 down to 74,888—a $6,308 drop. For anyone long with 10x leverage, that drop was enough to liquidate you twice.

The structure is laid out here, one level at a time:

Downside: 74,888 is the low of this move. Below that is the daily MA200 at 73,200, the last major-cycle threshold. A break below it would mean a genuine change in trend.

Upside: The daily MA100 at 77,200 is the first hurdle; above that, 77,500–78,000 is a double resistance zone formed by the 4H MA20 and MA50. Until price reclaims 77,200, any bounce is just a bounce.

Moving averages: The daily MA5, MA10, MA20, and MA50
post-image
BTC-0.65%
“I'm Telling 90% of People to Stay Away from Contracts” isn't because I'm afraid you'll make money—it's because I'm afraid you'll ruin your life. Most people who lose money in this market don't lose because of their technical skills; they lose because they sit down at the table before they're ready. ① You haven't even held spot for three full months or seen a complete cycle of gains and losses, yet you're jumping into 20x leverage. With spot, at least you know what you're holding. Contracts give you nothing but a number that keeps jumping around. This isn't trading; it's paying for a thrill.

post-image
BTC-0.65%
ETH-1.23%
Sentiment sits at extreme fear, yet $BTC gained 0.60% in the 24 hours to Nov 7. US buyers have priced it under the rest of the world for 63 straight days. On $SOL , open bets grew 2.6% as price rose, with longs building.
BTC-0.67%
SOL-0.74%
The market is fluctuating slightly, and the strategy is entering with a pending order#美股AI板块遭遇重挫
post-image
TheGreatWayIsFormless,YetIAm
Ethereum Bitcoin Strategy #US AI stocks sector suffers a major setback
Big Tech earnings this week are the real test. The playbook in India—banks leading while tech lags—may not play out the same way in U.S. stocks. Whether all that AI spending can turn into profits comes down to the guidance from these companies. If guidance is soft, the Nasdaq will take the first hit; if it’s strong, they’ll have passed the test. I’m leaning toward soft guidance, and I hope I’m wrong—because if I am, it means the rally is still alive. Keep an eye on these companies.
post-image
NAS100-0.07%
  • 1
☀️ GM! The market suddenly hit the brakes—what signal will tonight’s nonfarm report flash? 🚦
The Nasdaq plunged 5.52% last night, while BTC pulled back to around $76K . The U.S. nonfarm payrolls report is due out tonight at 21:30. 👀

📌 Today’s featured topic: How will you adjust your trading strategy ahead of the nonfarm report?
🔴 Risk watch: Will U.S. stocks and BTC remain under pressure?
🟡 Waiting for confirmation: What changes could the nonfarm report bring?
🟢 Looking for opportunities: Are there any assets worth watching in this pullback?

🎁 Come share your nonfarm predictions and t
NDAQ+0.28%
BTC-0.67%
  • 6
Market Condition Analysis
live-cover
LIVE1,380
Turns out there really is a demon-revealing mirror in real life.
The top donor saw it and immediately blocked them.
post-image
Load More

Join 40 M users in our growing community

⚡️ Join 40 M users in the crypto craze discussion

💬 Engage with your favorite top creators

👍 See what interests you

Trending Topics

USAIStocksHitHard

17.41k Views3.65k Discussing

U.S. stocks sold off sharply on Thursday, November 5 (UTC). The Nasdaq closed down around 5.5%, entering correction territory, while the Philadelphia Semiconductor Index plunged roughly 12%, with chip stocks including $NVDA and $AMD posting steep losses. Beyond profit-taking, investors are growing concerned about the pace of AI data center construction, capital spending, and future returns on investment. The key question now is whether the AI sector’s lofty growth expectations need to be repriced. Where do you think the next opportunities will emerge: chip stocks, tech giants, or other sectors?

USNonfarmPayrolls

26.04k Views4.28k Discussing

StakeOnLaunchpoolToShare450KVLX

4.29k Views786 Discussing

View More