
Square
Following
Hot
News
Notifications
Profile
Share your thoughts
placeholder
Article
On the 4-hour chart, $SOL short from 68.8. Sellers must hold here. Price is approaching resistance. I want to see a rejection wick, not sideways chop within the zone. If the close is above 69.7, I’ll abandon this idea. On the 4-hour chart, price is 68.8, below the 73.3 EMA50, so sellers remain in control of the trend. The stop distance is 1.3%, and the TP3 target distance is 2.1%, for a 1.6R risk/reward ratio if reached. Short zone 68.70–68.85 | Targets 68.24, 67.88, 67.34 | Stop 69.67 Not investment advice · Do your own research
post-image
SOL-0.77%
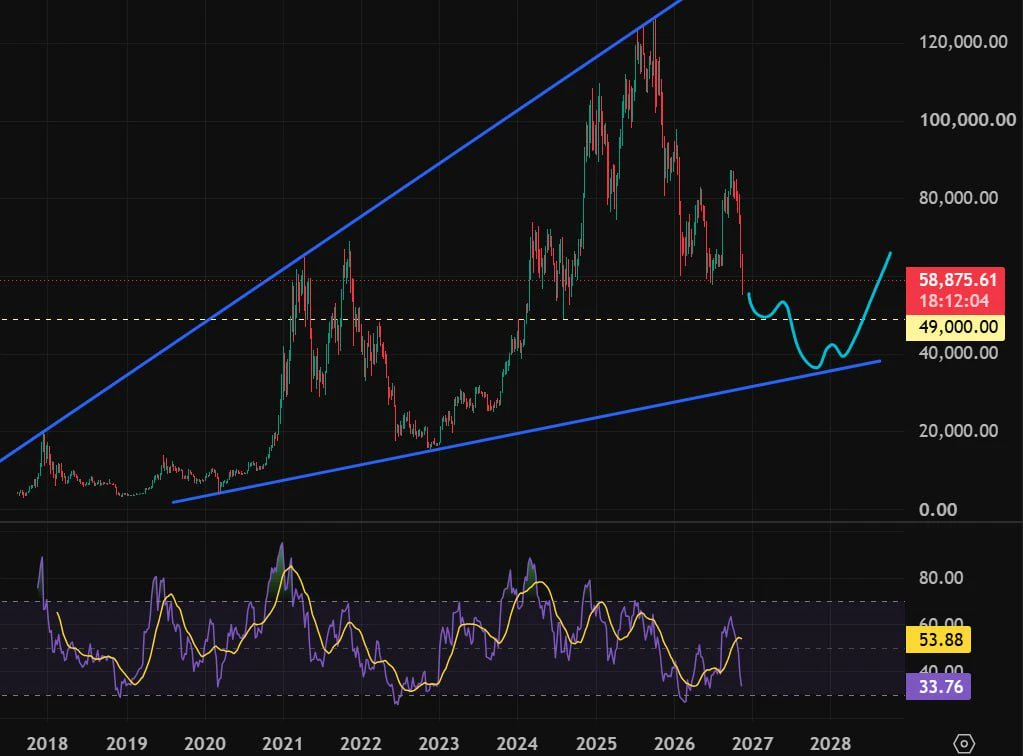
Damn, if $BTC really moves like this, how many people can take it?
I drew this chart during a review a while ago and am posting it today. Bitcoin's long-term ascending channel is still intact; the broader trend hasn't broken.
Looking at the chart, the market has been dropping through the 80ks, 70ks, and 60ks, leaving everyone who bought the dip underwater. If it drops further, these people definitely won't be able to hold on and will sell at a loss.
Once they've sold, there'll be no more overhead selling pressure, and the market can truly rise. A break below 49000 would actually be an opportu
post-image
BTC-0.67%
  • 1
Trenches
IDOL
I
bade
b
IDOL
0x3b...ab07
Market Cap
$.
Change
.
24h Vol
$.
Holders
.
JAGENT
J
bade
b
JAGENT
0x8e...ae15
Market Cap
$.
Change
.
24h Vol
$.
Holders
.
PIEVERSE
P
bade
b
PIEVERSE
0x0e...25a9
Market Cap
$
Change
.
24h Vol
$.
Holders
.
FIONA
F
bade
b
FIONA
B34n...pump
Market Cap
$.
Change
.
24h Vol
$.
Holders
.
mihao
m
bade
b
mihao
4Cxj...pump
Market Cap
$.
Change
.
24h Vol
$.
Holders
.
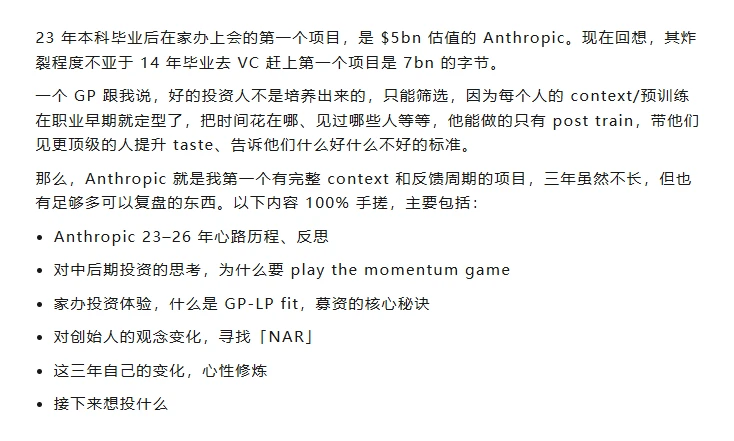
📌I just read an interesting three-year investment retrospective by an early Anthropic investor—
The author is a young investor who joined a family office investment team in 2023. They started researching Anthropic when it was valued at about $5 billion and witnessed firsthand the birth of a trillion-dollar company.
More than the investment returns, what interested me most was how the author’s understanding of investing changed over these three years, and what lessons we can incorporate into our own investment frameworks.
🔗Original:
1⃣What shifts in understanding did the author experience ove
post-image
ANT-8.68%
  • 1
This country bumpkin made it to the city
Waited an hour in line to park
Probably gonna take another hour just to get in
I’m losing it
post-image
URGENT BTC EMERGENCY: Fed Rate Hike Fear & ETF Outflows Spark Massive Dump!
live-cover
LIVE1,460
BTC-0.67%
BITCOIN NEWs Bitcoin falls below 57k
live-cover
LIVE1,118
BTC-0.67%
The 10% cap on first-day sales is bringing the “windfall of a lifetime” that many media outlets calculated back down to the realities of the balance sheet.

On November 19, Anthropic officially rang the Nasdaq opening bell under the ticker symbol ANT, pricing its shares at $83 and raising $81.3 billion. Combined with a concurrent $26 billion private placement, the offering set a record as the largest IPO in U.S. history.

Domestic tech media then identified at least 25 Chinese technical and management employees still working at the company who had benefited from this leap in wealth. The headli
post-image
ANT-8.68%
If you want to follow trades as usual, please follow genius trader Waini
From now on, I’ll just use this account to go all-in for fun
post-image
  • 3
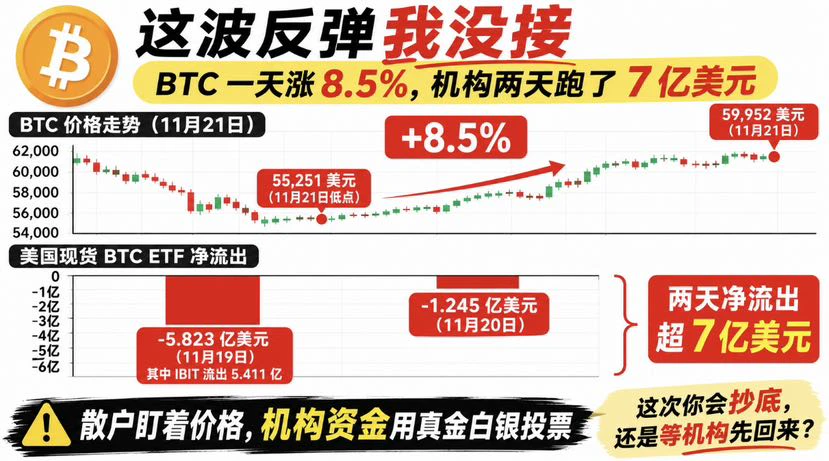
I didn’t catch this rebound. BTC rose 8.5% in a day, but ETFs saw net outflows of over $700 million over two days.

The price rebounded from $55,251 to $59,952—a solid move.

But the fund flows tell a different story:

* November 19: $582.3 million in net outflows, including $541.1 million out of IBIT.
* November 20: $124.5 million in net outflows.

Retail investors watch the price, while institutional investors vote with real money.

So what matters more to me now isn’t how much BTC rose in a day, but when ETF flows actually turn positive and whether it can hold above $60k.

I’d rather miss o
post-image
BTC-0.67%
  • 1
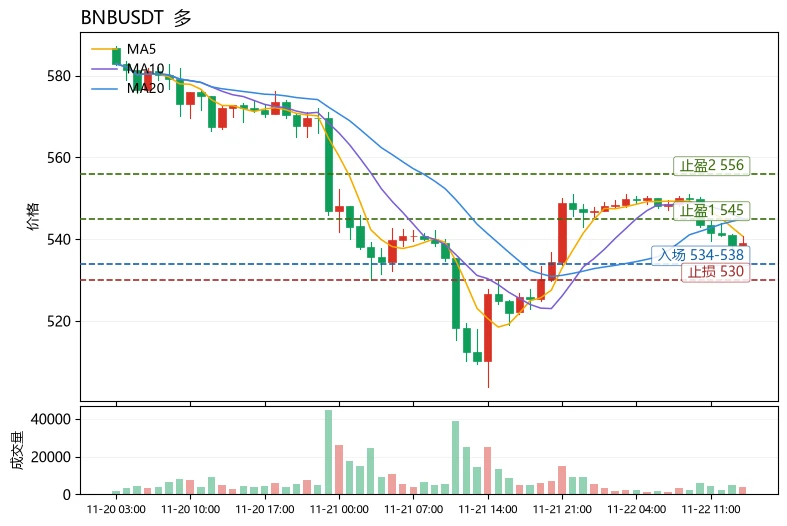
The most unusual detail in today's market is that $BNB rose 2.66% against the trend amid an extreme fear index reading of 11, while its funding rate hovered at 0.0000%—longs aren't willing to pay a premium, and shorts haven't gained an advantage either. This is a typical trading standoff, not a trend reversal. On the moving-average front, MA5=540.7 remains below MA20=545.0, the MACD histogram at -0.6163 remains bearish, and the RSI is just 42.9, indicating that the rebound is a recovery, not a reversal. However, the price is holding above the lower Bollinger Band at 533.8, and 24h trading vol
post-image
BNB-0.76%
ORCA-5.19%
ZEC+1.16%
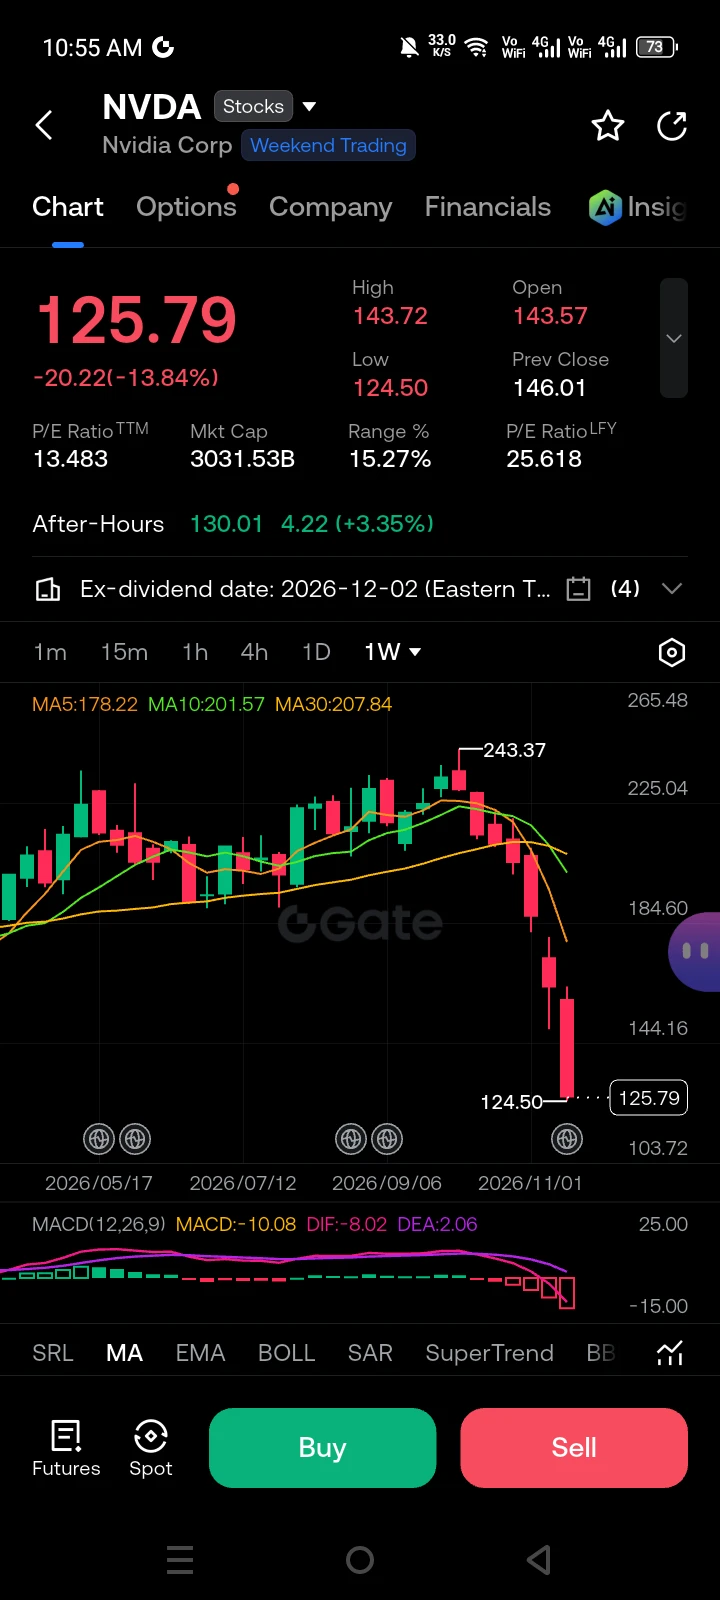
NVDA — THE SELL-OFF IS GETTING DEEPER. IS $125 THE BOTTOM?

NVIDIA has suffered a sharp breakdown, falling from its October high of $243.37 to $125.53, a decline of nearly 48% in roughly 10 weeks. The weekly structure remains bearish, with price trading well below every major moving average. Momentum is still weak, and there is no confirmed reversal signal yet.

The daily RSI is deeply oversold, which leaves room for a relief bounce, but oversold conditions alone are not a reason to buy. With volatility elevated and ATR around $12.83, traders should expect wider swings and avoid placing stops
post-image
NVDA-13.84%
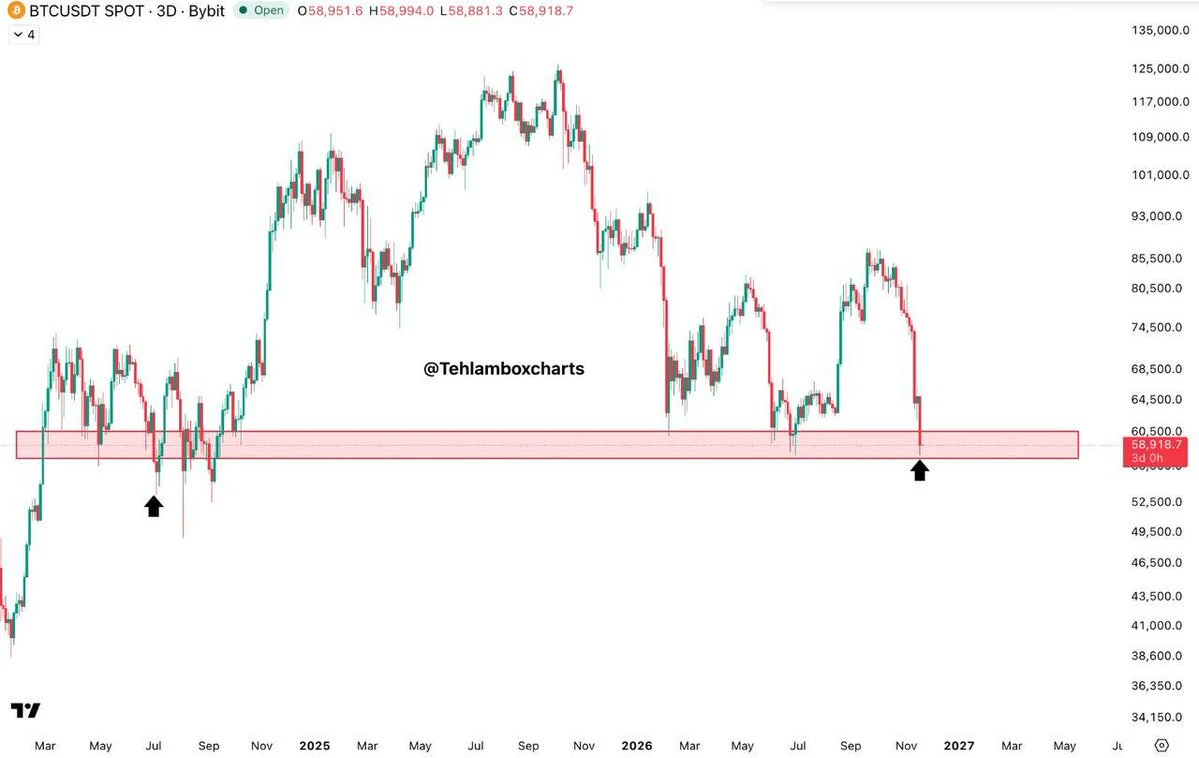
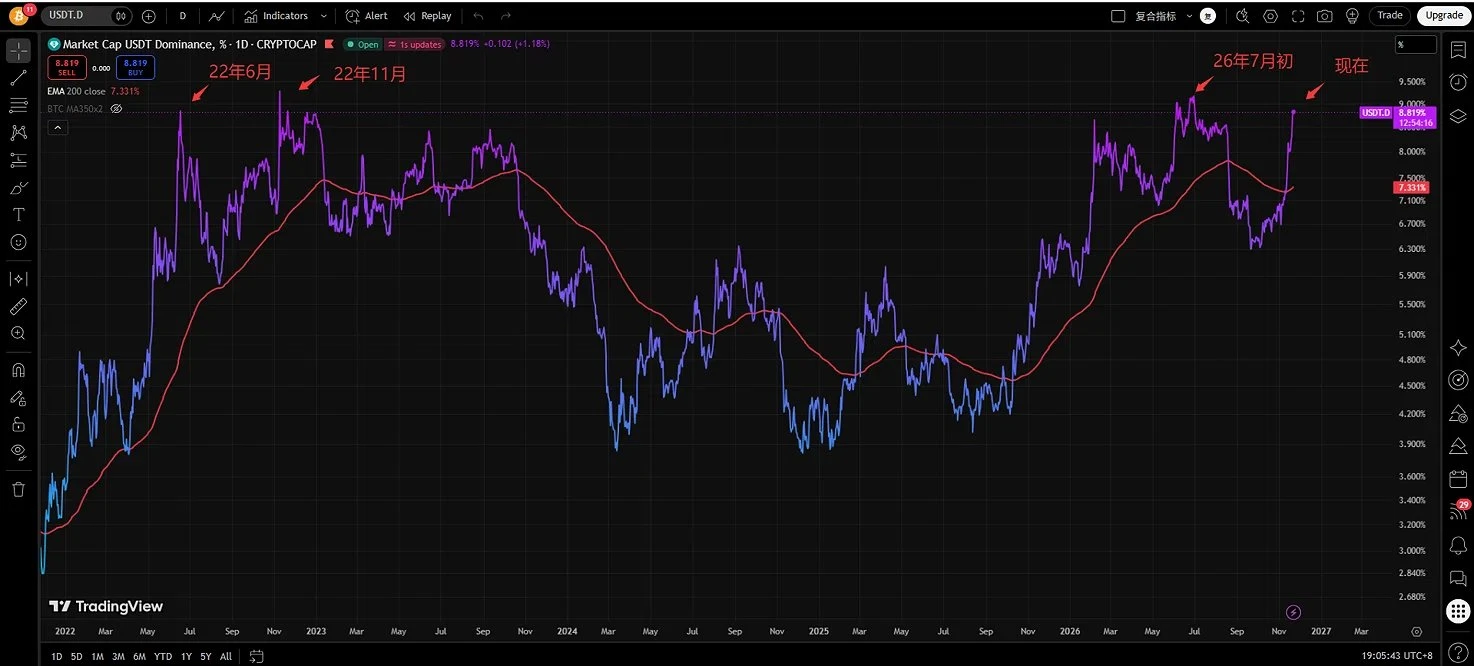
USDTD has already reached the top; the current situation resembles the double bottom of the 2022 bear market! $BTC
post-image
BTC-0.67%
  • 1
  • 2
$PI ‌

#weeklyshare
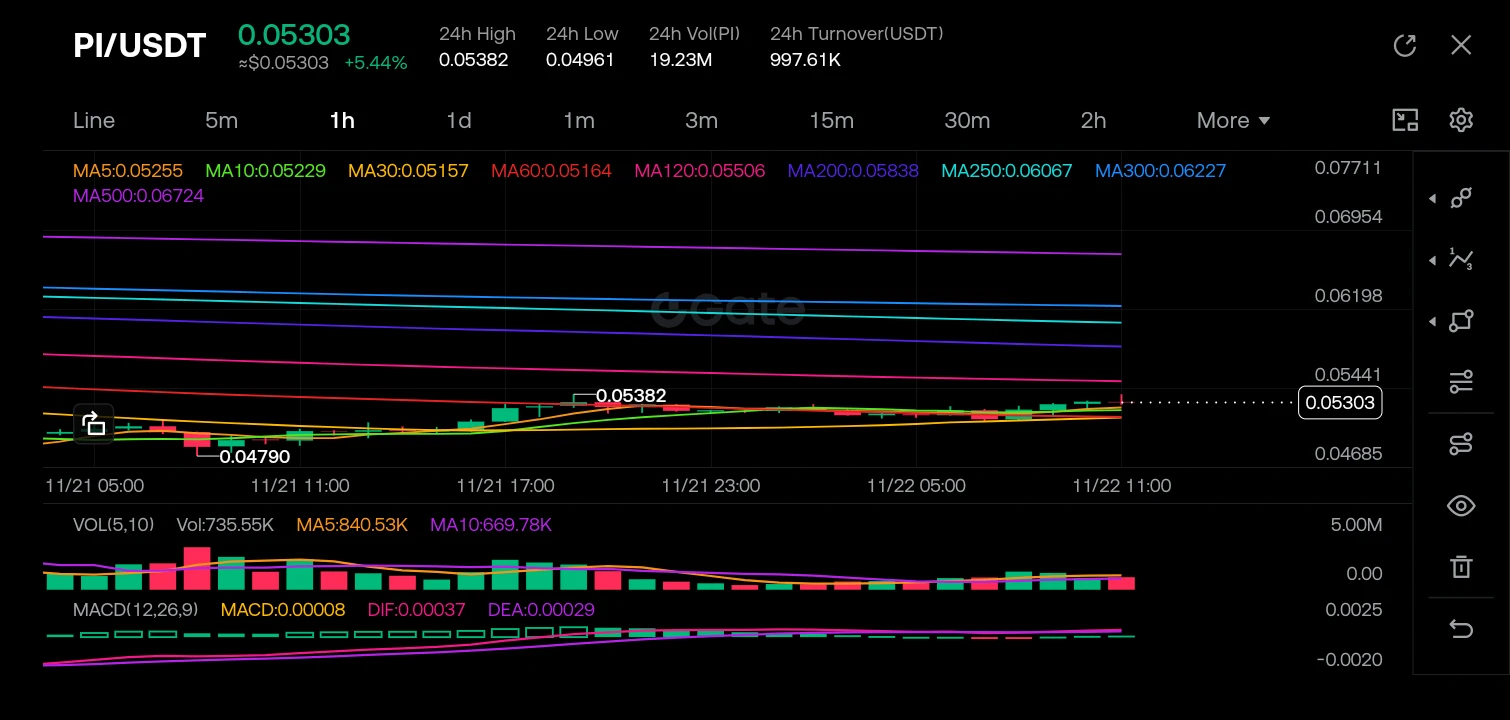
The Squeeze Before the Surge: Navigating the PI/USDT Liquidity Matrix

The PI/USDT market is currently exhibiting a classic consolidation pattern, coiling tightly after a period of volatility. While the price sits at 0.05303, reflecting a modest +5.44% gain over the last 24 hours, the true story lies in the compression of the moving averages and the shrinking volume. This is a market waiting for a catalyst—a state where whale accumulation and retail exhaustion meet at a critical mathematical pivot point. In this analysis, we will decode the structural mapping of this char
post-image
PI-0.60%
  • 1
  • 2
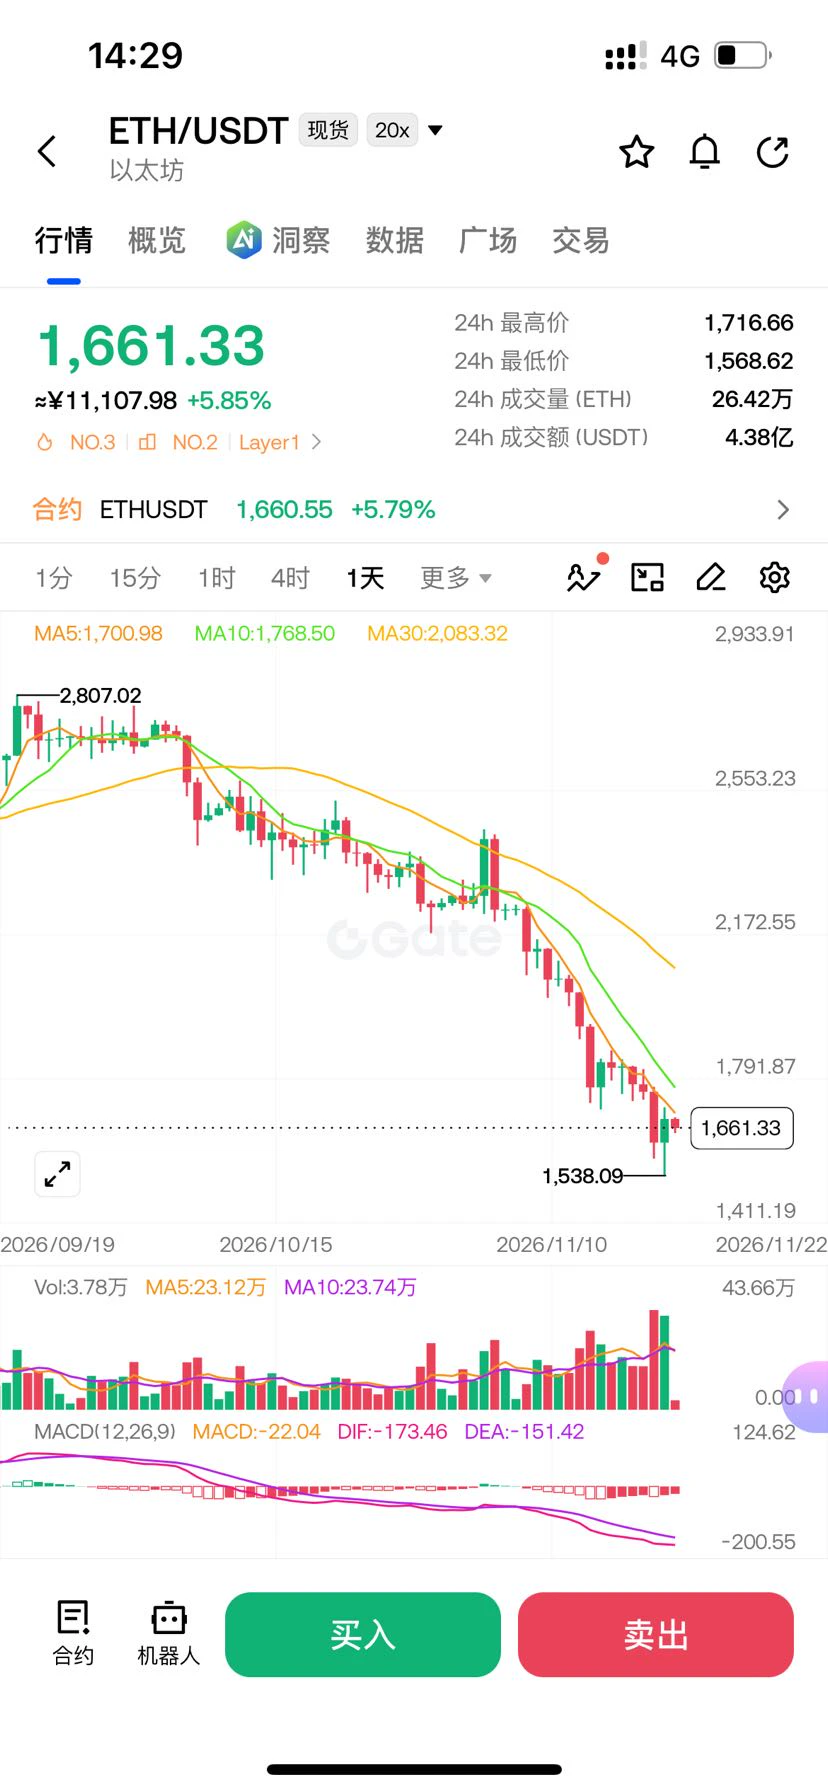
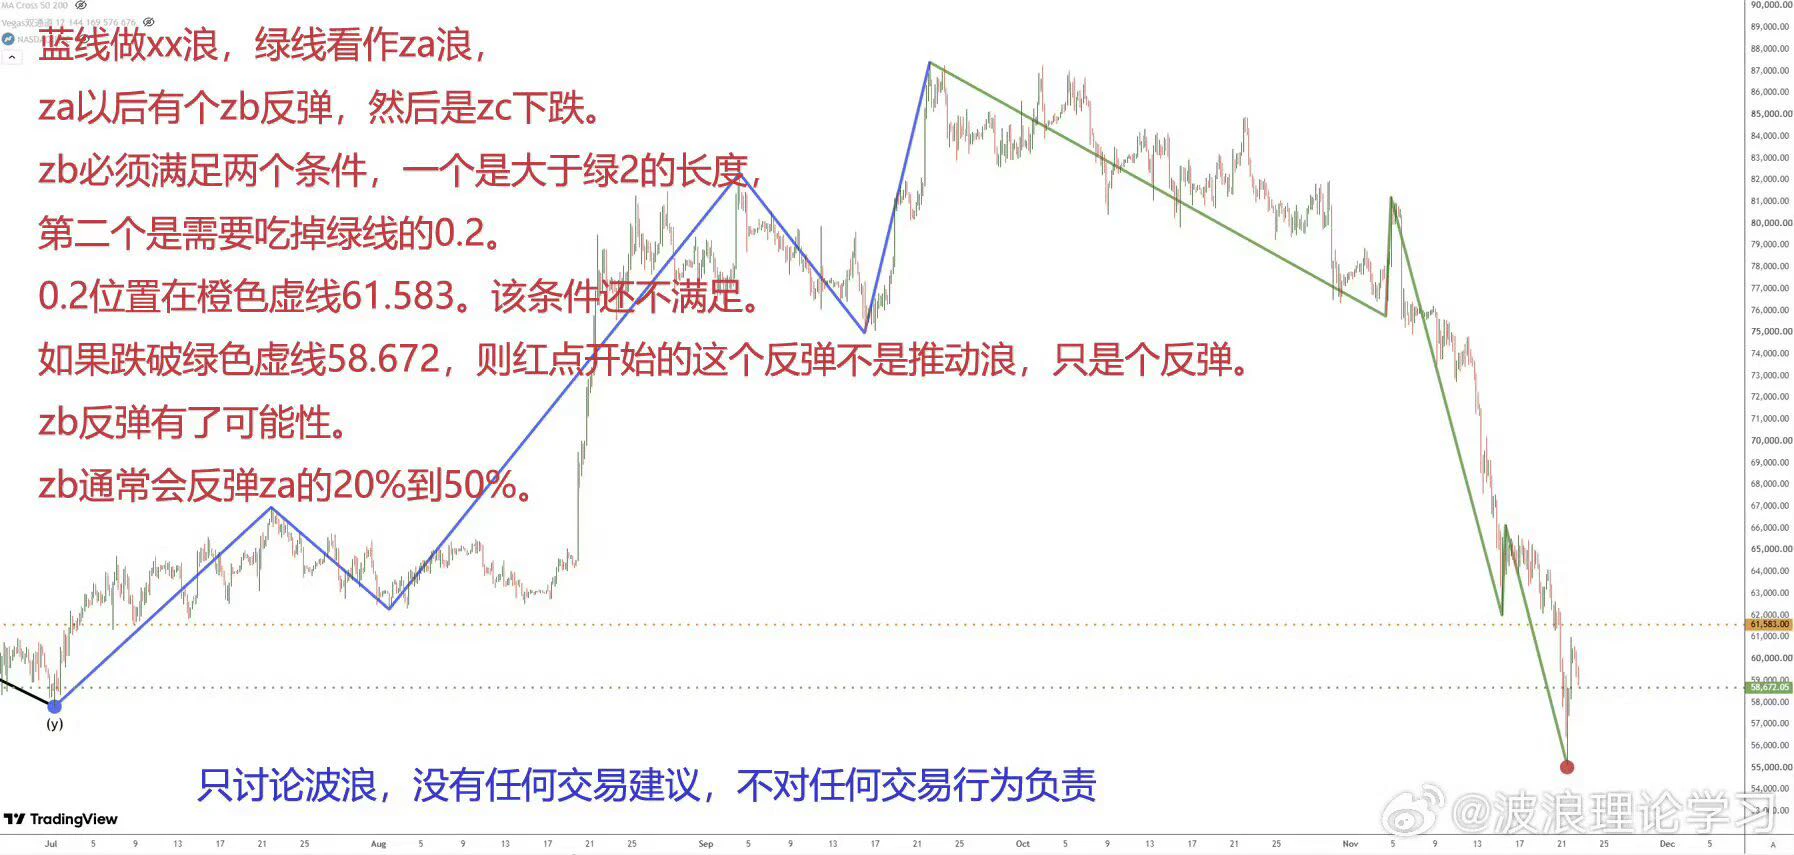
Bitcoin/Ethereum: The shorts on rallies and additional shorts that have been repeatedly flagged since last night still had room to fall, as noted again this morning. They have now reached lows of around 58,700 and 1,647, respectively, with decent overall moves. In fact, the longs entered after yesterday morning's pullback to 55,600 and 1,545 also saw a significant rally. The subsequent short entries were not ideal, but still offered decent room. #BTC反弹后再争6万美元关口
BTC-0.65%
ETH-1.23%
  • 4
UID:47778090
post-image
SummitCapitalMvp
Summit Capital MVP|Dip-Buying Fund
10*200USDT
Leave your UID in the comments section

repost-content-media
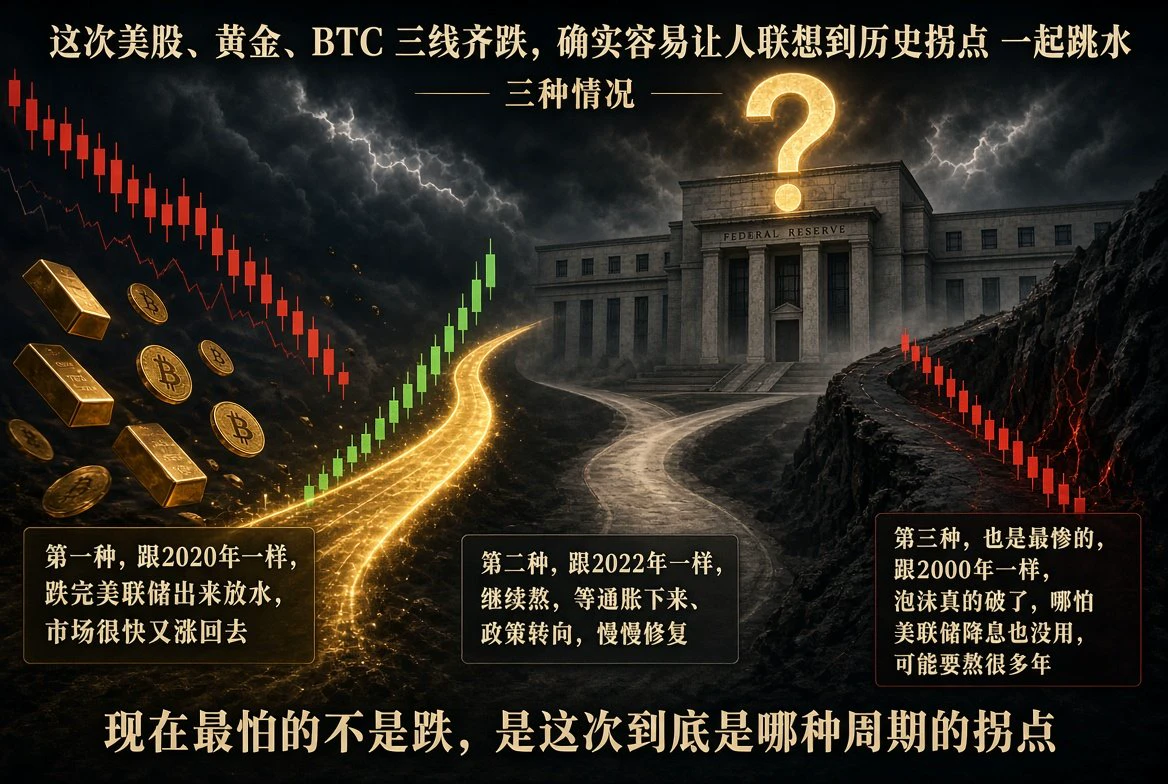
This time, U.S. stocks, gold, and BTC all fell in tandem, making it easy to think of historical turning points
The first scenario: 2020. After the drop, the Fed turned on the liquidity taps, and the market quickly climbed back up
The second scenario: 2022. Keep holding out, wait for inflation to come down and policy to pivot, then recover gradually
The third, and worst, scenario: 2000. The bubble really burst, and even Fed rate cuts did no good; it could take many years to get through
What’s most worrying now isn’t the drop, but which kind of cycle turning point this is
post-image
GLDX-0.40%
PAXG+0.37%
BTC-0.67%
Slowly loading $BTC here, If it goes lower, I'll have more to buy
Rn we are at make or break gonna, bullish breakout 🔜
post-image
BTC-0.67%
$ETH That guy who collateralized 180k ETH to borrow 214 million U—the one whose liquidation price I checked at noon, 1401—is still sitting right where he was.

Today I spotted another whale transferring 65 million U to an exchange, clearly ready to buy. Put the two side by side and it’s absurd: one has the market at his throat, watching how far ETH is from 1190; the other is sitting on bullets, waiting for a lower price. Same chart, two fates.

ETH bounced more than 6% today, closing at 1663, but looking back, it was still above 2300 a month ago. This rally feels like no rally at all—just anot
post-image
ETH-1.26%
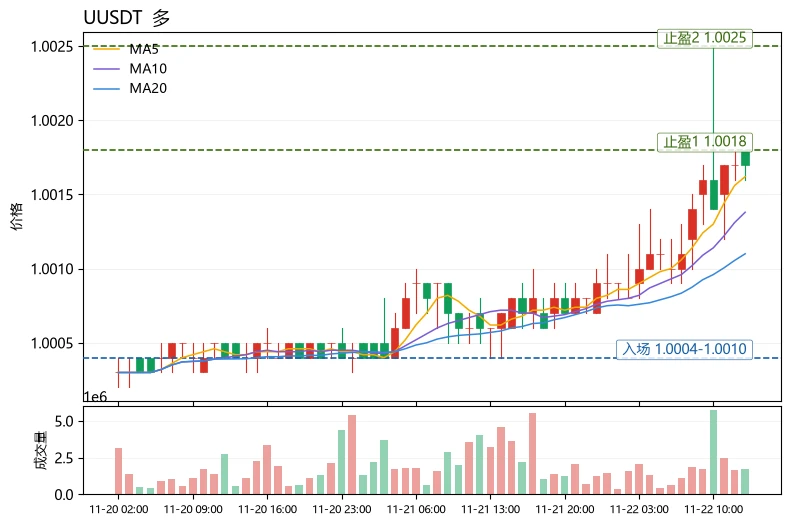
The most unusual detail in today's market is that the Fear & Greed Index is only 11 and the market is in extreme fear, while $U has formed a narrow-range bullish structure with MA5>MA20 and a positive MACD histogram within a range of only about 0.21% over 30 candles. This shows it is currently a low-volatility anchor asset, not a sentiment-driven directional trading asset; treating it as a trend trade offers very poor risk-reward.
Using moving averages to judge whether a trend is healthy, this is a perfect counterexample: MA5=1.00162 is only slightly above MA20=1.0011, with the two lines near
post-image
LINK-0.18%
TRUMP-0.95%
Load More

Join 40 M users in our growing community

⚡️ Join 40 M users in the crypto craze discussion

💬 Engage with your favorite top creators

👍 See what interests you

Trending Topics

BTCReboundFaces60KTest

2.1M Views30.1K Discussing

BTC rebounded from around $55,300 on November 21, briefly reclaiming $60,000 before pulling back to around $59,300. The $60K level is back in focus as traders assess whether the recovery can last. Is this rebound a sign of stabilization or a short-lived recovery? Would reclaiming and holding $60K be enough, or do you need confirmation from trading volume and fund flows?

PCEAndGDPDataNextWeek

258.5K Views2.6K Discussing

GateDirectIPOPhase3ANTAllocates92100Shares

820.4K Views5K Discussing

View More