Share your thoughts
placeholder
Article
#AltcoinOISurpassesBitcoinforFirstTimeinOveraYear
The crypto market is entering a very different phase, and the latest derivatives data may be one of the clearest signals yet that risk appetite is moving beyond Bitcoin.
$BTC
For the first time since December 2024, aggregate open interest in altcoin perpetual futures has moved above Bitcoin, according to Coinalyze data. Bitcoin still remains the largest individual derivatives market, with perpetual open interest around $23.9 billion, but the combined positioning across ETH, SOL, XRP, BNB, ZEC and other altcoins has now become larger than B
post-image
BTC-0.71%
GT-2.17%
ACP+8.25%
AMDON+1.47%
  • 1
This profit has me feeling deeply uneasy and fearful, worried that the market will realize what happened tomorrow and blacklist me.
When I opened the charts this morning, it was still grinding. The key was that the bottom hadn’t broken, while volume was quietly picking up—the signs of funds entering the market were simply too obvious. With a signal like that right in front of me, failing to act would have let myself down after all those late nights. So I entered directly at 833.19, set my stop-loss, closed the software, and got back to work.
By the time I returned to my computer, the price had
post-image
ADA-0.05%
SNDK-0.27%
BREAKING: Ondo will discontinue USDY minting on Aptos and Noble on Sept. 8, also affecting bridged USDY on Osmosis and Mantra.
Holders will have options to migrate or exit their positions.
ONDO+2.35%
USDY0.00%
APT+0.63%
OSMO+0.67%
MANTRA+2.59%
Nobody is talking about this DOGE setup while the 1h RSI quietly stalls.

$DOGE /USDT - SHORT

Trade Plan:
Entry: 0.08931 – 0.08979
SL: 0.09186
TP1: 0.08782
TP2: 0.08666
TP3: 0.08493

Why this setup?
Why now? The daily trend is range, which means we are in a compression zone where a sharp move is overdue. The 1h RSI sits at 48.1, showing just enough bearish momentum without being overbought, so the short bias has room to breathe. The 1h ATR of 0.000963 tells us the current volatility is tight, making the entry zone between 0.08931 and 0.08979 a precise trap for longs. We target TP1 at 0.087
DOGE-0.31%
The following sixteen-character principle will guide the rest of my life:
“Make money while having fun
Make money to have fun
Combine making money with having fun
Put having fun first”
It’s not that happy people have fun; rather, those who have fun are happy
Starting Monday, let’s have some fun🌊
live trading and btc
live-cover
LIVE1,423
happy monday y'all
who's actually locked in for this week?
post-image
Deluxe three-item combo: pig’s feet, duck leg, and pork ribs, 6u
post-image
Main funds have been fleeing for days! $CATI Is this surge a “short-squeeze trap” or “pump and dump”?
Trading suggestion: Lightly test a short position near 0.065, with a target of 0.058.
Although the CATI 1-hour chart has moved above the moving averages, the capital flow chart is crystal clear—net outflows for 8 consecutive hours. While there has been a slight inflow over the short term, the long-term trend remains an outflow. The liquidation chart is even more direct: short liquidation intensity is only 15,000, while long liquidation intensity is as high as 1 million—meaning the main player
post-image
CATI+20.51%
I didn’t analyze anything—I just opened the chart and glanced at it twice, and $RE started moving up all on its own. When I checked the chart right after lunch, there was still no movement. I took another look just now, and wow, it’s got me feeling a little overwhelmed by the favor.

I noticed it while it was bottoming out intraday. After the price came down, it stopped falling and moved sideways, with volume shrinking to an extreme—that was a signal it couldn’t drop any further. It happened to retest and hold, and buying pressure started picking up. I tested a position around 0.40266, purely
post-image
RE-1.09%
DOGE-0.31%
XRP-1.42%
GM Legends.
Starting the week with fresh energy
Time to put in the work even if nobody is watching. Your discipline and consistency will bring the desired result
As always, still putting in the work with $RIVER .
Wishing everyone a productive week ahead.
post-image
RIVER-4.20%
In the short term, the #SNDK/USDT token is maintaining its upward structure, trading just ~10% below its all-time high. The key support levels are $1,750 and $1,455 (the weekly low), while resistance is represented by the psychological level of $1,800 and the ATH zone at $1,972.
Key Entry Levels
Pullback Level (Long / Buy): $1,750 – $1,756
Setup: Buy on a correction to the local support of the daily range.
Stop-loss: Below $1,735 (loss of ~1%).
Take-profit: $1,800 and $1,850.
Breakout Level (Breakout Long): $1,800
Setup: Enter on momentum after the hourly candle closes above $1,800.
Stop-los
SNDK+11.88%
JUST IN: BonkGuy reveals unrealized FOMO losses of about $3.6M over the last 24 hours, saying he’s unfazed and that the current setup could double in value over months, potentially hitting $50M without new buys. $BONK ? (context dependent)
post-image
BONK-5.35%
Afternoon Market Updates
live-cover
LIVE2,470
Why is everyone ignoring the short setup forming right now?

$XAUT /USDT - SHORT

Trade Plan:
Entry: 4390.7 – 4395.7
SL: 4417.5
TP1: 4375.0
TP2: 4362.9
TP3: 4344.7

Why this setup?
Why now? The 1h price is 4393.2, which is the exact entry_ref and the upper boundary of the entry zone, meaning the market is already testing the trigger level for a short. The daily trend is range, so there is no strong directional bias to fight, giving the short a clean backdrop. The 15m RSI is 45.23, which sits below neutral and signals bearish momentum is still active. The 1h ATR is 10.111934, so a move from
XAUT-0.75%
The key change today is: ETH has regained short-term strength, but the macro environment remains bearish. Strong U.S. nonfarm payrolls have raised expectations for a September rate hike, while oil prices are nearing $97 and inflation risks are rising; U.S. CPI is also due this week, so market volatility could increase significantly.
My core judgment now
Short term: Range-bound with a bullish bias, but $2,520–2,560 is the zone that will determine the direction.
I currently do not recommend chasing longs directly at $2,510–2,520.
Key levels:
* $2,560: The true breakout level for bulls
* $2,520:
ETH-0.35%
This isn’t a rebound; it’s a tube inserted into an account that was about to flatline. While everyone was still watching from the sidelines, I kept an eye on the fund flows and spotted unusual activity in $SONIC . After moving sideways at the bottom for so long, the sell-side pressure was nearly exhausted. My assessment at the time was that funds were quietly entering, so I suggested going long at 0.01888.
This grind wasn’t in vain. It’s now at 0.02422, with unrealized gains reaching +694.08%. The whales have provided the answer, and the timing was on point. But don’t get carried away—disciplin
post-image
SONIC+6.17%
LAB-3.06%
ADA-0.05%
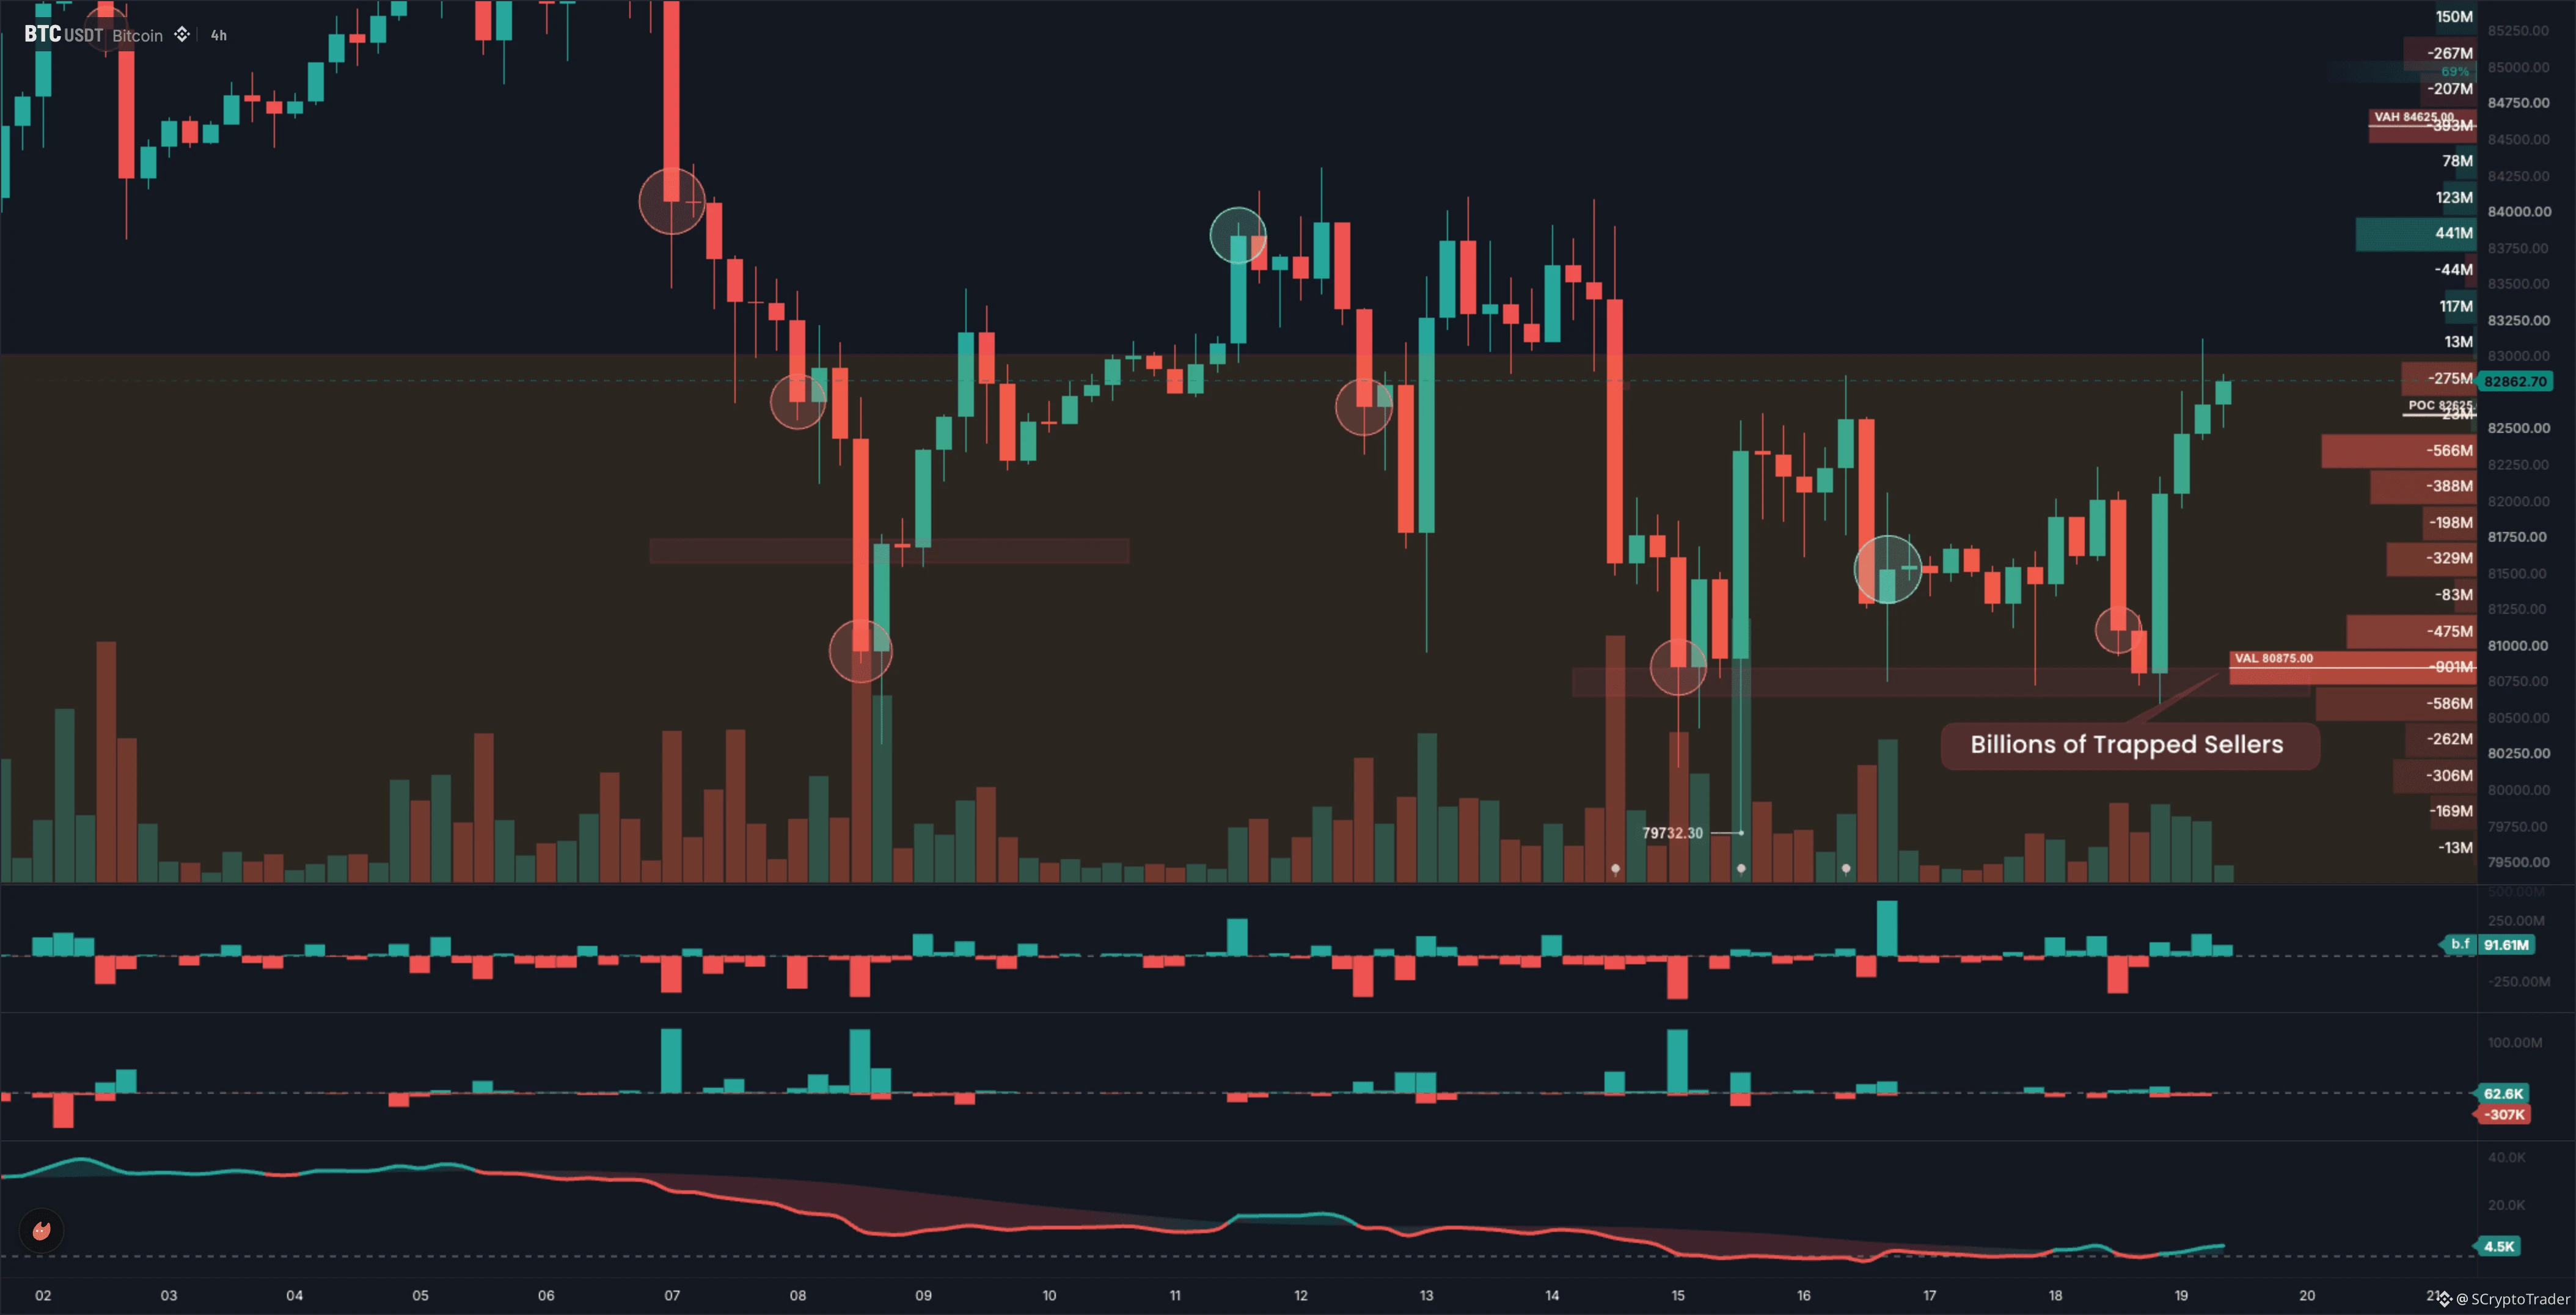
Holding the 79k level means there’s still a chance this week
The question I got most in DMs over the weekend was: Is a major pullback coming? My answer is straightforward—there’s no such signal right now. The structure is bullish across all timeframes; I see no reversal and no top signal. This bullish move hasn’t even shown signs of exhaustion, so there’s no basis for shorting here. This weekend’s consolidation has produced rising support levels, with each low higher than the last. In the short term, keep an eye on 79k. If it holds, continue looking higher this week, with the next level around
post-image
BTC-0.72%
ETH-0.35%
Insiders are fading the range on $SNDK /USDT and the 1h setup is too clean to ignore.

$SNDK /USDT - SHORT

Trade Plan:
Entry: 1784.2 – 1788.8
SL: 1808.6
TP1: 1769.9
TP2: 1758.9
TP3: 1742.3

Why this setup?
Why now? The 1h price sits at 1786.5 inside a tight range that has been capping rallies all day. The 15m RSI reading of 55.12 shows just enough bullish exhaustion to favor a move lower from this entry zone. With the 1h ATR at 9.207882, the measured move targets TP1 at 1769.9 and TP2 at 1758.9, giving clear risk-defined levels. The daily trend is range-bound, which means the invalidation
SNDK-0.27%
  • 1
📅 Gate Square’s US Stock Watch | Sep 7–11
Scouted for you:
$AAPL event + supply chain
$ORCL earnings & AI demand
③ August CPI & rates
Also watching: $$SNDK $$MU $$GME $$ADBE
Square residents, what matters most? The mic is yours 👇
👉 https://www.gate.com/post
#USStocks #Gate
post-image
AAPL-2.51%
ORCL+3.07%
SNDK+11.88%
MU+5.89%
GME-0.28%
  • 2
Load More

Join 40 M users in our growing community

⚡️ Join 40 M users in the crypto craze discussion

💬 Engage with your favorite top creators

👍 See what interests you

View More