Square
Following
Hot
News
Profile

judea_aljubran

vip
Quant Trader
Alpha Miner
In the name of God, I rely on God, and there is no power, strength, honor, or wealth except through You, O God.
119
Following
8
Followers
195
Liked
#GateMemeCarnival How will the meme coin perform over the coming days? Will it catch up and soar into the skies of trading, or will it sink to the depths of the oceans?
I hope we see amazing things over the coming days and weeks.
This is the strongest blow I’ve seen today.
Will Bitcoin and Ethereum be able to deliver powerful, devastating blows to the market, driving other currencies to rise again and reach new highs that everyone competes for?
majedalazmiBTC
The stop-loss got hit—what a frustrating blow 😕💔
‘
I told you on interest day to remove the stop because it was at the uptrend
My stop-loss wasn’t triggered; I’m surprised because it went against the OCO conditions 🤣
Those who are still in it, keep going 👍🏻
Altcoins are just starting to heat up, and we have some crazy trading ahead of us
repost-content-media
It is recklessness in meme language—how long will we keep chasing hedging? Let’s be a little reckless
and gain a lot, and see the effects of our recklessness in the coming days
filled with surprises and good news
CryptoCircleSuperShortFat
[Ended] meme
09-16 05:24720 views
Let's play with infinite madness. How long will we keep warning and watching the market? Let’s make the market be the one watching us and afraid of our madness hahaha.
CryptoChampion
Sign Up & Trade to Split 60,000 USDT in Rewards https://www.gate.com/campaigns/6207events?ref=VLARBF1YAG&ref_type=132
repost-content-media
  • 2
It's not a mockery; the party has begun, so let's enjoy it together hahaha.
CryptoMaxx
The farce has begun 🔥🔥🔥
Trade cautiously $BTC
The CLARITY Act is watching closely
  • 2
Will Bitcoin break through, or will it fail? Let’s predict the expected results together!!!
Sakura_3434
##FedAnnounceRateDecisionSoon
FOMC WEEK IS HERE: BTC, ETH, GOLD AND US STOCKS ARE ENTERING A HIGH-VOLATILITY TEST
This is not a normal trading week.
From Bitcoin and Ethereum to gold and US equities, almost every major asset is now waiting for one central catalyst: the Federal Reserve’s September 15–16 FOMC meeting.
The rate decision arrives at 2:00 pm US Eastern on September 16, which is 11:00 pm Pakistan time. Thirty minutes later, at 11:30 pm Pakistan time, Fed Chair Kevin Warsh will hold the press conference.
And this distinction matters: 11:30 pm is the Fed press conference, not a CPI event. August CPI was already released on September 11.
August headline CPI came in at 3.4% year over year and 0.4% month over month, while core CPI was 2.4% year over year and 0.3% month over month versus a 0.2% consensus. August PPI was also strong at 0.4% month over month and 5.4% year over year.
That is why I believe the market will focus less on the headline rate decision and much more on the updated dot plot and Warsh’s language.
WHERE THE MARKET STANDS
The Fed funds target range is currently 3.50%–3.75%. Market pricing has moved aggressively toward a 25-basis-point hike, with CME FedWatch around 87%–90% probability, while Polymarket gives only around an 18% chance of no change.
But there is an interesting disconnect.
A Reuters economist survey still shows roughly 70% expecting a hold.
That difference between market pricing and economist expectations creates the possibility of an unusually sharp reaction if the Fed delivers something different from what traders have already positioned for.
Several factors have pushed expectations toward tighter policy: sticky inflation, stronger producer prices, payrolls around 162,000, Brent near $106, WTI above $100 and the 10-year Treasury yield close to 5%.
BTC is currently around $75,920 after falling below $77,000. Its September high was approximately $82,253, while the August low was near $69,300. Compared with its January 1 opening around $87,497, Bitcoin remains roughly 10%–11% lower for the year.
ETH is around $2,500. It has gained strongly over the past month but has failed twice around $2,600.
Gold recently dropped below $4,300, reaching around $4,279, while US equities also came under pressure. The S&P 500 closed near 7,597, the Nasdaq lost around 1.1%, and the Dow declined 0.48%.
LIQUIDITY TELLS A DIFFERENT STORY
Despite Bitcoin’s weakness, institutional demand has not disappeared.
US spot Bitcoin ETFs attracted approximately $770 million during the first four September sessions and around $3.8 billion over three weeks. August alone brought approximately $3.52 billion of inflows.
Yet year-to-date ETF flows remain negative by roughly $1.07 billion.
That tells me the market is experiencing a complicated battle between institutional accumulation and macroeconomic pressure.
Ethereum ETF momentum also cooled, with around $24 million of outflows after an $824 million weekly inflow.
Funding is another important signal. Perpetual funding is around +0.0031% every four hours, below the 30-day average of +0.0055%. In my view, leverage is elevated enough to create volatility but not yet at an extreme level.
When PPI surprised the market on September 10, Bitcoin lost roughly $1,200 and more than $190 million of longs were liquidated within one hour.
ETH has an even bigger risk area, with more than $1 billion of long leverage positioned below $2,400.
THE THREE FED SCENARIOS
My first scenario is a 25-basis-point hike combined with hawkish guidance.
If the Fed signals additional tightening, real yields and the dollar could rise. Bitcoin could revisit $73,000–$75,500, with a deeper move toward $70,000–$72,000 possible. ETH could fall toward $2,250–$2,400, while gold could move toward $4,150–$4,230.
US stocks would also face pressure.
My second scenario is the one I currently consider most likely: a hike followed by a data-dependent, one-and-done message.
If the hike is already priced in, the market could initially flush lower before reversing. Bitcoin could recover toward $79,500–$82,000, ETH could reclaim $2,600 and potentially test $2,750–$2,800, while gold could recover toward $4,380–$4,480.
The third scenario is no hike.
This would be the biggest surprise and could trigger a strong risk-on reaction. Bitcoin could target $82,000–$85,000, ETH $2,700–$2,900 and gold could move above $4,500.
MY 7-DAY MARKET ROADMAP
September 15: Keep position sizes smaller ahead of the Fed and avoid unnecessary leverage. The CLARITY Act vote is another event worth watching, but for me, the Fed remains the dominant macro catalyst.
September 16: This is the highest-risk day. From 11:00 pm to roughly 1:00 am Pakistan time, I would treat the market as a blackout zone. Spreads can widen, candles can reverse violently, and market orders can become extremely dangerous.
September 17: This is the digestion day. Housing data, the Philadelphia Fed index and the Bank of Japan decision could add another layer of volatility. I want to see the 4-hour structure before trusting a new direction.
September 18: Quarterly options expiry brings another potential volatility spike. Large wicks and sudden reversals should not be surprising.
September 19–20: Weekend liquidity becomes thinner. Breakouts need confirmation because large BTC wicks can appear quickly.
September 21: Institutional participation returns. ETF flows and the levels established during the previous sessions become more important.
KEY LEVELS I AM WATCHING
BTC:
Bearish below $78,100.
Supports: $76,500, $75,000 and $73,700.
Bullish above $79,500.
Targets: $81,250 and $82,300.
ETH:
$2,400 is the key line.
Above it: $2,600 and $2,750.
Below it: $2,300 and potentially $2,000.
Gold:
Important zone: $4,270–$4,325.
Below $4,230 would weaken the setup.
Upside targets: $4,450–$4,500.
A breakdown could expose $4,100.
S&P 500:
Support around 7,565–7,527.
Nasdaq:
25,650 is an important level.
Dow:
50,000 remains major support.
MY PERSONAL APPROACH
I believe the rate decision itself may be less important than the message surrounding it.
If the market receives the expected hike but the Fed signals patience afterward, the initial panic could become a relief rally.
That is why I currently prefer spot exposure and gradual accumulation rather than aggressive leverage.
My seven-day base-case ranges are:
BTC: $75,500–$82,000
ETH: $2,300–$2,750
Gold: $4,240–$4,480
S&P 500: 7,520–7,720
But if the dot plot becomes significantly more hawkish, I would immediately become more defensive.
For me, this week is not about predicting every candle.
It is about protecting capital, waiting for confirmation and allowing the market to reveal its direction.
Cash is also a position.
Sometimes the strongest trade is simply waiting for the noise to disappear.
#FOMCMeetingAnalysis #Gate广场中秋团圆局 #weeklyshare @Gate_Square #GateMemeCarnival
  • 2
BTC[2W]
4 attempts to break through the 2017 peak
4 successful tests as support 🔵
One breakout of the 2025 downtrend
Despite M1 expansion, BTC continues to consolidate strongly.
And this is exactly what it was designed to do.
Decentralized hedging succeeds > more (institutional) demand > 🧨
Will the breakout succeed this time?
BTC-0.40%
  • 2
Ethereum will surprise us.
CryptosBatman
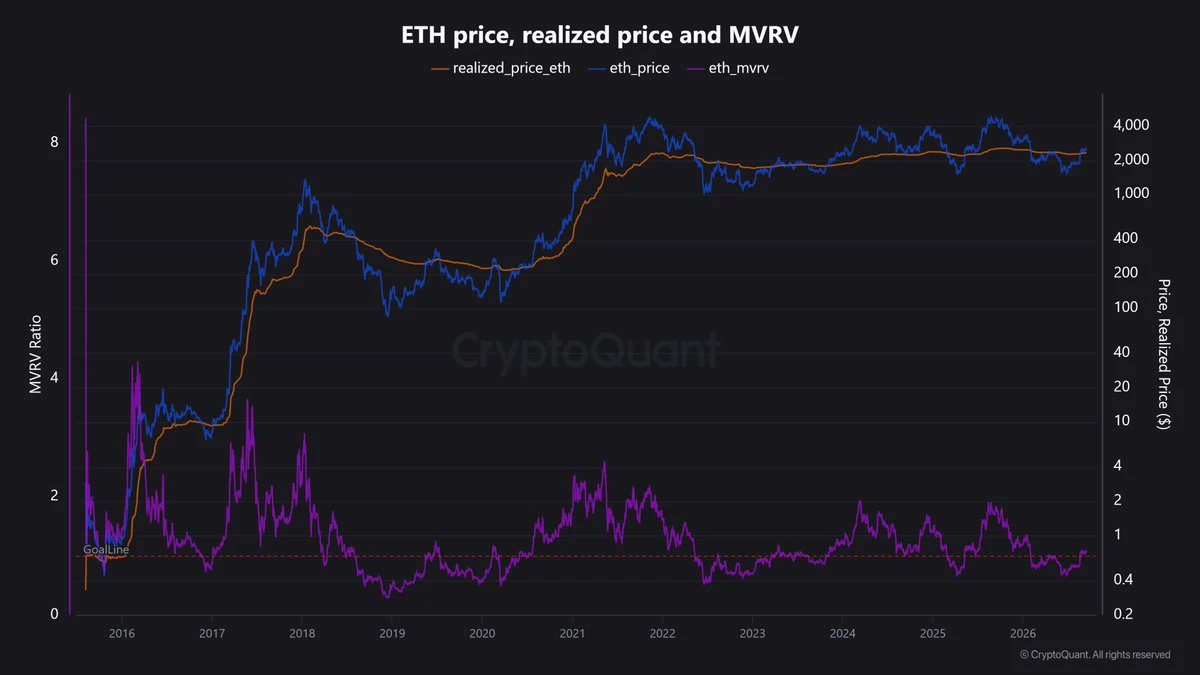
$ETH MVRV is sitting right around the 1.0 break-even line, a zone that has historically mattered near major bottoms.
Not saying the bottom is confirmed, but this is starting to look more like a long-term accumulation zone.
repost-content-media
Keep moving forward
UYueComes,YueIsGood
Range-bound during the day, keep farming, with news flow late at night and in the early morning.
Market movement is like the ocean
SmartMoneyRealTradingStrategy
This weekend’s market action is nothing but market makers drawing candles—you’re hanging in there, but in reality, no one is playing with you.
Duling Fengsao calls this a loom: extreme volume contraction. I checked the figures—BTC’s trading volume for all of Saturday was just over 600 million, more than half less than in the previous few days.
His most important point this year is that money is changing places: Web3 money is flowing into US stocks, and tokenized US stocks have leveled the entry barrier. BTC faces resistance at 78425, with support at 75475.
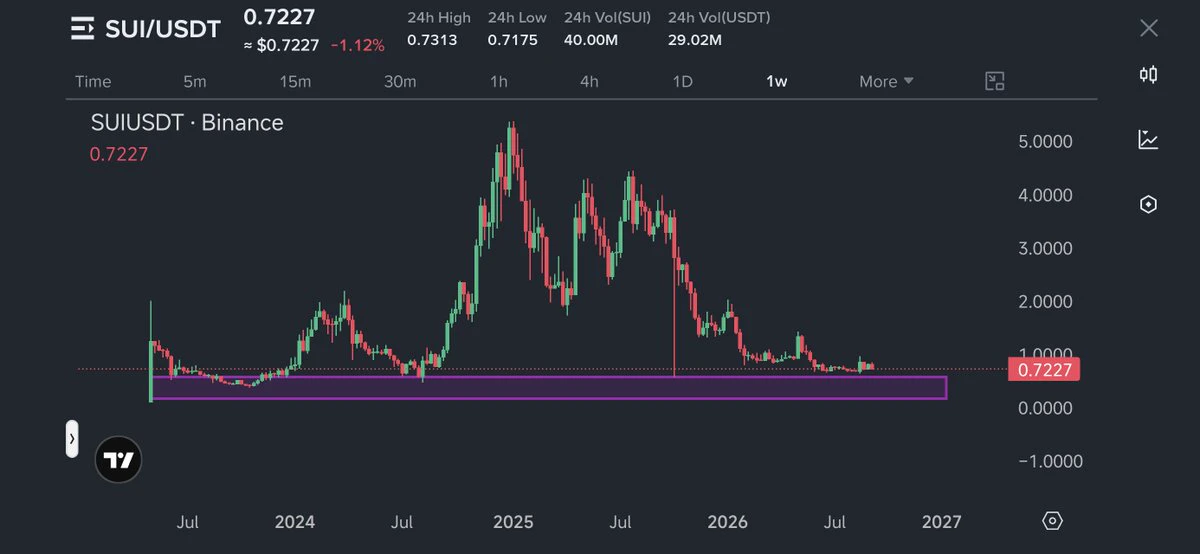
I’m not panicking along with them. His long positions below 76700 are still being held, and SUI is also being kept until next week—as volume contraction eventually has to choose a direction, we’ll just wait for it to choose instead of guessing first.
In this kind of low-volume market, are you more afraid that nothing will happen, or that a sudden large bearish candle will appear?
repost-content-media
$AAPL The new Apple phone has advanced features, and I expect Apple’s profits to reach unprecedented figures.
AAPL+1.52%
The new Apple phone has advanced features, and I expect Apple’s profits to grow to unprecedented levels. Let’s see what lies behind this remarkable phone.
$AAPL
Apple's new phone has advanced features, and I expect Apple's profits to grow to unprecedented levels.
AAPL+1.52%
$SPCX
I expect an unprecedented rise for this rocket stock owned by Elon Musk. What comes after SpaceX?
SPCX+0.42%
What comes next for Bitcoin after this correction? Will we see surprises in the coming days or during inactive hours?
Let's get to work.
CryptoPm
CT is in full LARP mode on sui:native , but the price isn’t going anywhere because there’s still no real MM-driven momentum behind the move.
Also, the 10/10 wick remains unfilled, so we could still see that level get tested sooner or later.
Until then, don’t FOMO into the move.
Let the price confirm the setup first. 👀
repost-content-media
$MU
I expect it to rise in the coming days, so let’s see what surprises it will bring.
MU+0.27%
Meme
KatyPaty
#GateMeme
DOGE/USDT Analysis: A Game of Key Support and Macro Headwinds
The DOGE/USDT daily chart presents a classic consolidation pattern near a critical support zone. While the recent macro-driven price action has been bearish, the market is closely watching a specific level to determine the next direction.
📊 Current Market Snapshot
· Price: ~$0.0849
· Key 24h Levels: High: $0.0882 | Low: $0.0822
🐻 Bearish Signals
The current price action is influenced by a mix of internal and external factors:
· Major Fundamental Negative: The shutdown of a prominent Dogecoin spot ETF, with trading set to cease on October 14, 2026, has sent a clear signal of weak institutional demand. The fund reportedly struggled to gain traction, with assets under management remaining low. This is viewed as a negative for long-term adoption.
· Macroeconomic Pressure: Broader market weakness continues to pressure risk assets like crypto. Recent economic data indicating higher-than-expected inflation and the expectation of a Federal Reserve rate hike have forced long traders to unwind positions, with over $8.5 million in long liquidations on DOGE alone. This has dragged the price below key moving averages, including the 200-day MA near $0.088.
· Technical Weakness: The Daily MACD has recently crossed below the zero line with a bearish histogram, indicating a loss of short-term momentum.
🐂 Bullish Arguments
Despite the bearish macro backdrop, some factors suggest the asset may be oversold:
· Technical Rebound Potential: The 4-hour TD Sequential indicator has flashed a buy signal, which has historically preceded short-term rebounds of 2-11% in the recent past.
· Network Activity: The integration of DOGE onto the Solana network via the Sunrise Protocol has been highly active, processing over $46 million in volume in just three days. While the price has yet to react, this cross-chain engagement could become a positive catalyst once the macro picture improves.
🛠️ Setup Recommendations
Given the conflicting signals, a cautious approach is warranted. The market is in a "wait and see" mode, with the price wedged between key support and resistance.
· Neutral/Bearish Bias (Primary View)
· Entry: A close below the $0.0825 - $0.0800 support zone.
· Target: $0.0790, then $0.0745.
· Invalidation: A strong daily close back above $0.0865.
· Rationale: This aligns with the bearish structure defined by the broken 200-day MA and the ETF shutdown narrative. The confluence of the daily MA30 ($0.0825) and the Bollinger Band lower bound ($0.0799) forms a critical support floor that must hold to prevent a deeper slide.
· Counter-Trend Long (Speculative)
· Entry: A bounce off the $0.0820 - $0.0845 support zone with visible volume.
· Target: $0.0865 (initial resistance), then $0.0900 - $0.0920.
· Invalidation: A daily close below $0.0790.
· Rationale: This setup relies on the support zone holding and the TD Sequential buy signal playing out. However, given the broader market conditions, this should be treated as a short-term play with tight risk management.
⚠️ Risk Management Note: The $0.0883 level remains the crucial line in the sand. Reclaiming this level on a closing basis would invalidate the current bearish bias and signal a potential shift in market structure. Until then, further downside or extended consolidation is possible.
This analysis is for educational purposes and does not constitute financial advice. Always conduct your own research.
repost-content-media
Meme
KatyPaty
#AugustCoreCPIBeatsExpectations
NVDA/USDT Analysis: A Short-Term Rebound Setup with a Heavy Macro Backdrop
The daily chart for NVDA/USDT shows a sharp pullback to a key support zone after a rejection from the recent high. While the immediate technical picture is oversold, the setup is heavily influenced by two major events on the macro calendar next week: the FOMC meeting and the CLARITY Act vote.
📊 Current Market Snapshot
· Price: ~$219.4
· 24h Range: $218.4 (Low) – $222.2 (High)
🛡️ Long Setup (Risky but Technically Justified)
The price is testing the lower boundary of the recent consolidation. A short-term bounce is possible if this support holds.
· Entry: A bounce off the $217.50 – $220.00 support zone.
· Target (Take Profit): $224 – $227 (near the EMA10/EMA30 cluster).
· Stop Loss (Invalidation): A clean 4H close below $216.00.
· Rationale: The $217.50 level has already produced a "B" (buy) signal from the chart's automated system. The price is also sitting below the lower Bollinger Band, which often indicates an oversold condition. The MACD histogram, while negative, is showing signs of contracting.
⚠️ The Macro Headwinds (Why This Is Not a Slam Dunk)
The "Long" setup above is purely a technical bounce play. The broader context is bearish:
1. The FOMC Meeting and Rate Hike Fear
The Fed's September 15-16 FOMC meeting is imminent . Market pricing has flipped dramatically. While the Fed is expected to hold rates at 3.50%-3.75% in September, a strong Producer Price Index (PPI) print for August has pushed the probability of a rate hike at the October 2026 meeting to 100% . About 70% of economists expect a hold in September, but a growing number (30%) see a hike as possible . For a high-multiple growth stock like NVIDIA, the threat of "higher-for-longer" interest rates is a primary headwind. A hawkish surprise or rhetoric from the Fed next week would likely pressure NVDA further.
2. The CLARITY Act Vote and Regulatory Overhang
The Senate votes on the CLARITY Act on September 15 . This crypto market structure bill, which would define whether digital assets are securities or commodities, requires 60 votes to advance . The odds of passage in 2026 are estimated at only ~10-17% due to unresolved disputes and the tight congressional calendar . A failure to advance the bill would be a sentiment negative, and while NVDA is a traditional equity, the crypto-linked asset (NVDA/USDT on Gate) often sees amplified volatility from industry-specific news. The vote could introduce significant intraday volatility.
🐻 Critical Risks to Monitor
· Director Selling: Long-time Nvidia director Mark Stevens sold roughly $646.5 million worth of stock across Aug. 31 through Sept. 4, with individual transactions priced between roughly $220 and $234 . This insider selling near the recent peak is a bearish signal.
· Testing Capacity Strains: Reports indicate that Nvidia is paying more to secure AI chip testing capacity, which is tightening supplies for other designers . While this reflects strong demand, it also points to operational bottlenecks.
· High Valuation Sensitivity: Nvidia has gained nearly 20% year-to-date . This performance makes the stock vulnerable to profit-taking, especially when the cost of capital threatens to rise.
Summary: A long position here is a contrarian bet on a technical bounce at $217.50, but the fundamental and macro setup next week is precarious. Risk management should be strict. The ideal scenario for bulls is a dovish or neutral Fed and a positive CLARITY Act headline. If either event turns bearish, the long setup could quickly invalidate. For those unwilling to take on that event risk, staying in cash or waiting for the FOMC dust to settle is the safer path.#ShareWeekly
$NVDA
repost-content-media