Square
Following
Hot
News
Profile
Share your thoughts
placeholder
Article
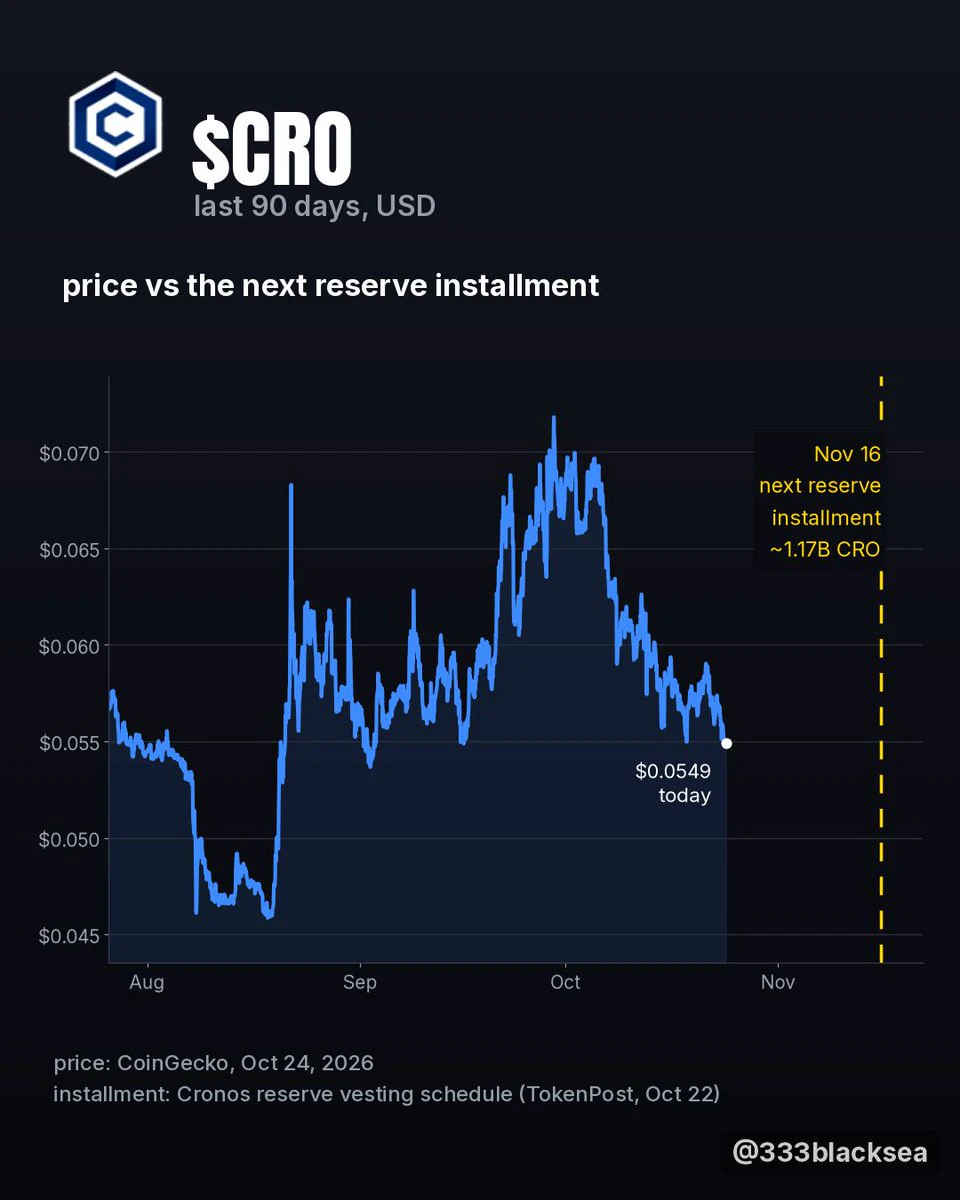
CRO doesn't have a tech problem.
Cronos keeps shipping upgrades and the chart barely notices.
It has a supply problem.
Next reserve installment: about 1.17 billion CRO on Nov 16.
The day app revenue burns more CRO than the reserve unlocks, this chart looks very different.
post-image
CRO+0.30%
Bitcoin Core speeds up security fixes as 44% of nodes run unsupported versions
Bitcoin Core is accelerating how it patches AI-era security flaws, after a network snapshot showed 43.6% of sampled peers still run unsupported software. That share could cross 50% after the next major release.
Quick Take
⚠️ Personal market analysis only. NFA — manage risk and DYOR.
Educational content, not investment advice or a recommendation to buy, sell, deposit, or withdraw any asset. No paid promotion or referral/affiliate links.
post-image
BTC-0.08%
Trenches
ZIG
Z
bade
b
ZIG
0x8c...1145
Market Cap
$.
Change
.
24h Vol
$.
Holders
.
BIRB
B
bade
b
BIRB
G7vQ...KNwG
Market Cap
$.
Change
.
24h Vol
$.
Holders
.
AGT
A
bade
b
AGT
0x5d...e274
Market Cap
$.
Change
.
24h Vol
$.
Holders
.
CNPY
C
bade
b
CNPY
0xc6...ddd2
Market Cap
$.
Change
.
24h Vol
$.
Holders
.
Moustache
M
bade
b
Moustache
J9WL...pump
Market Cap
$.
Change
.
24h Vol
$.
Holders
.
$PUMP has finally climbed back above those moving averages. I’ve decided to go long here and see if it has the momentum to keep rising.
Take profit: 0.004465 Stop loss: 0.004121 Hot coins: $BIR : Current price 0.08609 - 24-hour change: +7.28%
$LIGH : Current price 0.3037 - 24-hour change: +35.64%
post-image
PUMP+0.18%
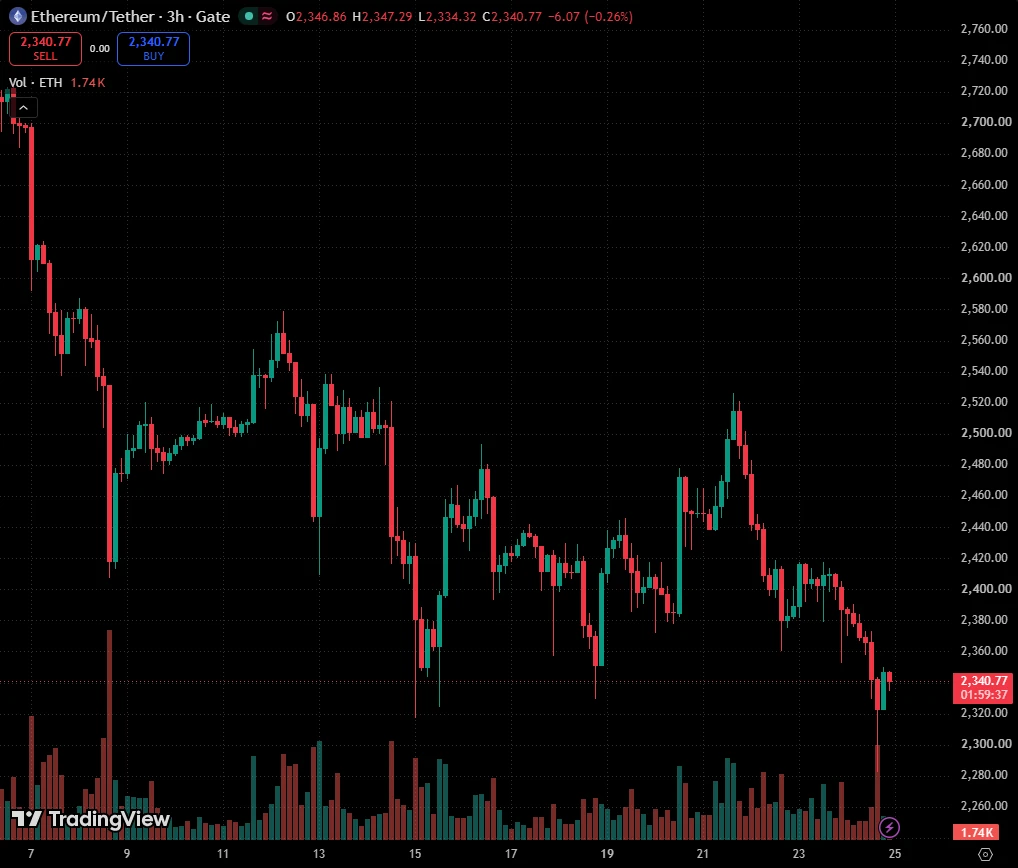
$ETH ETHUSDT 3H: sweep of the 4th wave lows, watching for a reclaim
ETH has swept the 4th wave lows on a spike in volume. I'm watching the 3H closes to see whether price can reclaim them.
The bigger picture
My read: ETH is in wave 4 of wave 1 up from the lows. Wave 5 comes next. This count is wrong if wave 4 trades back into the price range of wave 1.
What just happened
Price fell through the 4th wave lows at 2,356.41 and through the 2,318.00 line, which I drew from the 15 Oct lows. Volume spiked well above its average line on the way down. Price then moved back above 2,318.00. That is a sweep
post-image
ETH-1.01%
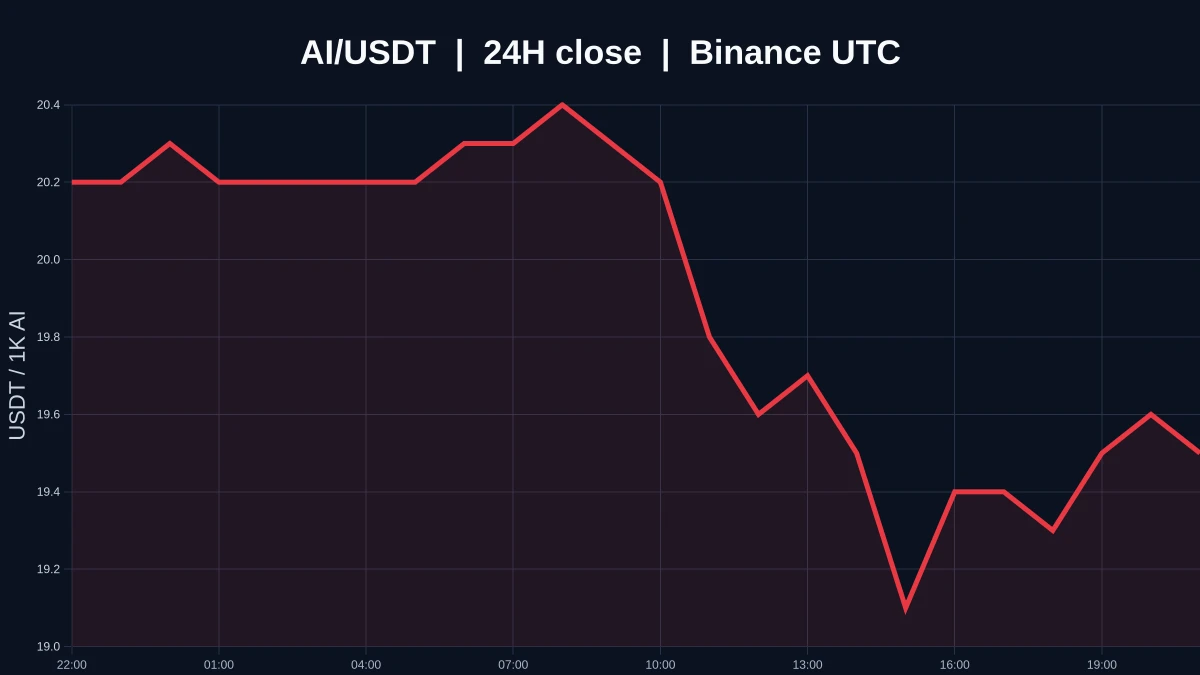
$AI is currently trading at 0.0195, down 3.465% over 24H (range: 0.0191–0.0212). The 1H and 4H charts are both weak, with EMA20 acting as resistance and RSI near lows. Watch whether price can hold above resistance at 0.0212, and whether it can reclaim 0.0191 after losing that level. Volume is only 0.00x the average, so any move past these levels needs confirmation from participation. If price holds above resistance, keep an eye on it; if it breaks support, beware of further weakness. The market is highly volatile; for observation only.
post-image
Earnings Season’s Nastiest Trap: If Results Are Great, Why Does Wall Street Still Sell Off?
Retail investors read earnings reports and see profits growing: Buy, buy, buy! Wall Street asks: How much did profits grow? How much can they grow next year? If growth slows, what justifies such a high valuation?
The same report, two different interpretations—and one investor may end up buying at the top while another is left holding the bag.
What really moves stock prices during earnings season is the gap between actual results and market expectations. If the market was expecting profit growth of 30%,
TSLA-0.62%
  • 13
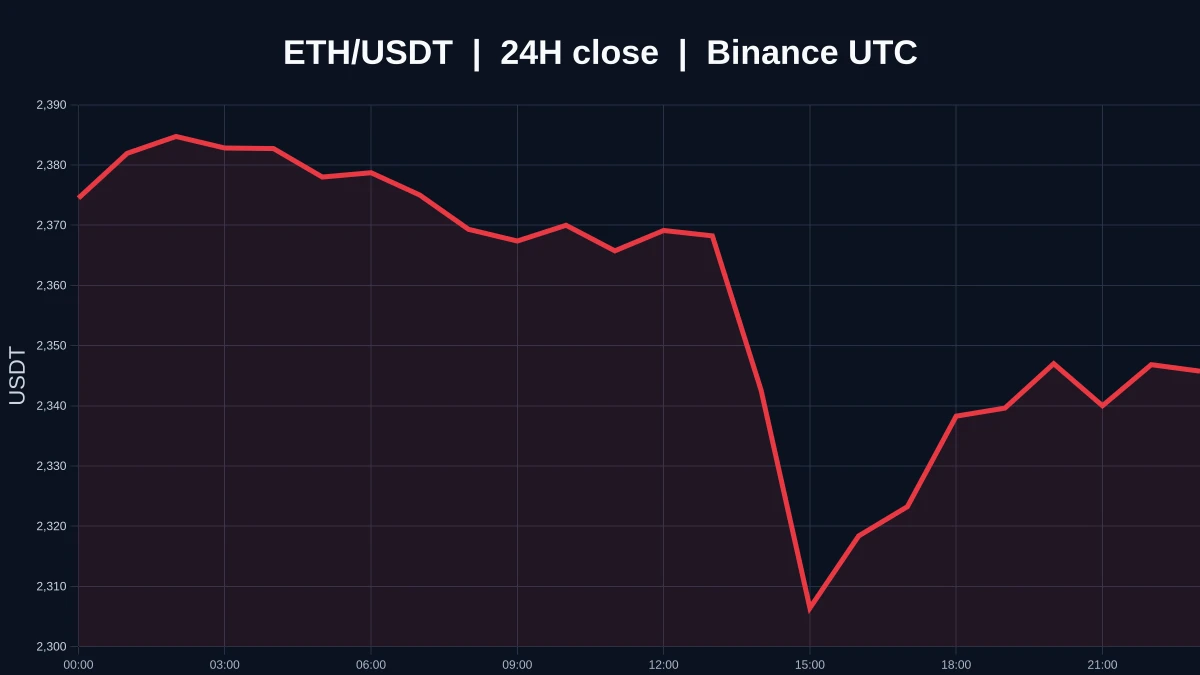
“Ethereum has dropped below 2,300 USDT and is now trading at 2,291.090088 USDT, with a narrowed 4.50% decrease in 24 hours.” means that, as of October 24, 2026 at 15:17 UTC, the market price of one ETH had fallen under the 2,300 USDT level and was quoted at about 2,291.09 USDT market data.
 
The “4.50% decrease in 24 hours” indicates ETH was worth 4.50% less than it was 24 hours earlier. “Narrowed” suggests the decline had become smaller than it was earlier in that 24-hour period—potentially indicating that selling pressure had eased somewhat—but it does not by itself confirm a price recovery
post-image
ETH-0.94%
#MetaSwingsFromSurgeToSelloff
Meta's Market Reversal: AI Ambitions, Advertising Strength, and the Growing Pressure to Deliver Returns
Meta Platforms is entering a critical phase in its market story, where technological ambition must be matched by financial results. The company's powerful advertising ecosystem, expanding artificial intelligence capabilities, and massive global audience continue to support its long-term potential. However, changing investor expectations can quickly transform optimism into selling pressure when rising expenses create uncertainty about future profitability. This
META+0.23%
GM.
It’s my birthday today.
Well… another year older, haha.
【OpenSky · Daily Exploration Day 16】
OpenSky’s exploration coordinates for today: “External motivation gets you in; internal motivation keeps you here.”
When prices rise, you get excited; when they fall, you panic. Good news comes, you rush in; bad news comes, you run. External motivation is like a kite, flying wherever the wind blows and crashing when it stops.
OpenSky builders are different. Our engine is on the inside.
🔹 The conviction that “secure communication is a necessity”—not because AI Agents are hot today, but because the question of how machines can collaborate with trust will hav
SAFE+0.93%
Recouped the losses caused by a trading mistake, returned to the day’s profit level, and achieved the first 2x, $BTC 81000 take profit on 70% and keep 30% of the position, $ETH 2390 take profit on 70% and keep 30% of the position
I’m prepared to hold for the long term, and future trades will be opened in isolated margin mode
BTC-0.16%
ETH-1.01%
Trying to get myself more chickens.
Went to use relay, slippage is too high.
Went to official abstract bridge, routes to relay.
Went to the official-but-hidden native abstract bridge, frontend misquotes gas so bridging is broken.
Hand built a tx with proper gas and bridged ~1 eth.
Everyone who wanted a chicken went through hell and back to get one, thank you guys for that.
Anyway, I'm now the highest offer among any given trait, so if you were going to sell your chicken please do it now.
And man I can't wait until these things are on Ethereum.
post-image
ETH-0.94%
The Time Chapter—The Process of Penrose’s Argument
How can the claim of time asymmetry be proven?
First, assume that a correct theory of quantum gravity, called CQG, would explain the Weyl curvature hypothesis (WCH).
This suggests that the initial singularity must be constrained by Weyl = 0 in its immediate future.
In principle, an initial singularity is a place from which particles can emerge.
This is exactly the opposite of how singularities in black holes behave.
One possible type of initial singularity, different from the Big Bang, is a singularity inside a white hole.
A white hole is the
post-image
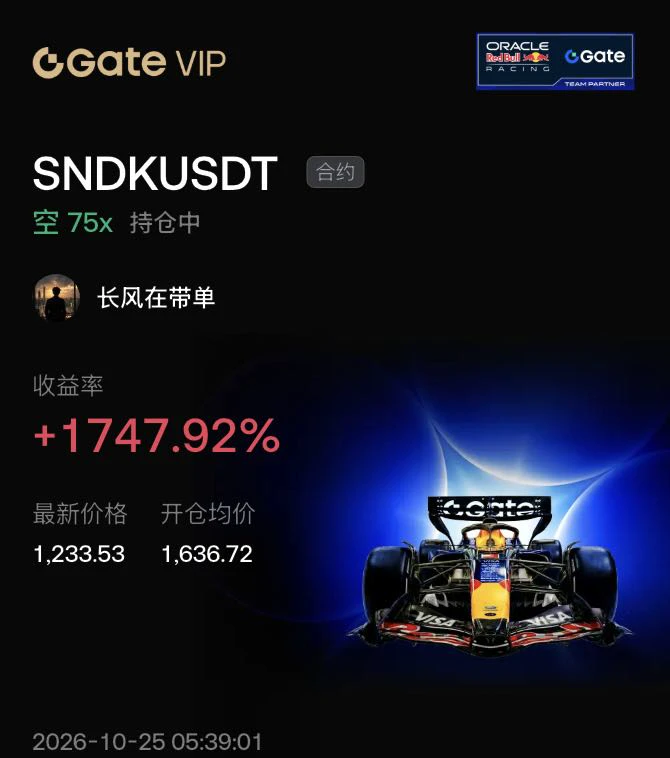
Remember that line in the base—$SNDK this structure, and a breakdown is the starting gun for bears.
Looking back now, the 75x short is up +1747.92%, from 1636 to 1233, a drop of nearly 25%. It’s not that I’m some genius; the market wrote the answer right on the wall.
Shorting is never about guessing the top. Wait for three signals to line up: support breaks, the retest fails, and volume dries up. SNDK had been consolidating near the highs for too long, with volume weakening day by day. The bulls were already out of ammo. Enter at the moment of the breakdown, then let the cascade do the rest.
post-image
SNDK+0.11%
AKE-20.67%
MAGMA-4.49%
  • 1
$ETH Currently trading at 2345.76, down 0.64% over 24H (range: 2282.46–2390.24). The 1H EMA20 at 2352.60 is acting as resistance, with RSI at 41.6, indicating weakness; the 4H EMA20 at 2385.04 is overhead, with RSI at 36.1, indicating greater weakness. Volume is only 0.15x the average. Going forward, watch whether price can hold above resistance at 2390.24, and whether it can reclaim support at 2282.46 if that level breaks. Market volatility is high; for observation only.
post-image
ETH-0.94%
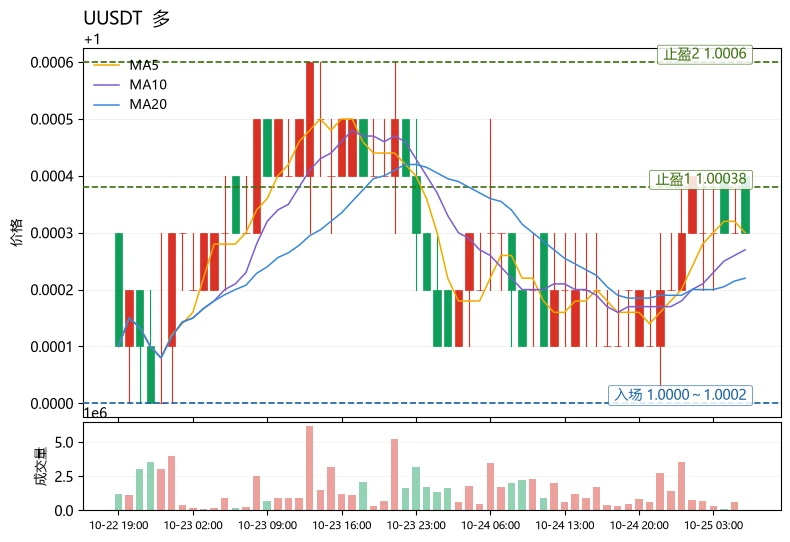
$U The current price is 1.0003, with short-term key levels at the Bollinger lower band of 1.00006 and upper band of 1.00038. MA5 (1.0003) has just crossed above MA20 (1.00022), which is the core basis for this assessment.
Teaching point: To judge whether a trend is “healthy” using moving averages, focus not on the golden cross itself, but on whether the price can hold above the moving averages afterward and stay above them on a pullback. $U MA5 currently leads MA20 by just 0.00008, making this a “tight” golden cross with weak trend strength. RSI at 53.6 is in neutral territory, and the MACD hi
post-image
XPL-1.23%
Polkadot's Nakamoto coefficient is 180: it would take 180 of its 600 validators acting together to disrupt the network.
Bitcoin's is 3, Ethereum's is 5 and Solana's is 18.
@Polkadot
DOT-3.06%
BTC-0.08%
ETH-0.94%
SOL-0.52%
(new streamer)market update
live-cover
LIVE1,331
AI Spending Hits the Ceiling! For Tech Giants’ Earnings, the Next Challenge Is Payback, Not Growth
Today’s U.S. tech giants look like a group of wealthy people charging into the future on their credit cards: buying servers, building data centers, stockpiling chips, and poaching AI talent with high salaries.
The more aggressively they spend, the more excited investors get? Not so fast—the bill will come due sooner or later.
In late October 2026, the market is closely watching earnings from tech giants such as Microsoft, Alphabet, and Amazon, as well as their AI capital spending plans. Estimates
NVDA-0.60%
  • 26
Market update BTC
live-cover
LIVE697
Load More

Join 40 M users in our growing community

⚡️ Join 40 M users in the crypto craze discussion

💬 Engage with your favorite top creators

👍 See what interests you

Trending Topics

USEarningsSeason

63.44k Views3.29k Discussing

The U.S. Q3 earnings season is in full swing, with major tech companies including Tesla and Meta reporting results. Market focus is shifting beyond revenue and profit toward AI spending, capital expenditure, margins and forward guidance. Which company’s earnings are you watching most closely?

GateWCTCS9GlobalTradingCompetition

605.38k Views7.89k Discussing

USConsumerSentimentNearRecordLow

5.63k Views214 Discussing

View More