

Square
Following
Hot
News
Notifications
Profile
Share your thoughts
placeholder
Article
AKE, a longtime crypto enthusiast, returns to the crypto market😀
AKE+6.07%
#每周来晒 #AITechSelloffPutsCryptoUnderPressure The Cross-Asset Spillover: High-Beta Tech Deleveraging Liquifies Crypto Margins

A synchronized liquidation wave is rippling across global financial desks as a severe unwind in artificial intelligence and semiconductor valuations spills directly into the digital asset ecosystem. When institutional risk parameters breach their tolerance thresholds in traditional equities, multi-strategy funds routinely treat liquid crypto allocations as an immediate capital source to cover margin calls and stabilize balance sheets. This structural capital flight has s
post-image
BTC-0.67%
ETH-1.26%
USDC+0.01%
NDAQ+0.28%
Trenches
ZIG
Z
bade
b
ZIG
0x8c...1145
Market Cap
$.
Change
.
24h Vol
$.
Holders
.
BTC
B
bade
b
BTC
C5xp...pump
Market Cap
$.
Change
.
24h Vol
$.
Holders
.
GM
G
bade
b
GM
0x13...7777
Market Cap
$.
Change
.
24h Vol
$.
Holders
.
Diamond
D
bade
b
Diamond
5VCE...pump
Market Cap
$.
Change
.
24h Vol
$.
Holders
.
DOGE
D
bade
b
DOGE
DoGE...fm7R
Market Cap
$.
Change
.
24h Vol
$.
Holders
.
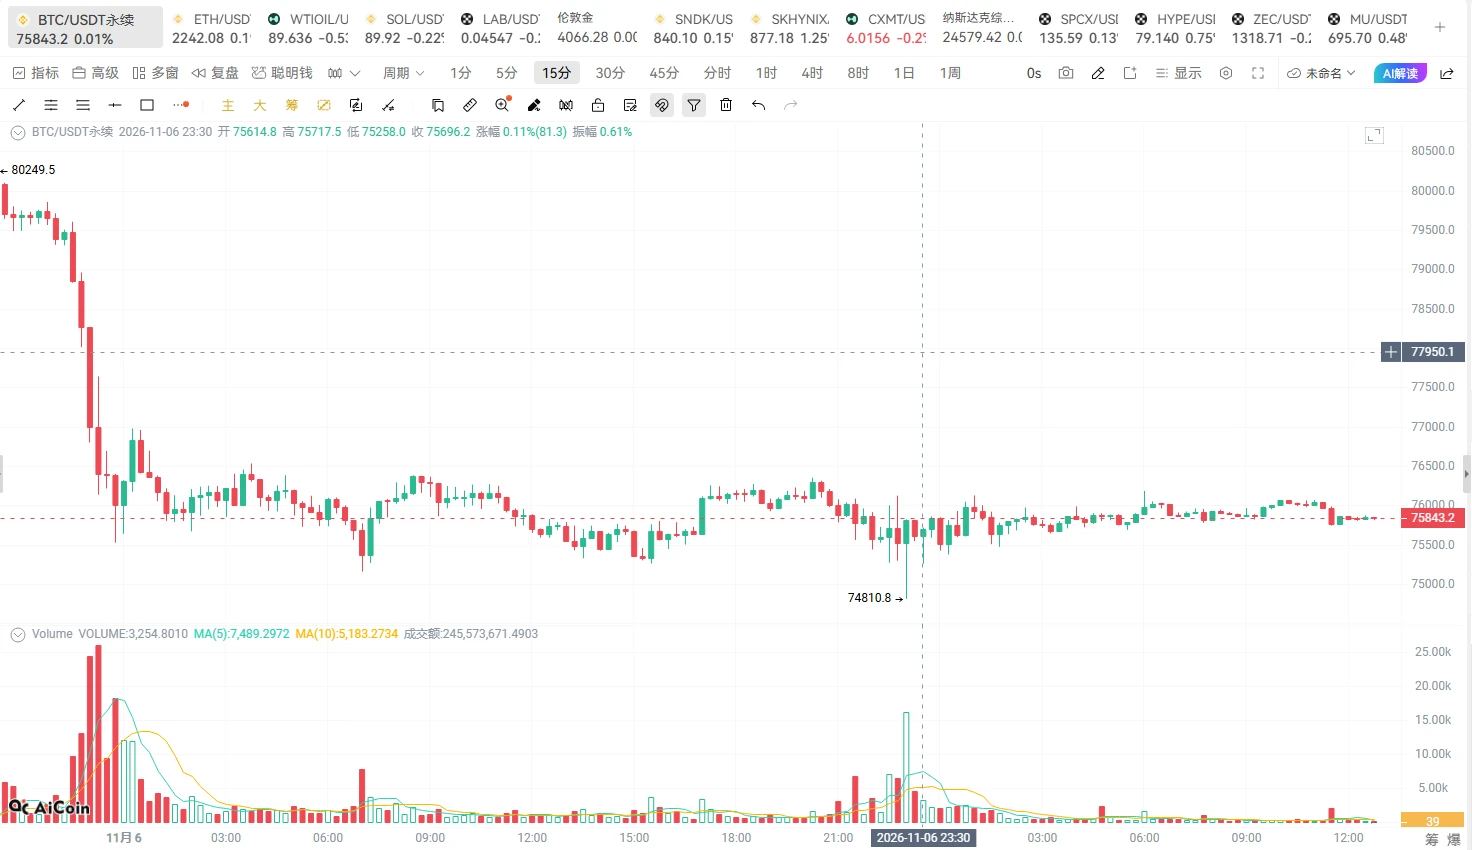
BTC | November 7 trading plan: Trade the 75000–76500 range, buy low and sell high!

Liquidity is low over the weekend, so there’s no need to force trades. The market has been quite volatile this week, so take it easy. If prices haven’t reached your levels, wait patiently.

Long plan:
Go long near 75000, stop-loss at 74800, target 76000–76500.
If 74800 breaks decisively, cancel the long plan and don’t blindly buy the dip.

Short plan:
Look for a short near 76500, target 75500–75000.
If the price breaks above 77200 and holds, cancel the short plan and don’t stubbornly short against the trend.

M
post-image
BTC-0.67%
🎁 5,000 USDT for grabs! Round 2️⃣ 6️⃣ of Growth Points Draw is ongoing!
Every draw wins! No trading volume required for new users! 🤩

💫 Stay active and earn points every day:
🔹 Square: Post, like, comment — up to 600 pts/day
🔹 Live: Watch, like, comment, share streams — up to 300 pts/day
🔹 Chat: Join discussions — up to 90 pts/day
🔹 Creators: Post designated token/trading card content — up to 300 pts/task

Unlock SPCX tokens, a Gate tri-fold keyboard, and exclusive vouchers!

👉 Try your luck now: https://www.gate.com/activities/pointprize?now_period=26
$BTC $ETH $TSLA

Gate_Square
🎁 5,000 USDT for grabs! Round 2️⃣ 6️⃣ of Growth Points Draw is ongoing!
Every draw wins! No trading volume required for new users! 🤩

💫 Stay active and earn points every day:
🔹 Square: Post, like, comment — up to 600 pts/day
🔹 Live: Watch, like, comment, share streams — up to 300 pts/day
🔹 Chat: Join discussions — up to 90 pts/day
🔹 Creators: Post designated token/trading card content — up to 300 pts/task

Unlock SPCX tokens, a Gate tri-fold keyboard, and exclusive vouchers!

👉 Try your luck now: https://www.gate.com/activities/pointprize?now_period=26
$BTC $ETH $TSLA
repost-content-media
SPCX+0.78%
BTC-0.67%
ETH-1.26%
TSLA+4.26%
  • 2
market updates
live-cover
LIVE1,190
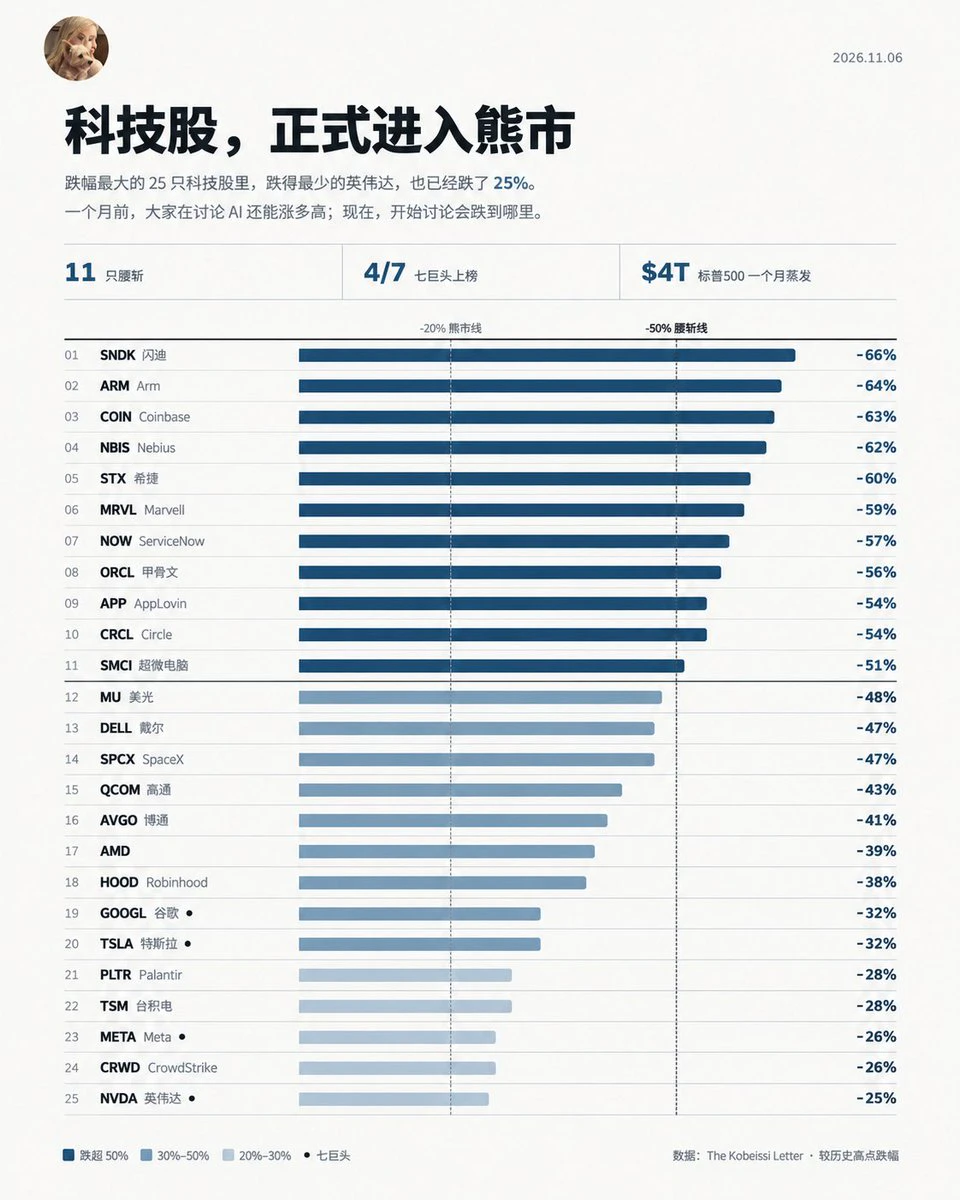
The only ones on this list I’d dare buy are
NVDA, META, GOOG, SPCX
All the other hardware companies are second-tier
If the market really gets dumped, they could fall all the way back to 2024 levels
post-image
NVDA+2.80%
GOOG+0.71%
SPCX+8.74%
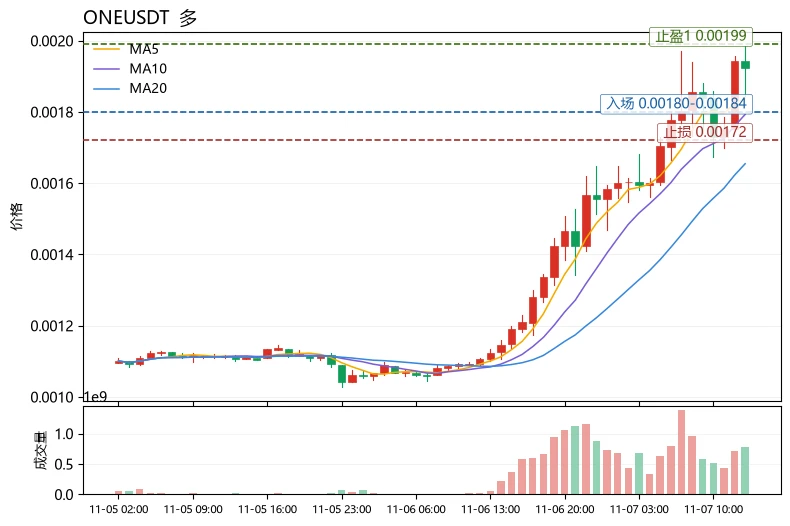
$ONE Current price: 0.001925, up 69.90% in 24h. RSI at 77.3 has entered overbought territory, and the 30-candle range is 48.02%, with volatility at an extreme level. The funding rate is -0.0003%, so shorts are still paying, but the Fear & Greed Index is only 25. Short squeezes amid extreme fear are often accompanied by sharp pullbacks. Assessment: The medium-term bullish structure remains intact (MA5 crossed above MA20, MACD histogram is positive), but chasing the rally in the short term offers a very poor risk-reward ratio. Only enter on a pullback; do not chase.

Reference entry range: 0.001
post-image
WLD-5.61%
#Analytics

#PUMP Price remains in a weak position

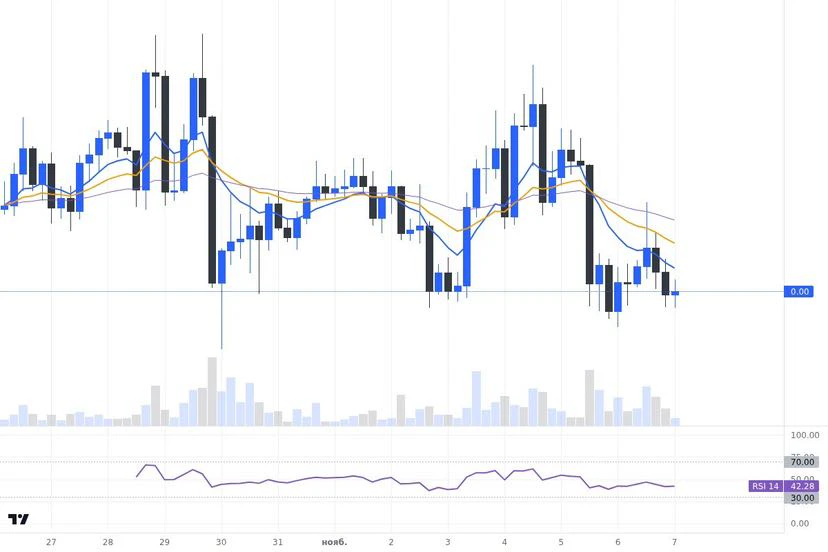
PUMP’s current outlook is negative: on the four-hour chart, the price of $0.003922 is below the EMA 20 ($0.00405711) and EMA 50 ($0.00414857), with the short-term average below the long-term one. RSI 14 on the same chart is 37.9: momentum is also tilted to the downside.

At the same time, the volume of the latest closed four-hour candle is below the average volume of the previous twenty candles. This is an important detail: price weakness is not accompanied by elevated trading volume. There is no basis for calling the current situation a stro
post-image
PUMP-1.06%
$HYPE ’s 1-hour and 4-hour charts are giving opposite signals. Which one is more reliable?

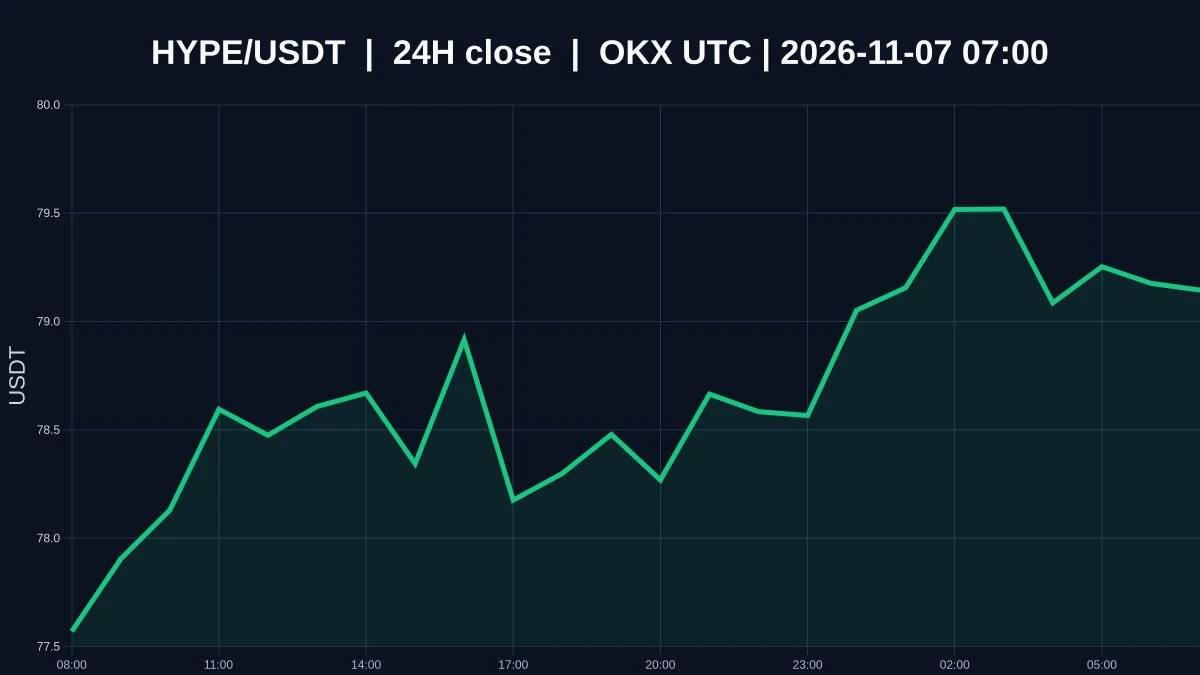
$HYPE is currently priced at 79.15, up 2.280803773341078% over the past 24 hours, with an intraday high of 79.661 and a low of 76.897. The 1-hour trend is leaning bullish, while the 4-hour trend is leaning bearish, so the two time frames have yet to align. The volume ratio is 0.011806872277590872, indicating extremely low market participation. With so little capital involved, even small flows can cause short-term price moves, but that doesn’t confirm a direction.

The current bullish 1-hour trend for $HY
post-image
HYPE+0.24%
In crypto, information moves fast.
One minute, nobody is talking about a project. The next minute, it's everywhere.
But being early to a conversation doesn't automatically mean you've found an opportunity.
Read. Research. Verify. Think independently.
Knowledge is an advantage worth developing.
#Crypto #DYOR #Blockchain #Web3
post-image
(NEW STREAMER) BTC PREDICTION
live-cover
LIVE1,457
When a strategy starts losing money, the most dangerous thing to do is neither stop immediately nor stubbornly keep going, but repeatedly change parameters without evidence.

Many traders go through this process:

A strategy performs well in backtests and even makes consistent profits in live trading. But after a while, losses start to mount.

At this point, three reactions are common:

First: assume it’s just bad luck and keep trading.

Second: keep adjusting parameters in the hope of restoring the equity curve.

Third: start doubting the entire strategy and even abandon a trading system that
post-image
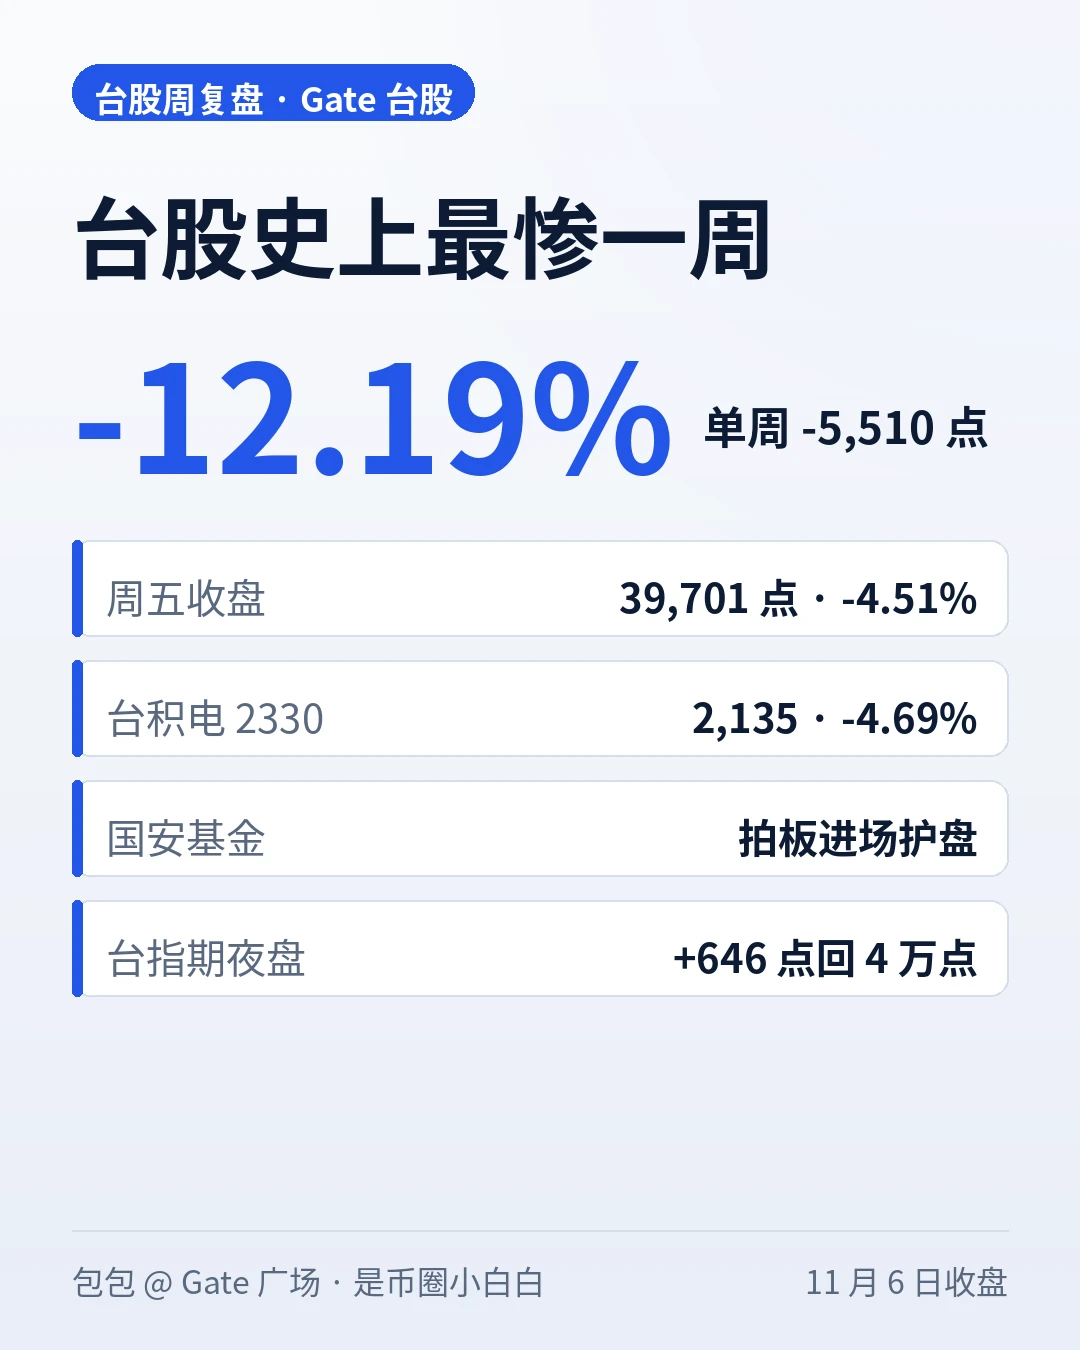
Taiwan stocks fell 5,510 points this week, down 12.19%—their worst single week ever.
‍#Gate上线台股交易
‍#AI科技股大跌加密市场承压
Week in review: The weighted index closed at 39,701.64 points on Friday, down 4.51%. It fell 5,510.19 points, or 12.19%, for the week, its largest weekly point loss in history. The weekly chart posted four straight declines, and the index fell for 7 consecutive trading days. Friday was especially nerve-racking: The market opened with a gap down below 40,000, hit an intraday low of 37,837.05 points, and at one point plunged 3,737.67 points, nearly 9%—also the largest intraday poin
post-image
TSM+6.60%
$BTC Pay attention to the higher time frames. The lower time frames are too difficult to trade—afraid of going long at the top or short at the bottom.
As long as the weekly chart doesn't break below 70,000, I still see this as the early bull market. Those saying it will fall to 30,000 or 40,000, show your orders. Are you holding any short positions?? If not, could you analyze things rationally?? Why keep calling for 30,000 or 40,000?
Looking at the 4h chart, BTC is near the lower boundary of the ascending channel, with a confluence level at 70,500. The two relatively important support levels a
BTC-0.67%
What Is Maximum Drawdown? Why Doesn’t an Asset’s Eventual Recovery Mean the Holding Period Wasn’t Extremely Risky?

In the cryptocurrency market, some traders assess an investment this way: “It eventually went back up, so I should have just held on.”

But this overlooks an important question: How much did the asset fall before recovering? Could your account withstand that drawdown? If you were using leverage, could your position have been forcibly liquidated first?

To answer these questions, you need to understand Maximum Drawdown (MDD).

First, what is maximum drawdown?

Maximum drawdown mea
post-image
What Is the Risk-Reward Ratio? Why Can a Trading Strategy with a High Win Rate Still Lose Money Over the Long Term?

In cryptocurrency trading, some traders place great importance on their win rate. They want to win at least seven out of ten trades, believing that as long as they make the right call often enough, they can keep making money.

But real trading results depend not only on how many times you win, but also on how much you earn on each winning trade, how much you lose on each losing trade, and how high your trading costs are.

That is why the risk-reward ratio and win rate must be an
post-image
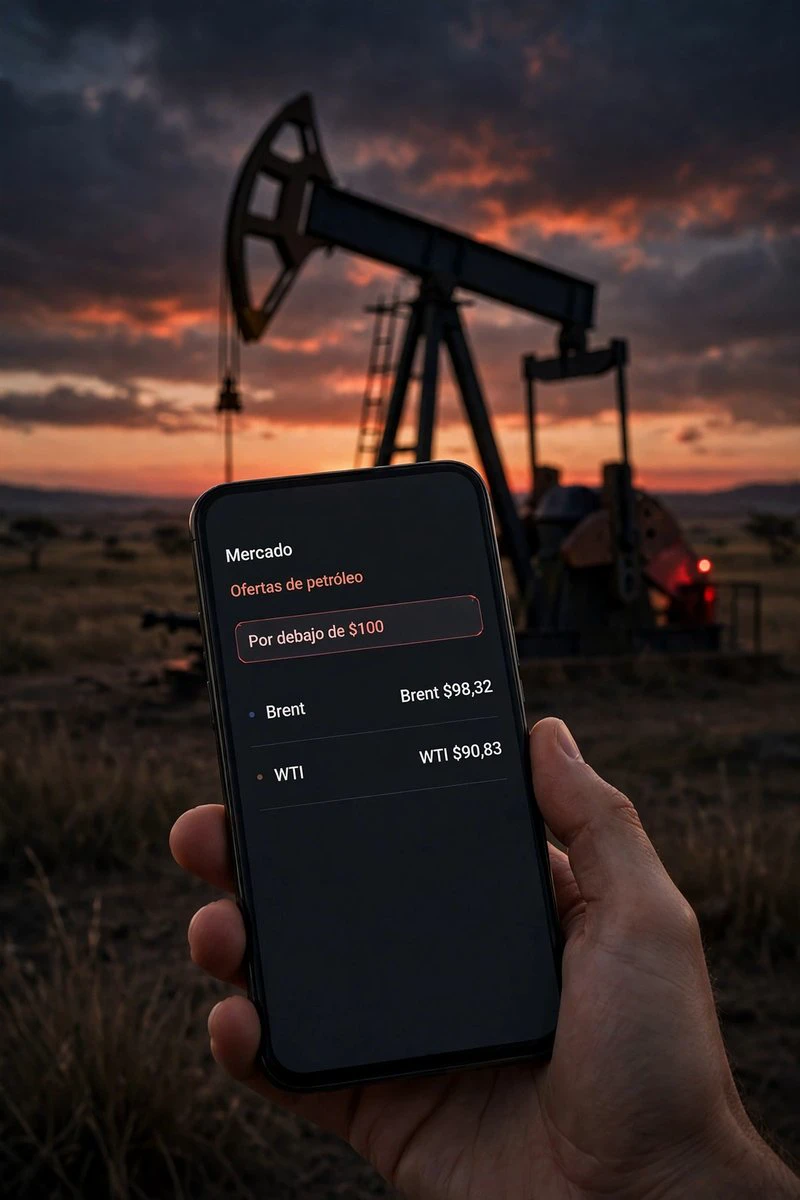
🛢️ Oil closed the week below $100, and that’s being felt in the Venezuelan market.
Brent ended at $98,32 (+0,03%) and WTI at $90,83 (+0,34%). Both benchmarks fell below the psychological $100 threshold in recent days, after a bearish week driven by diplomacy between Washington and Tehran.
What’s driving the price? A conversation between the emir of Qatar and the U.S. president about de-escalating tensions in the Middle East, and the U.S. election results, in which Democrats won the Senate and House of Representatives: a scenario that several analysts see as more conducive to an understanding
post-image
#AITechSelloffPutsCryptoUnderPressure#CryptoMarketUnderPressure #ShareWeekly

Crypto Market Under Pressure: The Battle Between Sellers, Buyers, and Market Confidence

The cryptocurrency market is facing a challenging phase, with selling pressure spreading across Bitcoin, Ethereum, and major altcoins. The important question is not simply why prices are falling, but why buyers are struggling to defend important levels while sellers continue to dominate market activity. In my view, this weakness reflects a combination of profit-taking, declining confidence, leveraged liquidations, macroeconomic
BTC-0.67%
ETH-1.26%
Load More

Join 40 M users in our growing community

⚡️ Join 40 M users in the crypto craze discussion

💬 Engage with your favorite top creators

👍 See what interests you

Trending Topics

USAIStocksHitHard

15.97k Views3.64k Discussing

U.S. stocks sold off sharply on Thursday, November 5 (UTC). The Nasdaq closed down around 5.5%, entering correction territory, while the Philadelphia Semiconductor Index plunged roughly 12%, with chip stocks including $NVDA and $AMD posting steep losses. Beyond profit-taking, investors are growing concerned about the pace of AI data center construction, capital spending, and future returns on investment. The key question now is whether the AI sector’s lofty growth expectations need to be repriced. Where do you think the next opportunities will emerge: chip stocks, tech giants, or other sectors?

USNonfarmPayrolls

23.64k Views4.26k Discussing

StakeOnLaunchpoolToShare450KVLX

2.62k Views774 Discussing

View More