








Square
Following
Hot
News
Notifications
Profile
Share your thoughts
placeholder
Article
Many people see the Fear & Greed Index fall to 11 and instinctively sell everything and exit, treating “extreme fear” as a signal of further declines. This is precisely one of the most common pitfalls of emotional trading—the index is an outcome, not a cause. What really matters is who is holding up and who is following the drop amid the panic.
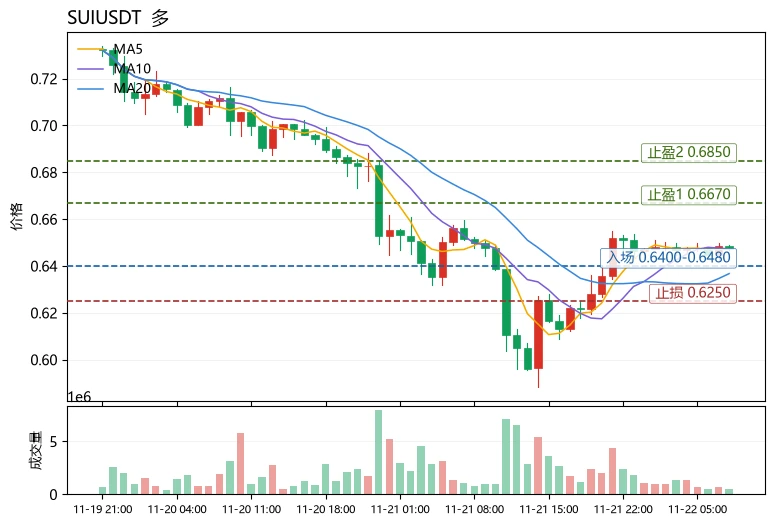
Market sentiment is currently in the extreme fear zone. BTC weakness has led to a contraction in overall risk appetite, but SUI$SUI is down just 0.46% over 24 hours, clearly outperforming $INJ , which is down 6.73% over the same period. Technically, MA
post-image
SUI-1.05%
INJ-1.67%
ENA+8.04%
Fire fire fire 🚨🚨🚨$PIEVERSE continues to be pushed up to the 3.4 range. The rally has stalled, and there’s Alpha at the moment; shorting for the short term seems like a good idea. $VVV is still rising strongly, so I’ll follow along and go long for a while. $SKYAI continues to rise strongly. The long position is already nicely profitable; let’s ride it higher for another stretch. 📈📈📈
post-image
PIEVERSE+0.58%
VVV+0.37%
SKYAI-7.58%
Trenches
IDOL
I
bade
b
IDOL
0x3b...ab07
Market Cap
$.
Change
.
24h Vol
$.
Holders
.
PIEVERSE
P
bade
b
PIEVERSE
0x0e...25a9
Market Cap
$.
Change
.
24h Vol
$.
Holders
.
FIONA
F
bade
b
FIONA
B34n...pump
Market Cap
$.
Change
.
24h Vol
$.
Holders
.
JAGENT
J
bade
b
JAGENT
0x8e...ae15
Market Cap
$.
Change
.
24h Vol
$.
Holders
.
Singularity
S
bade
b
Singularity
7R4M...pump
Market Cap
$.
Change
.
24h Vol
$.
Holders
.
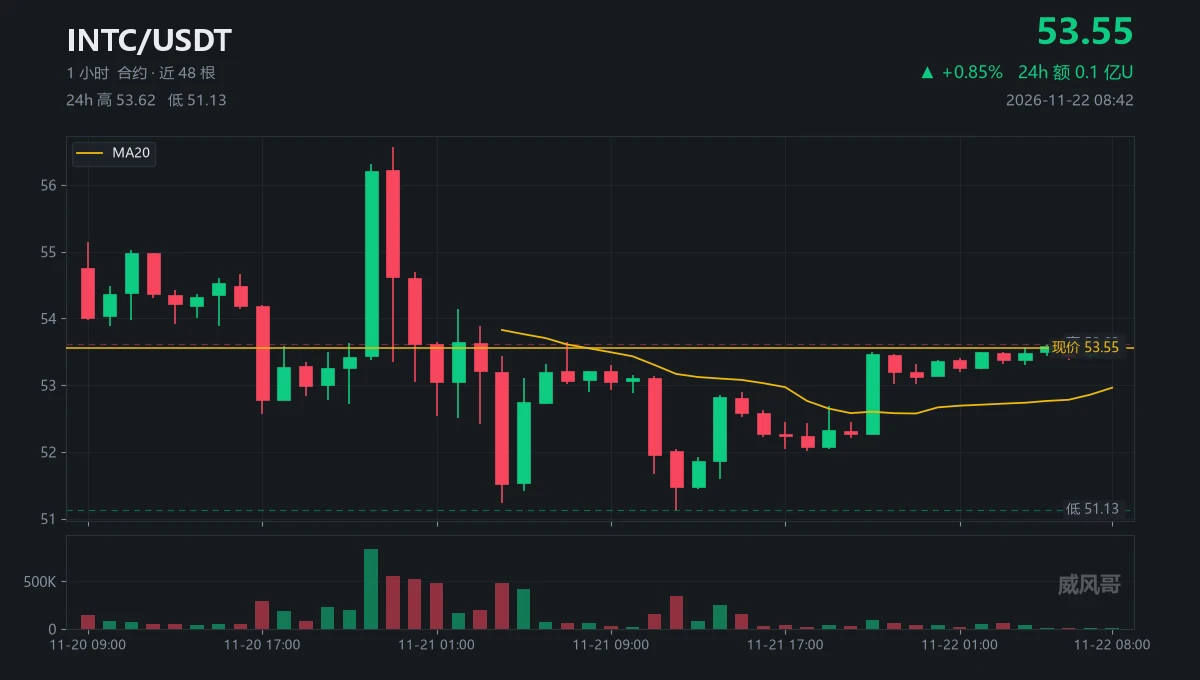
On the morning of the 21st, I set two conditions, both at 53.43.
Only consider going long after reclaiming 53.43, with volume returning to 186k contracts.
A break below 51.24 would signal the next leg, so I’d look lower.
Both conditions triggered, but the direction was the opposite: 53.43.
It touched 51.13 and quickly recovered; now it’s at 53.55, still at 53.43.
I own this mistake: a wick isn’t a breakdown. I mistook a false dip for a step down, 53.43.
The 8 a.m. candle traded just 4,300 contracts, a fraction of average volume, 53.43.
$INTC Hold 51.13; don’t short. Moving above 53.55 needs
post-image
INTC+0.05%
  • 1
  • 2
$ORCA The daily candlestick that just closed showed a profit-taking signal. The chart shows quite good absorption, and it's getting ready for the next big move 🤩 Long, long, long 🔥🔥 Target price 1: 1.35 Target price 2: 1.7 Target price 3: 2.2-4 Stop loss: 0.98$IDOL $EVAA
post-image
ORCA-5.19%
IDOL-6.71%
EVAA-0.49%
$CYBER We’ve already caught this short squeeze driven by negative funding rates. The move was clean and decisive, up 192%—taking profits.
Today, keep an eye on these two: $SOL and ENSO.
Bullish thesis: Funding rates clearly favor a short-squeeze setup, and leveraged shorts are due for liquidation. Watch for long opportunities in $CYBER .
Trade plan: Entry range 0.2001 - 0.2044; targets 0.2137 / 0.2229; stop 0.1910.
One reminder: The 1-hour trend is still bearish. If support at 0.2000 fails, the bullish thesis is invalidated. Don’t get carried away and go all in; size your position based on y
post-image
226
2262026
Pump.Fun
MC:$2.09KHolders:1
26.08%
CYBER-5.40%
SOL-0.77%
#GateAnnualGala #ShareWeekly

Every strong digital community needs more than technology, trading opportunities, and a growing user base. It needs people who are willing to share knowledge, exchange ideas, explain market developments, and help others become more informed participants. This is what makes Gate Social's 2026 Year-End Gala an important occasion for the entire community.

The annual celebration is not simply about presenting awards or recognising popular accounts. It is an opportunity to reflect on the individuals who have helped shape the platform throughout the year. The Streamer
BTC-0.67%
$BTC Bitcoin 55000, the shutdown price for the last batch of miners is 50379. This is the miners’ last stand. Looking ahead, all you can see are dead miners! Where have all the industry’s good consciences gone? Where are the crypto public intellectuals who worry about the country and its people? Now is the best time to buy the dip, bar none... ​​​
post-image
BTC-0.67%
Recent liquidity shortages, combined with panic over uncertainty around capital expenditures, are creating a huge “reverse tech bubble”—even Walmart’s forward P/E has reached 45x.

This explains why the AI bubble “bursts” almost every year. U.S. investors have long enjoyed asset-light business models and simply can’t stomach businesses that need massive capital expenditures to make money. 99% of people who trade stocks don’t use AI at all, so they have no firsthand experience of its value. Everyone is used to seeing the steady monthly growth of SaaS and doesn’t understand that AI revenue comes
WMT+1.54%
  • 4
#ETH
Ethereum currently sits near 1,682 to 1,685 dollars after climbing roughly 3.8 to 5.1 percent over the past 24 hours from levels that had briefly dipped as low as 1,535 to 1,550 dollars. That rebound follows a sharp multi-day slide that left the asset down approximately 5 to 6 percent on the week and nearly 30 percent across the past 30 days, with the 30-day range stretching from highs near 2,470 dollars down to the recent trough. On a one-year basis Ethereum has declined around 39 to 44 percent, and it now trades roughly 66 percent below its all-time high of approximately 4,946 dollars
ETH-1.26%
BTC-0.67%
  • 2
$GRAM — Short entry: 0.9460 Take-profit 1: 0.9365 Take-profit 2: 0.9271 Stop-loss: 0.9838 In light trading, the price can be seen gradually moving lower. Without broader market activity to support the continuation of the move, a gradual pullback often loses momentum over time.
post-image
GRAM-0.97%
$BMT Short thesis update:
On the 4-hour timeframe, price is trading in the 0.02016–0.02023 range. I’m watching to see whether sellers step in around this area. If price reclaims 0.0206, the bearish thesis for this move is invalidated—momentum and structure are what matter.
The current 4-hour quote is 0.0202, below the EMA50 at 0.0206, so bears remain in control. The 1-hour RSI reads 49, with no overbought or oversold extremes so far.
Short zone: 0.02016–0.02023. Targets in order: 0.01997, 0.01981, 0.01959. Stop-loss: 0.02058
The above is only my personal opinion and does not constitute financ
post-image
BMT+5.93%
I spent the whole day running around taking care of business at the Commerce Bureau, without wearing any jewelry.
In the face of power, people are as insignificant as ants.
post-image
$ETH If there’s no market action on Saturday and Sunday, I won’t trade. Everyone should get some rest and relax—we’ll be back at it on Monday!
post-image
ETH-1.23%
market update and trading signal with sheen crypto
live-cover
LIVE2,907
BTC-0.67%
ETH-1.26%
SOL-0.77%
Morning market update
live-cover
LIVE2,244
ETH-1.26%
BTC-0.67%
SOL-0.77%
It did go up, but most of the positions that got liquidated were longs.
Futures positions are shrinking; this rally wasn’t fueled by fresh money.
After a round of liquidations, leverage is lower than yesterday.
post-image
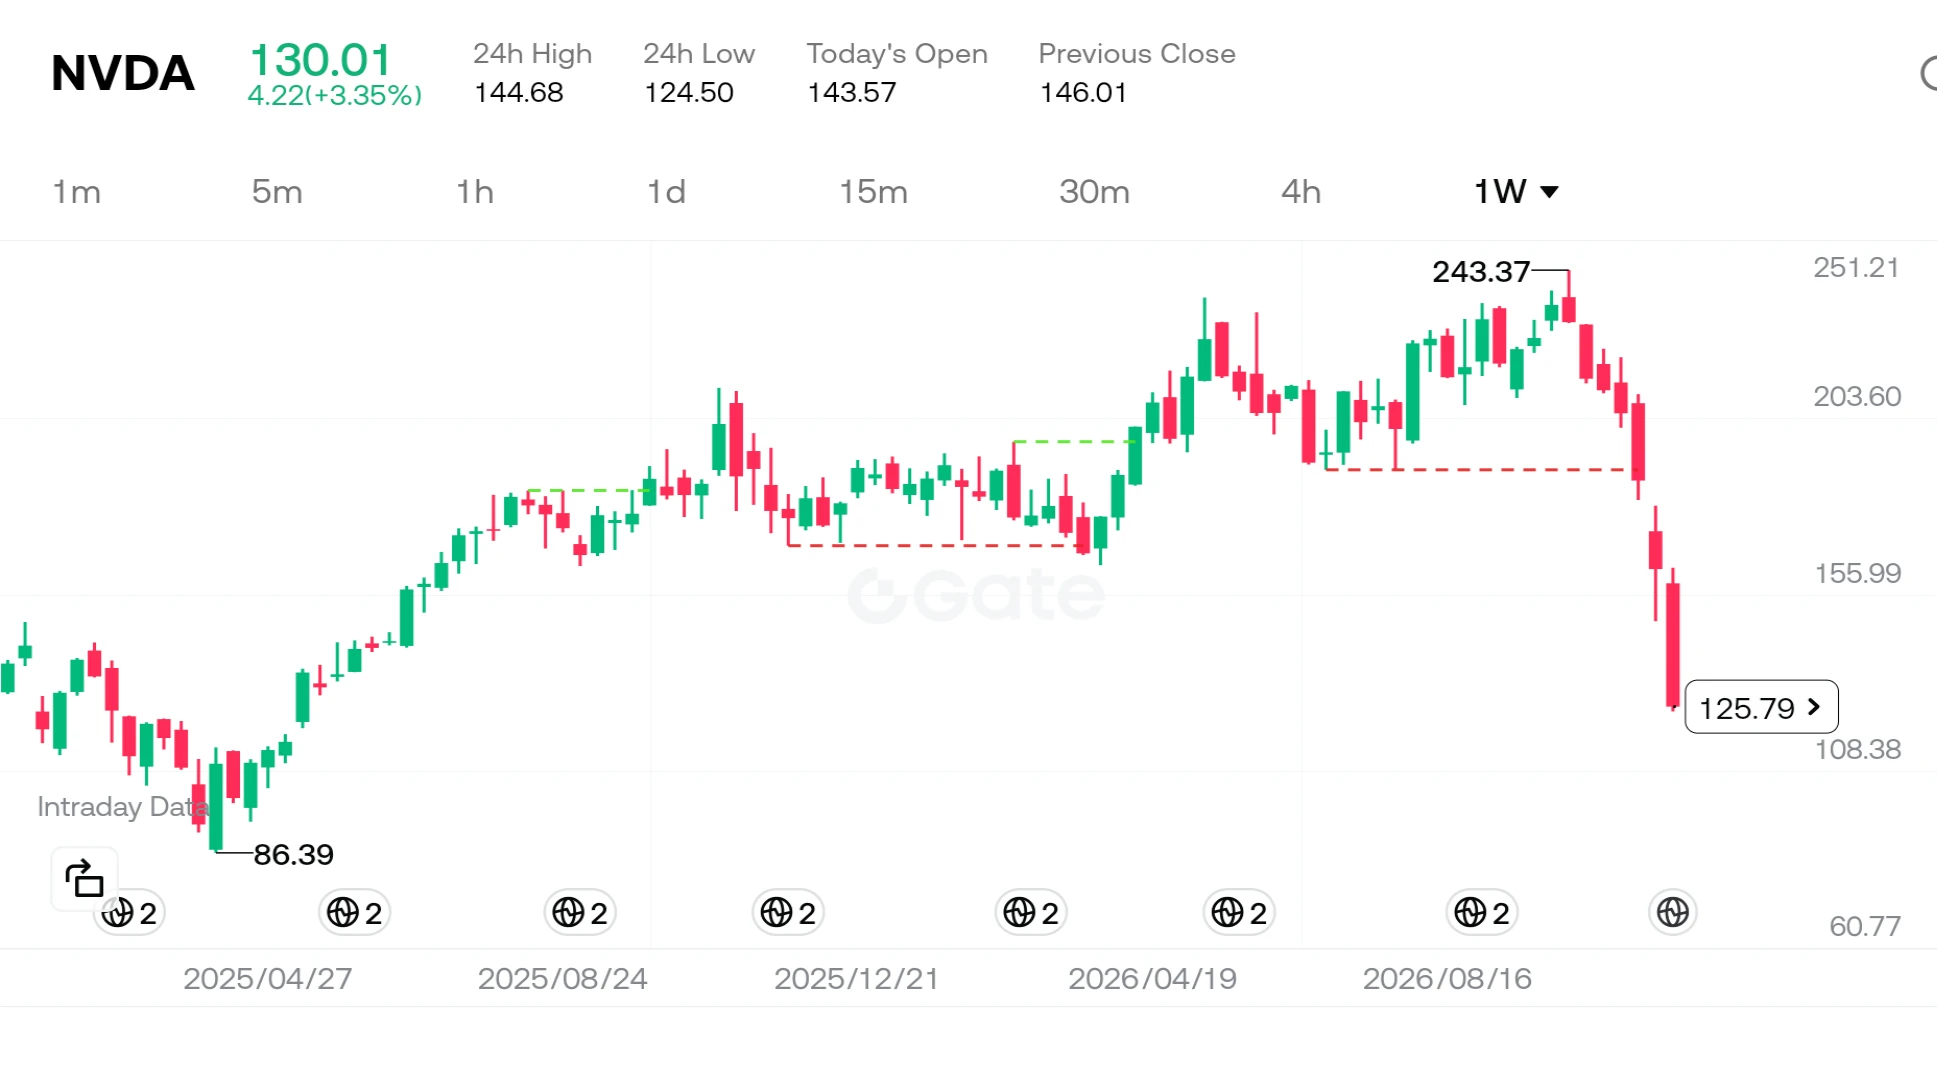
Nvidia shares failed to bring any cheer to investors, slipping to the $130 level in weekend trading. The sharp decline from the stock's peak of $243 can no longer be dismissed as a mere "market correction." The formal investigation launched by the U.S. Securities and Exchange Commission (SEC) into the company’s accounting practices has served as the primary catalyst for this downturn.

So, what does this investigation signify, and why has it shaken the stock price so profoundly?

Looking first at the company itself: as the driving force behind the artificial intelligence revolution, Nvidia has
post-image
User_any
$NVDA ‌
Nvidia has been losing ground for seven consecutive weeks—a trend not seen since 2008. The stock plummeted 14% last Friday alone, bringing its total decline over this seven-week period to approximately 46%. As clearly illustrated on the chart, the price has retreated from a peak of $243 to the $125 range. So, what is the story behind how this once-most-valuable company reached this point?
In reality, this is not merely a stock market correction; it is the result of three major, intersecting storms hitting the same vessel.
First, let’s look at the company’s internal dynamics. Uncertainty within management following a CEO transition, combined with the SEC’s decision to investigate the company’s accounting practices, has severely shaken market confidence. But that is not the whole story. The massive scale of spending on artificial intelligence has led investors to ask: "So much money is being spent—but when will we see a return?"
Meanwhile, macroeconomic headwinds have also shifted. Minutes from the Federal Reserve’s meetings indicate that nearly all officials expect interest rate hikes to continue. A high-interest-rate environment exerts significant pressure on growth stocks, which are valued based on their projected future cash flows. This situation has impacted not only Nvidia but the S&P 500 as well; the index fell 8.6%, marking its worst week since April 2025 and pushing it into correction territory.
Even the major Anthropic IPO that took place last week was not enough to halt this wave of selling. For many analysts, this situation serves as proof that the market is no longer focused on "new narratives," but rather exclusively on "cash flow and profitability." The fact that gold and silver have fallen to their lowest levels in over a year, combined with oil’s decline for the third consecutive week, highlights just how fragile risk appetite has become. Investors have effectively "retreated to their corners."
The most important lesson for individual investors here is that, regardless of how strong a company’s operational performance may be, macroeconomic headwinds and management uncertainties can fundamentally shake its valuation. Nvidia’s core business model remains robust, yet the market is currently pricing in risks rather than the company’s growth story. In times like these, the wisest approach is to avoid leverage and—instead of attempting to call the "bottom"—wait for prices to stabilize.
Do you believe this decline in Nvidia presents a long-term investment opportunity, or are we witnessing the deflation of an artificial intelligence bubble?
#Nvidia #Macro #TechStocks
#ShareWeekly #WCTCS9
Not investment advice.
repost-content-media
NVDA-13.84%
  • 9
  • 3
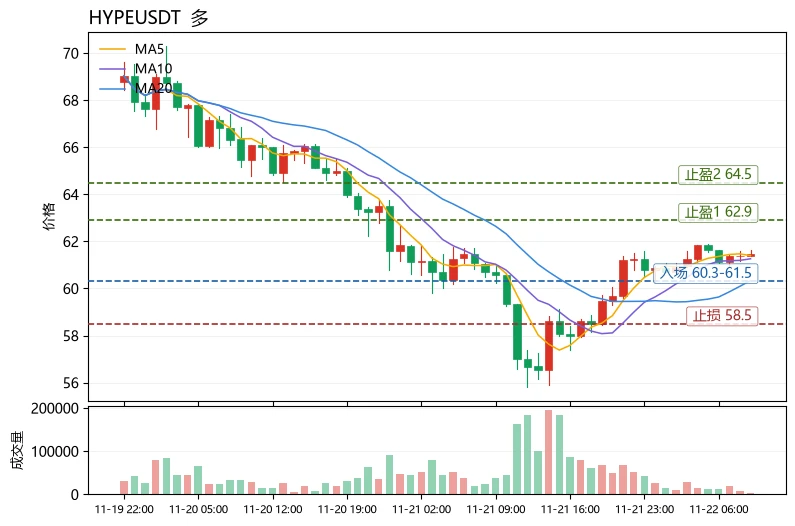
The Fear & Greed Index plunged to the extreme fear zone at 11, yet $HYPE bucked the trend and closed up 1.45%—this divergence is the most unusual detail in today's market. Amid market-wide sentiment hitting rock bottom, funds didn't rush for the exits; instead, they clustered in select assets, suggesting that selling pressure has temporarily subsided and bulls are quietly accumulating in the midst of extreme pessimism.
Technically, $HYPE is currently at 61.45, holding above MA5 (61.396) and MA20 (60.338), with short- and medium-term moving averages in a bullish alignment; RSI at 54.5 is neut
post-image
HYPE+0.24%
ASTER-0.07%
ADA-1.48%
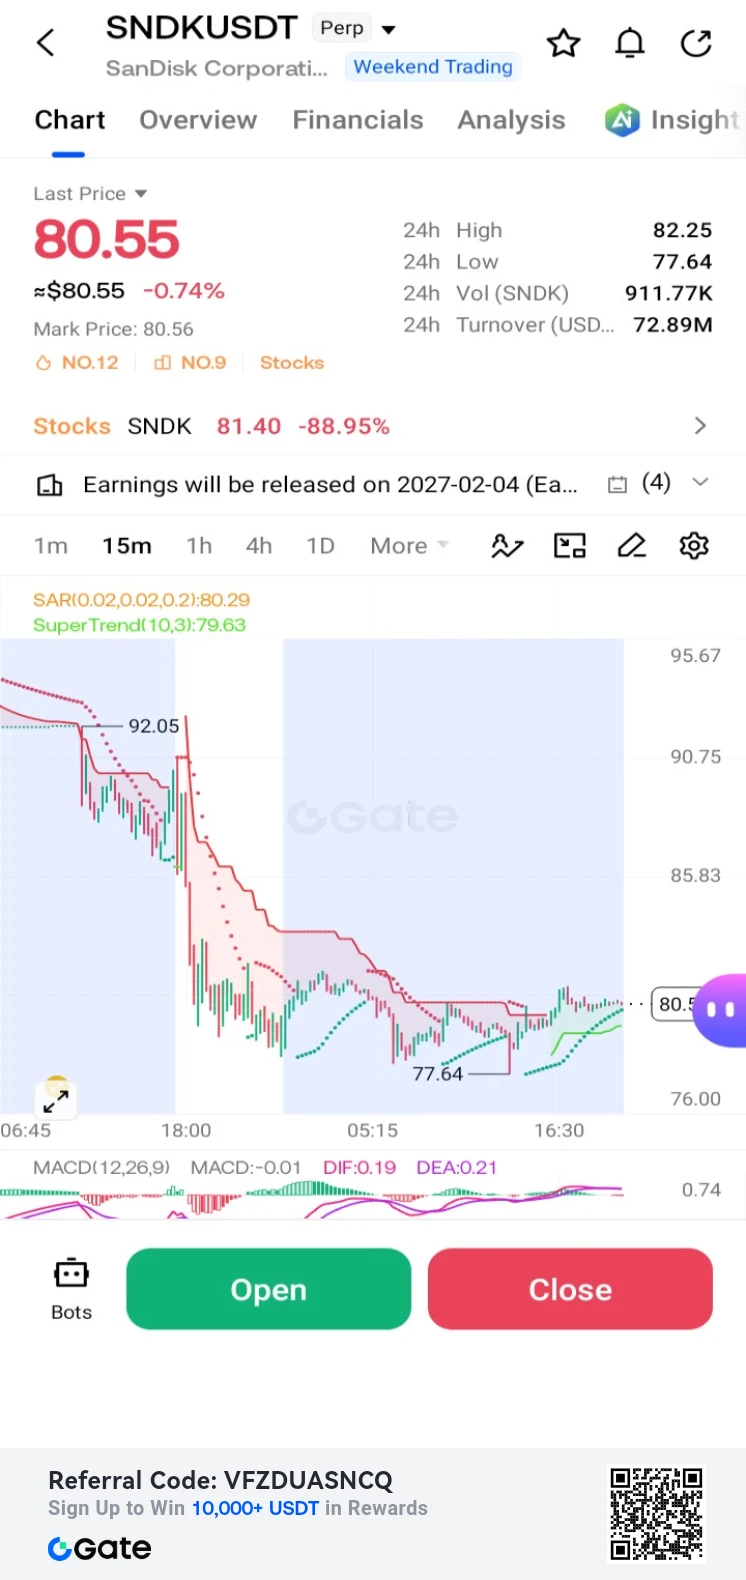
$SNDK /USDT Perp – "Bearish Consolidation – Short"**
Trading Plan Short $SNDK
Entry: 80.55
SL: 85.83
TP1: 77.64
TP2: 76.00
SNDK is down -0.74% and struggling to gain upward momentum. MACD is flat but negative; targeting a break below the 77.64 current low.
#GateDirectIPOPhase3ANTAllocates92100Shares
post-image
SNDK-0.18%
Load More

Join 40 M users in our growing community

⚡️ Join 40 M users in the crypto craze discussion

💬 Engage with your favorite top creators

👍 See what interests you

Trending Topics

BTCBreaksBelow60K

2.1M Views30.1K Discussing

BTC fell below $60,000 on November 20 for the first time since July, alongside a tech stock selloff and broader pressure on risk assets. Will $60K become resistance, or can BTC quickly reclaim it? What price or volume signals would convince you that selling pressure is easing?

GateDirectIPOPhase3ANTAllocates92100Shares

802.9K Views5K Discussing

NvidiaDropsNearly14Percent

336.1K Views7.6K Discussing

View More