Square
Following
Hot
News
Notifications
Profile
Share your thoughts
placeholder
Article
🇨🇳 HACK FUNDS LINKED TO CHINESE MONEY NETWORKS!
Bloomberg reports that Chainalysis traced parts of the stolen funds to Chinese laundering networks.
➥ $500M in $TRX spread across 1,000+ addresses.
➥ $3B reportedly frozen.
➥ $2.42B in $BTC , $ETH remains unmoved.
Recovering the funds may depend on China's cooperation!
TRX+0.42%
BTC-0.67%
ETH-1.26%
#USStocksFaceHistoricSelloff #ShareWeekly
US Stock Markets Under Massive Selling Pressure: Deep Analysis of the November 2026 Sell-Off
American stock markets are facing a massive wave of selling. Investors are rapidly selling their shares, creating strong downward pressure on stock prices. On November 5, 2026, Wall Street experienced one of its sharpest single-day declines in more than 18 months. The S&P 500 plunged approximately 4.36% (its worst day since the April 2025 “Liberation Day” tariff shock), the Dow Jones Industrial Average fell about 3.44% or roughly 1,833 points, and the tech-hea
Trenches
fxUSD
f
bade
b
fxUSD
0x08...d8f6
Market Cap
$.
Change
.
24h Vol
$.
Holders
.
ZIG
Z
bade
b
ZIG
0x8c...1145
Market Cap
$.
Change
.
24h Vol
$.
Holders
.
BTC
B
bade
b
BTC
C5xp...pump
Market Cap
$.
Change
.
24h Vol
$.
Holders
.
CORLA
C
bade
b
CORLA
0xba...7777
Market Cap
$.
Change
.
24h Vol
$.
Holders
.
STONK
S
bade
b
STONK
6GmA...UNgx
Market Cap
$.
Change
.
24h Vol
$.
Holders
.
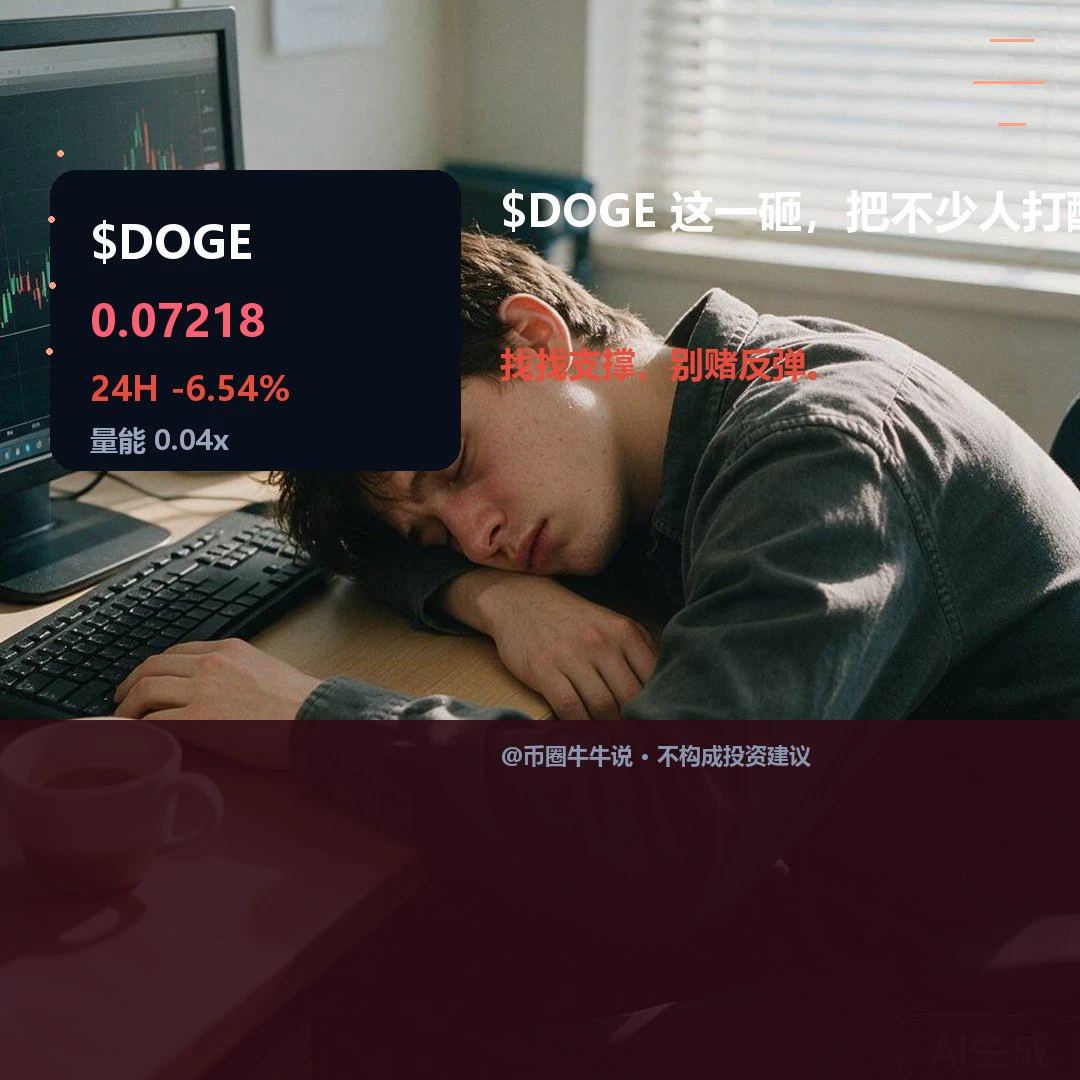
$DOGE Currently at 0.07218, down 6.54% over 24H, with an intraday range of 0.07022–0.07746. 1H is weak: RSI 28.31, and price is below EMA20 at 0.07317; 4H is weak: RSI 41.03, and price is below EMA20 at 0.07456. The 1H volume ratio is 0.04. If price holds above the 0.07717 resistance level, watch for continuation; if it breaks below the 0.07022 support level, the short-term outlook turns weaker. In the follow-up review, check whether price can hold above 0.07717 and reclaim 0.07022 after losing it. Volume is only 0.04x, so a single break needs confirmation from participation; failure to reclai
post-image
DOGE-0.22%
What Is Arbitrage Trading? Why Doesn’t a Price Difference for the Same Crypto Asset Across Different Markets Necessarily Mean There’s Risk-Free Profit?

In the cryptocurrency market, the same asset may be quoted at different prices on different exchanges, and there may also be price differences between spot and futures markets. Arbitrage trading seeks to profit from these discrepancies, but in practice, fees, slippage, transfer delays, and market volatility can all erase what looks like a sure profit.

First, what is arbitrage trading?

Arbitrage trading is a strategy that seeks to profit from
post-image
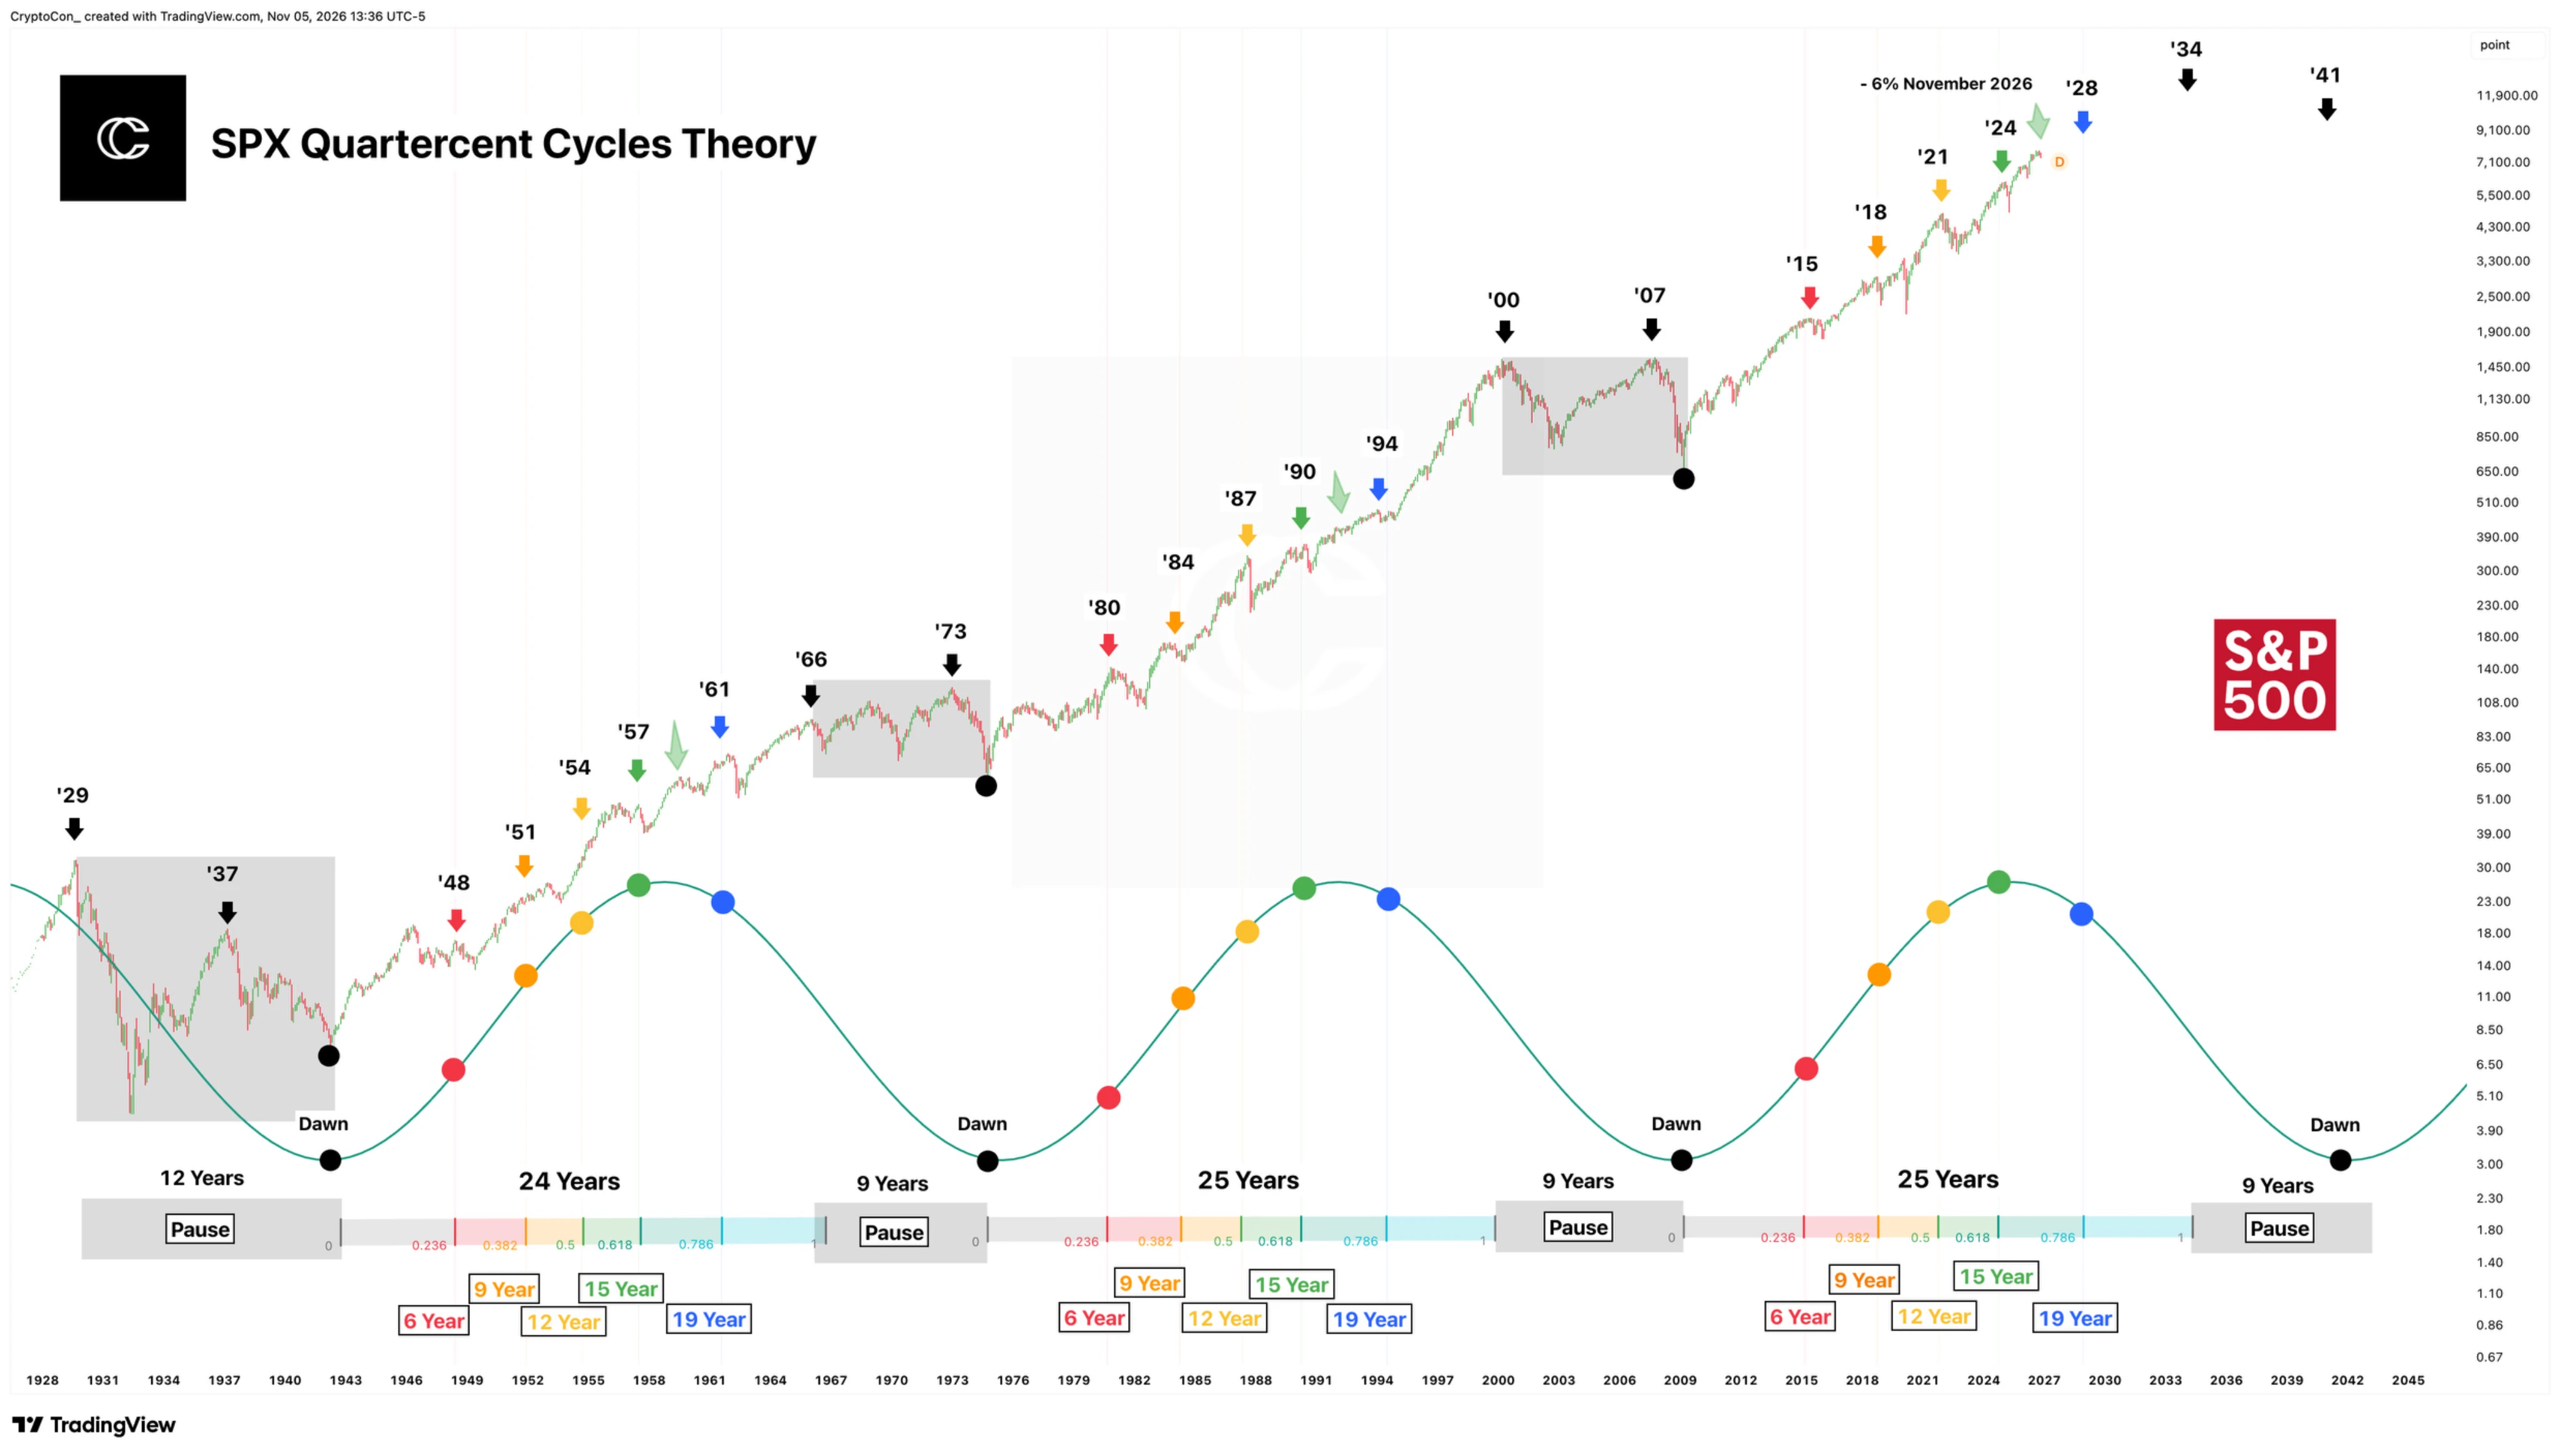
$BTC AI stocks are taking a big hit, can't have big volatility to the upside without an equal and opposite reaction.

This is hitting QQQ (the top 100 performing stocks) much harder than the S&P 500 which is so far down just 6% from the high.

The Quartercent Cycles Theory is still completely on track. The next important high is not until 2028.

And I'm sure plenty of people envision a full-blown AI collapse and stock market implosion, but things will recover.

Bitcoin's bear market is finally nearing its end in time (just a few more months), SPX is in a temporary slump en route to its next hi
post-image
BTC-0.67%
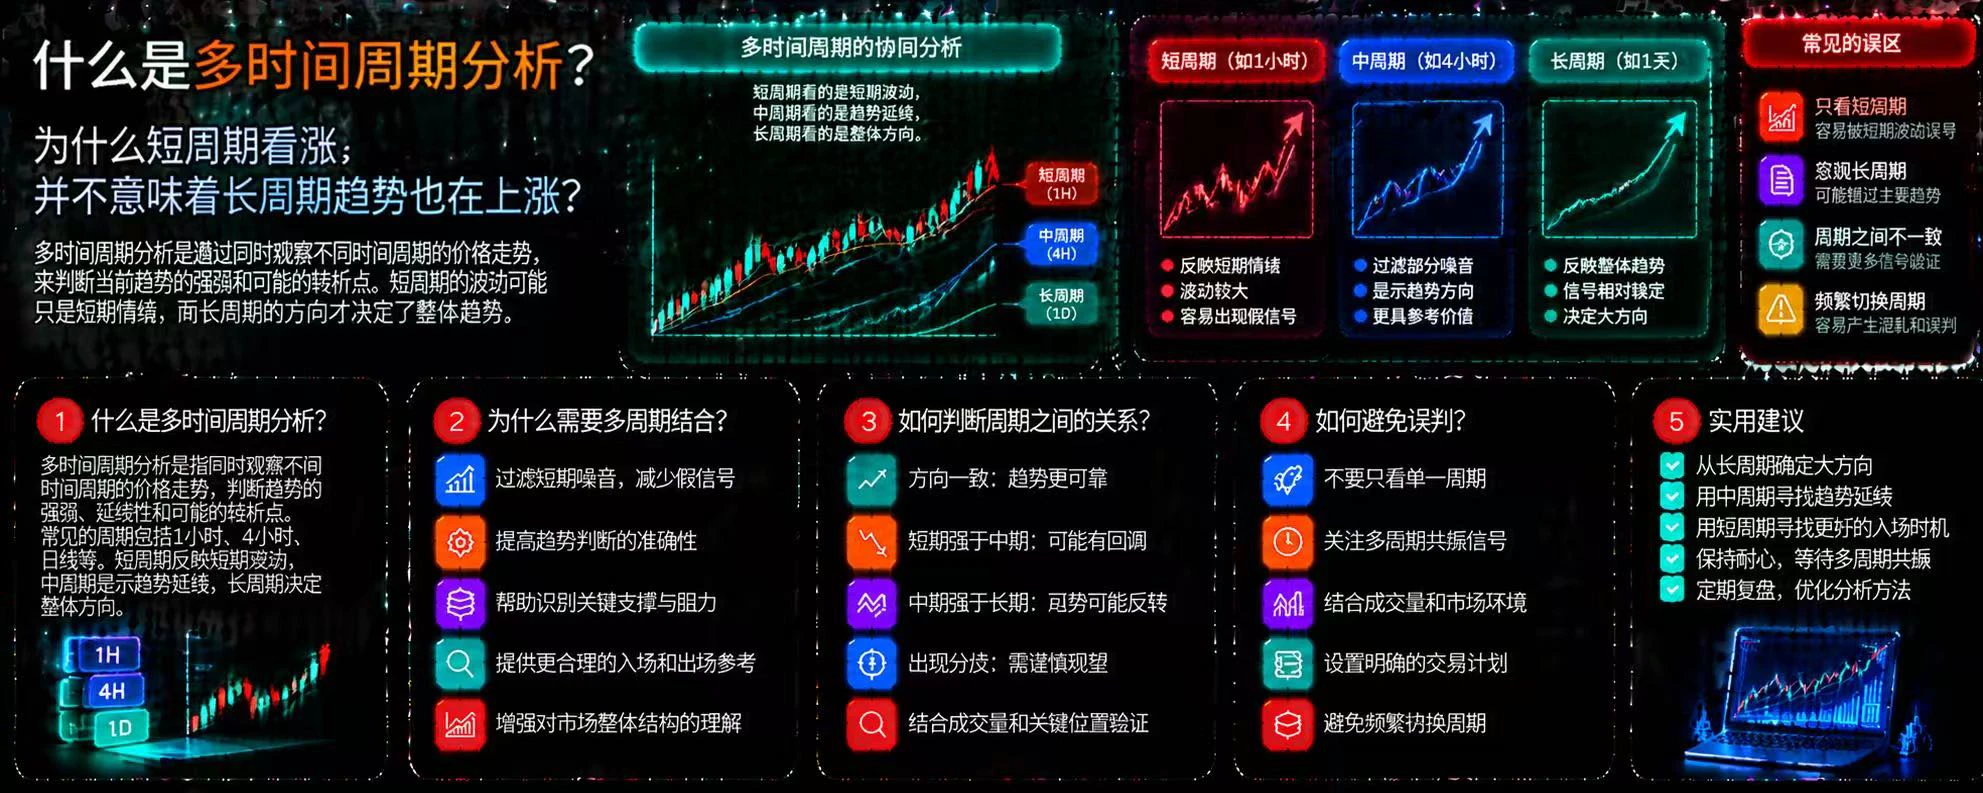
What Is Multi-Timeframe Analysis? Why Doesn't a Bullish Short Timeframe Mean the Long-Term Trend Is Also Rising?

In cryptocurrency trading, the same asset can show completely different price movements across different timeframes. The 15-minute chart may be rising, while the 4-hour chart remains in a downtrend, and the daily chart may show the market moving sideways. Looking at just one timeframe can easily lead you to mistake a brief rebound for a trend reversal.

First, what is multi-timeframe analysis?

Multi-timeframe analysis means observing price movements across different timeframes at
post-image
$AIN A perfect, extremely reliable signal—as I warned all of you long ago. 👇
post-image
AIN+3.85%
🔐 Blacklists, whitelists, transfer pauses, and transaction limits: What exactly is the difference?

In the previous two articles, we discussed why digital assets may be restricted, and how to investigate using blockchain explorers, transaction records, contract source code, and permission settings.

Today, we’ll take a closer look.

Suppose you open a token contract and find features such as address management, transfer pausing, or transaction limits. What do these features actually mean? How might they affect ordinary users? And how should we assess their actual risks?

First, it is importan
post-image
#USStocksFaceHistoricSelloff
$HYPE : Wall Street Access Could Be the Next Big Chapter for Hyperliquid.

Hyperliquid is moving closer to a major milestone in US crypto markets.

Hyperliquid Strategies, the Nasdaq-listed company holding approximately 38.9 million HYPE tokens, has filed an application through its subsidiary to become a Futures Commission Merchant (FCM).

Why does this matter?

If regulators approve the application and the required permissioned markets receive approval, the company could help US customers access perpetual futures markets built on Hyperliquid through a regulated st
HYPE+0.24%
🔹Democrats Sweep Both Chambers of Congress as the Dow Surges Over 3! But AI Stocks F
live-cover
LIVE2,030
Bitcoin Market Trends
live-cover
LIVE1,191
Stop-Loss Distance, Position Size, and Maximum Loss: How Do You Calculate the True Risk of a Trade?

When opening a position, many traders first consider three questions:

What is the current price of BTC?

Is it likely to go up or down next?

How much leverage should I use?

But there is another question that is more worth answering in advance than any of these:

If this trade goes wrong, how much am I prepared to lose at most?

If you don't have a clear answer, then even if you know where to enter and where to place your stop-loss, you could still take on losses beyond your expectations beca
post-image
BTC-0.65%
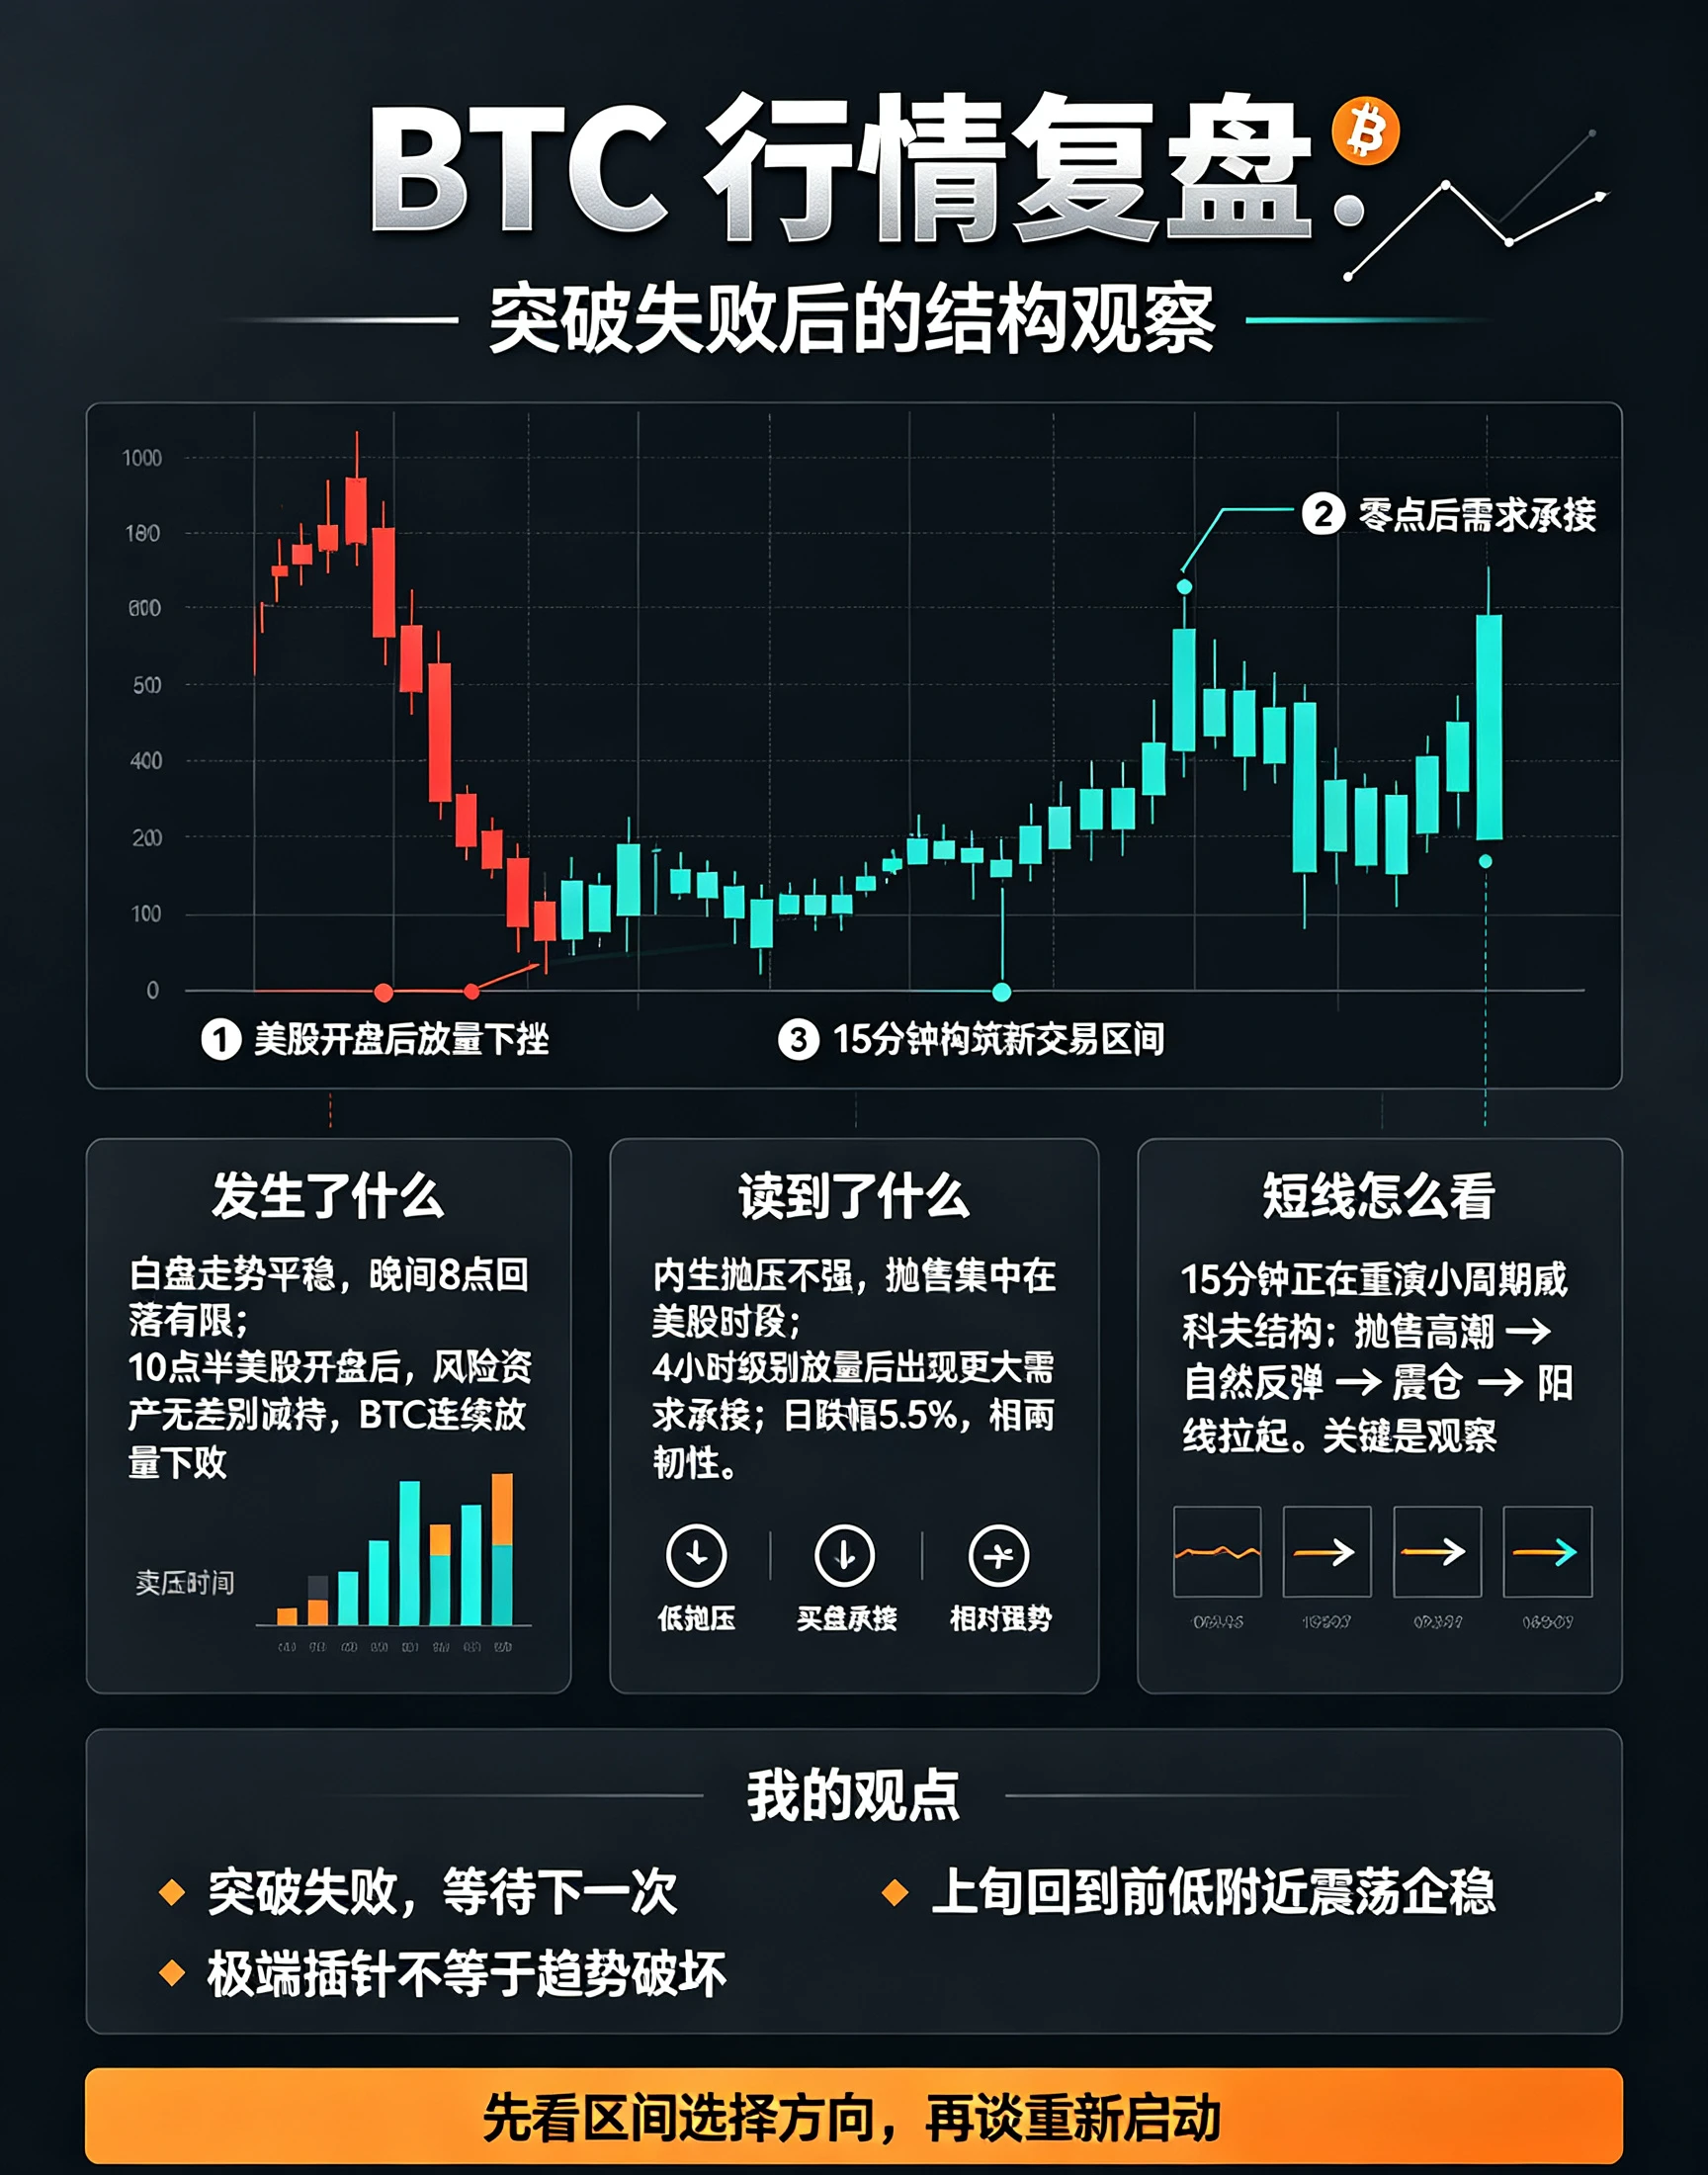
BTC traded steadily during the day yesterday, then saw a sharp pullback at 8 pm, though volume was limited. It was not until U.S. stocks opened at 10:30 pm that the market turned sharply lower, with successive high-volume declines and a concentrated wave of selling. The price fell through the two support levels previously anticipated, one after the other, signaling the failure of this breakout attempt.
The decline also sent several clear signals. First, endogenous selling pressure within crypto was not significant: the market was largely unaffected during non-U.S. trading hours, with selling c
post-image
BTC-0.65%
A heartbreaking drop? Don’t rush—take a look at this on-chain data first.
An ancient OG who got 1 million $ET through an ICO back in 2015 has been buying up crypto on-chain again over the past 8 hours—snapping up 2,221 ETH in one go for $4.99 million, at an average price of $2,248.

This veteran’s on-chain address currently holds over 122,000 ETH, worth more than $272 million at current prices.
While others are fearful, they’re greedy. Whales’ moves are often more convincing than the candlestick chart.
Risk warning: The above is solely an observation of on-chain data and does not constitute an
post-image
ETH-1.26%
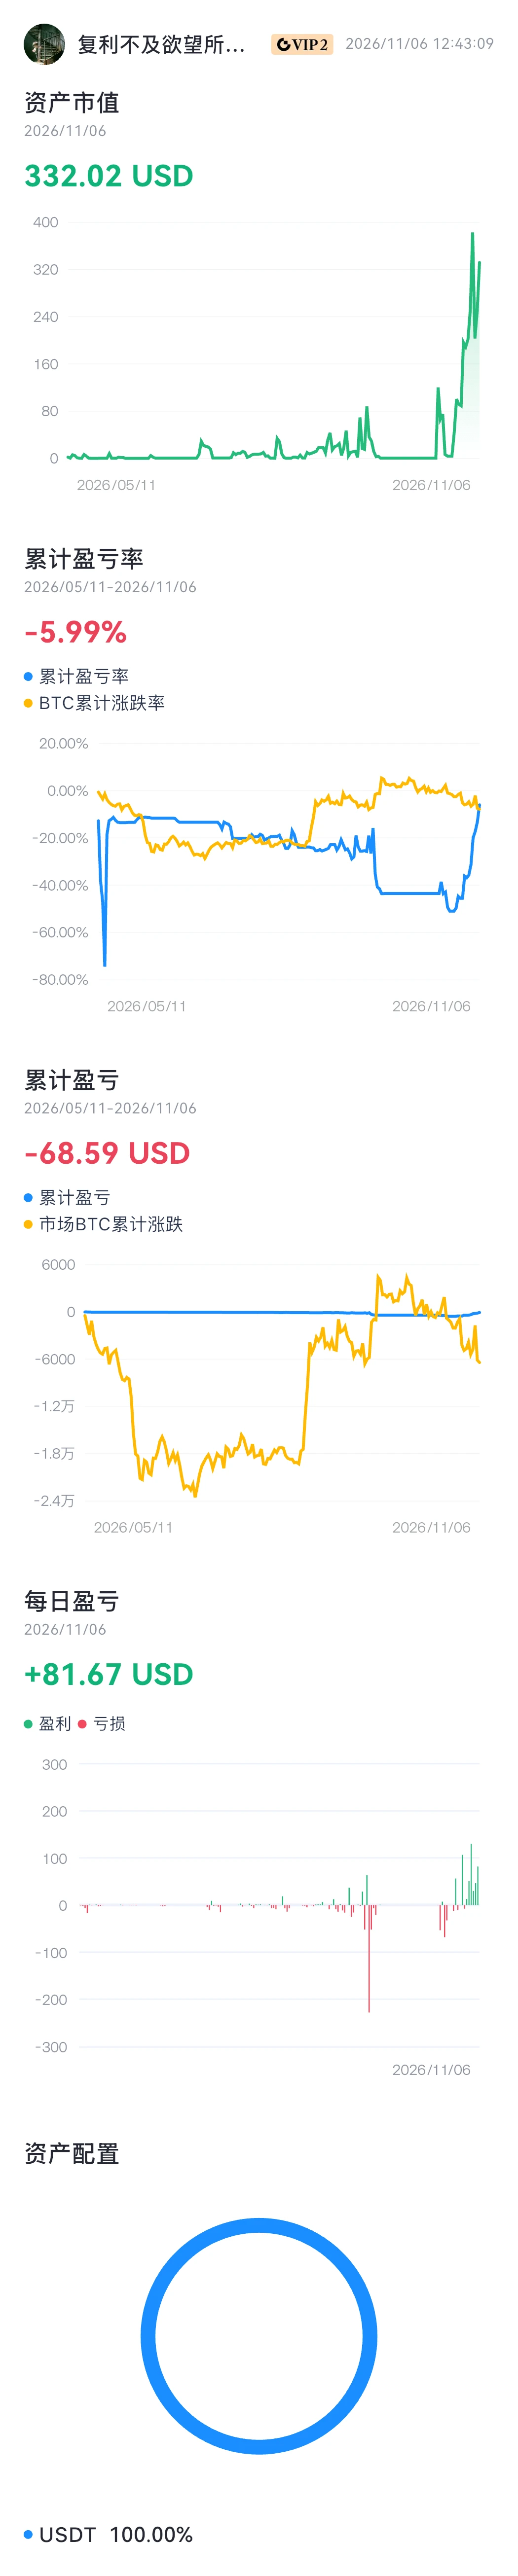
#资产分析 https://www.gate.com/wallet/assetsAnalysis
Breaking even and turning things around are just around the corner. The right timing, favorable conditions, and support are all indispensable. Starting copy-trading mode is truly a poor strategy! With no other choice, we’ll wait until the day we soar and see the light!
post-image
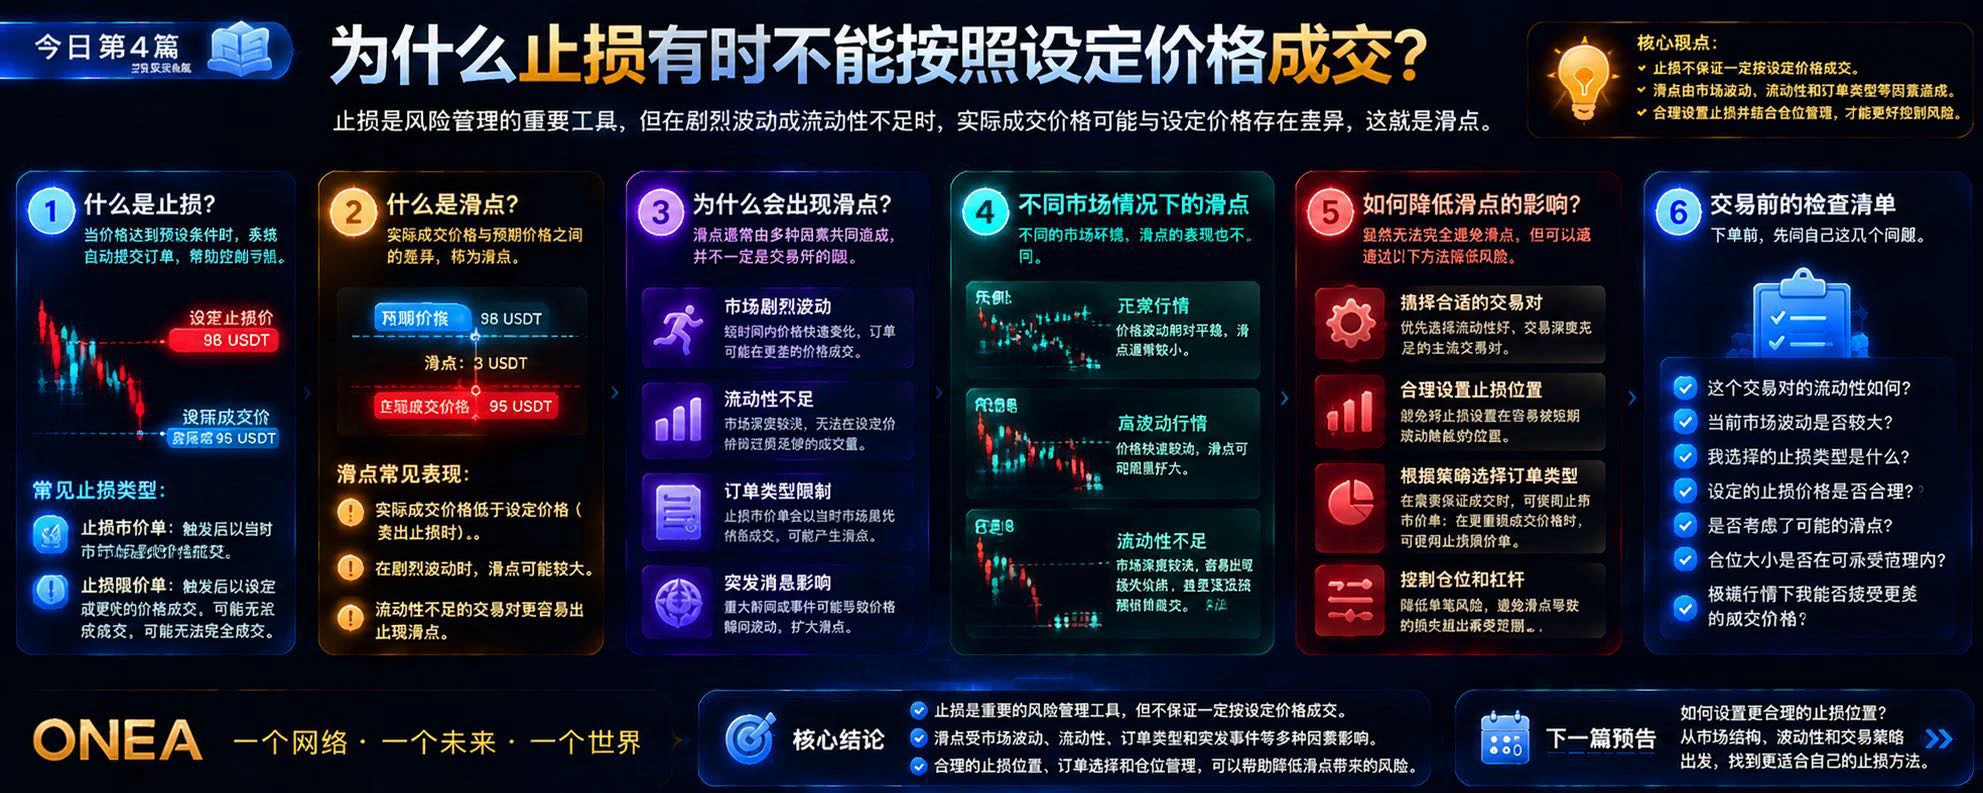
Why Don’t Stop-Loss Orders Always Execute at the Set Price? These Are the Factors That Really Affect the Outcome

In crypto futures trading, there is one situation that can be especially frustrating:

You set a stop-loss before opening a position. The market suddenly reverses, and when the order executes, you find that the actual execution price is worse than the price you set.

The first thing many people think is: Is the exchange having a problem? Did the stop-loss fail?

In reality, stop-loss triggering, order execution, and the final execution price are three separate concepts that need to
post-image
#SK海力士跌近7% #ShareWeekly
SK Hynix Shares Drop Nearly 7%: What Is Behind the Sudden Decline?
The global technology and semiconductor markets are attracting attention as SK Hynix shares experience a sharp decline of nearly 7%. This movement has raised questions among investors about the strength of the semiconductor sector, AI-related demand, and the possibility of changing market sentiment.
SK Hynix is one of the world's major memory chip manufacturers and plays an important role in the artificial intelligence ecosystem, particularly through its High Bandwidth Memory (HBM) products.
1. Why Is SK
SK Hynix-8.78%
SKHY-13.76%
SKHYV-0.98%
  • 1
Does this kind of cake really have any meaning?
post-image
Load More

Join 40 M users in our growing community

⚡️ Join 40 M users in the crypto craze discussion

💬 Engage with your favorite top creators

👍 See what interests you

Trending Topics

USStocksFaceHistoricSelloff

987 Views3.49k Discussing

U.S. stocks suffered a sharp selloff on Thursday, with the Nasdaq closing down more than 5% and the Philadelphia Semiconductor Index falling over 12%. AI and chip stocks including $NVDA and $AMD were hit especially hard. Markets are reassessing AI valuations, data-center spending and future returns. Is this just short-term deleveraging, or the start of a deeper correction in the AI trade? Which sectors are you watching next?

GateLaunchesPoSECProofOfSecurity

12.01k Views573 Discussing

USNonfarmPayrolls

9.34k Views3.99k Discussing

View More