






Square
Following
Hot
News
Notifications
Profile
Share your thoughts
placeholder
Article
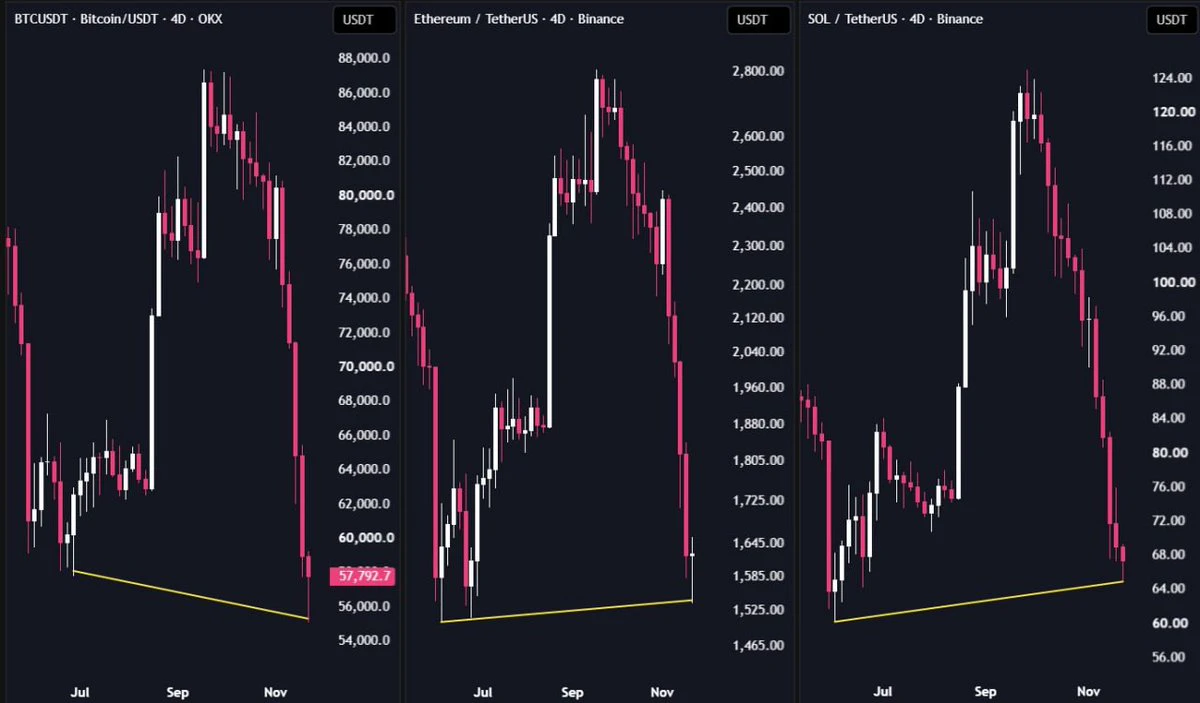
Bitcoin made a new cycle low, but Ethereum and Solana didn't
Quite Interesting
post-image
BTC-0.67%
ETH-1.26%
SOL-0.77%
  • 1
Bitcoin Below $57K: The Real Test Is Demand, Not Price.

$BTC has fallen more than 50% from its October 2025 ATH above $126K, briefly breaking below $57K.

The sell-off is backed by serious numbers: nearly $2B in leveraged liquidations within 24 hours, including $650M in just one hour. Meanwhile, BlackRock's IBIT recorded its largest-ever daily outflow of $541M on November 19.

But here's what matters: liquidations explain how quickly prices fall; ETF outflows raise questions about who is still willing to buy.

The next levels are critical. $55.5K is immediate downside support, while $60K
BTC-0.67%
IBIT-5.97%
Trenches
FIONA
F
bade
b
FIONA
B34n...pump
Market Cap
$.
Change
.
24h Vol
$.
Holders
.
PIEVERSE
P
bade
b
PIEVERSE
0x0e...25a9
Market Cap
$.
Change
.
24h Vol
$.
Holders
.
mihao
m
bade
b
mihao
4Cxj...pump
Market Cap
$.
Change
.
24h Vol
$.
Holders
.
CLAUDIA
C
bade
b
CLAUDIA
2j5S...W2ZM
Market Cap
$.
Change
.
24h Vol
$.
Holders
.
IDOL
I
bade
b
IDOL
0x3b...ab07
Market Cap
$.
Change
.
24h Vol
$.
Holders
.
The sky is so blue today. Trade your positions less and go for a walk.
post-image
BTC Falls Below 58,000 USDT, Down 7.75 in 24 Hours
live-cover
LIVE6,724
ETH-1.26%
BTC-0.67%
SOL-0.77%
ZEC+1.16%
HYPE+0.24%
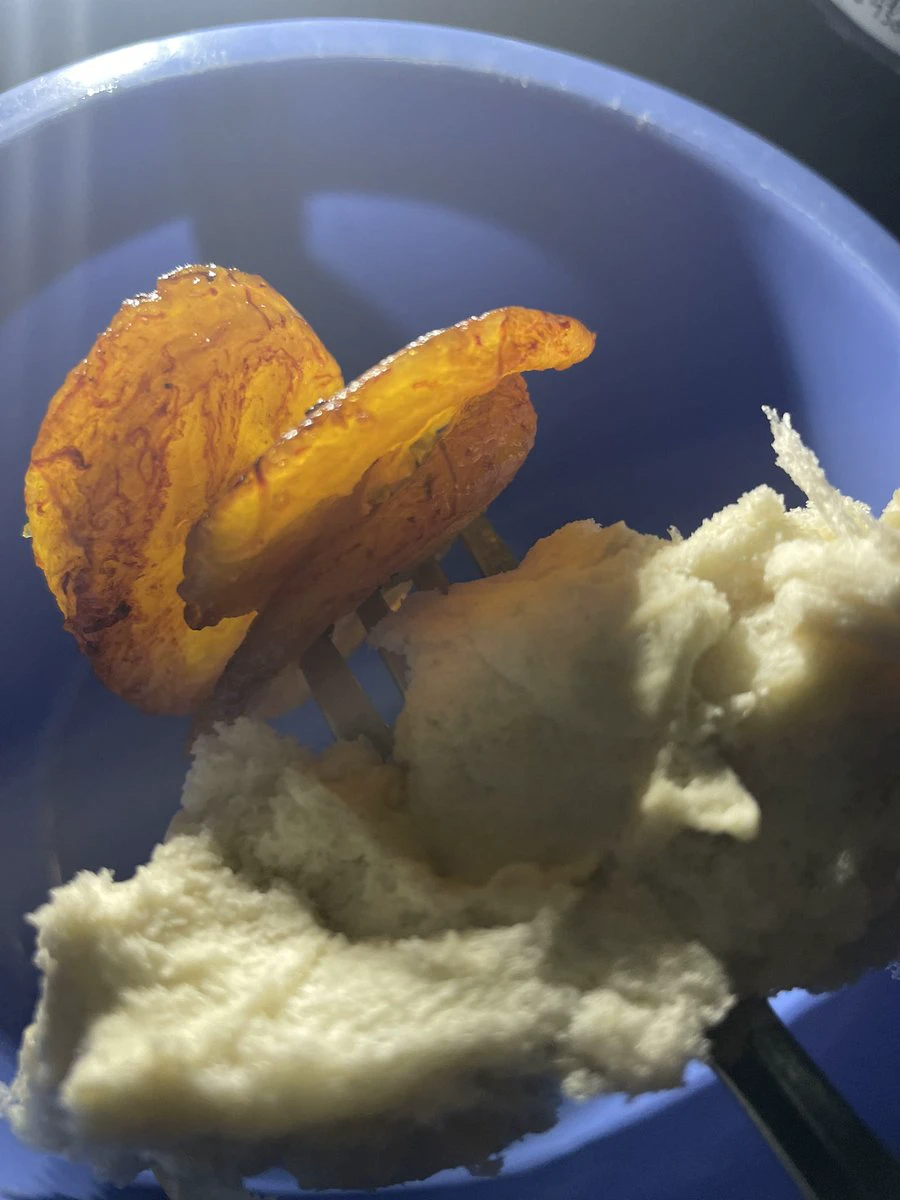
My new combo 😂
Have u tried Bread with plantain before ?
😂🤪🤪🤪
post-image
  • 1
Have you ever heard of cryptocurrency token burning?
Token burning is the process of permanently removing tokens from circulation, usually by sending them to an address where they cannot be spent.
Some projects use this mechanism to manage token supply.
However, burning tokens does not automatically increase their market price.
Demand, utility, market conditions, and the remaining supply still matter.
Understanding token burns helps you look beyond crypto headlines.
#Crypto #TokenBurning #Blockchain #Web3
post-image
B TC market up dates
live-cover
LIVE2,562
BTC-0.67%
ETH-1.26%
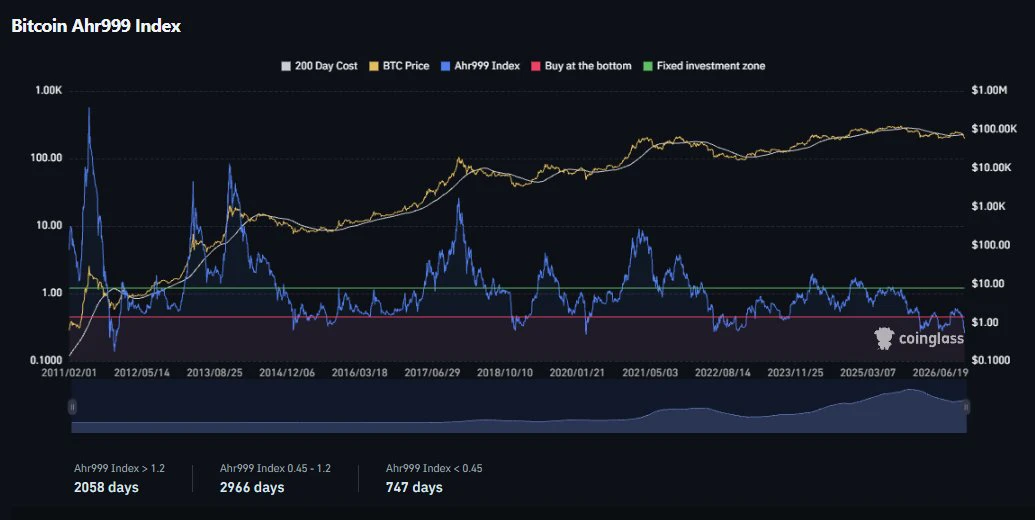
Bitcoin's Ahr999 bottom indicator just printed 0.258. Lowest reading of the year.
It has only gone under 0.3 a handful of times.
2018 bear market bottom. 2020 COVID crash. 2022 FTX collapse.
Every one of those felt like the end at the time, right?
One indicator doesn't call a bottom on its own, and in 2018 it kept sliding to 0.24 before it turned.
post-image
BTC-0.67%
  • 1
Daily Quote | Unrealized gains are borrowed from the market; only closing your position makes them yours.
The numbers in your account are only temporarily parked with you until you close your position. Many people have made profits, but after earning, they think they can make even more—and end up giving back even their principal.
post-image
  • 1
  • 2
$XAGUSD ‌
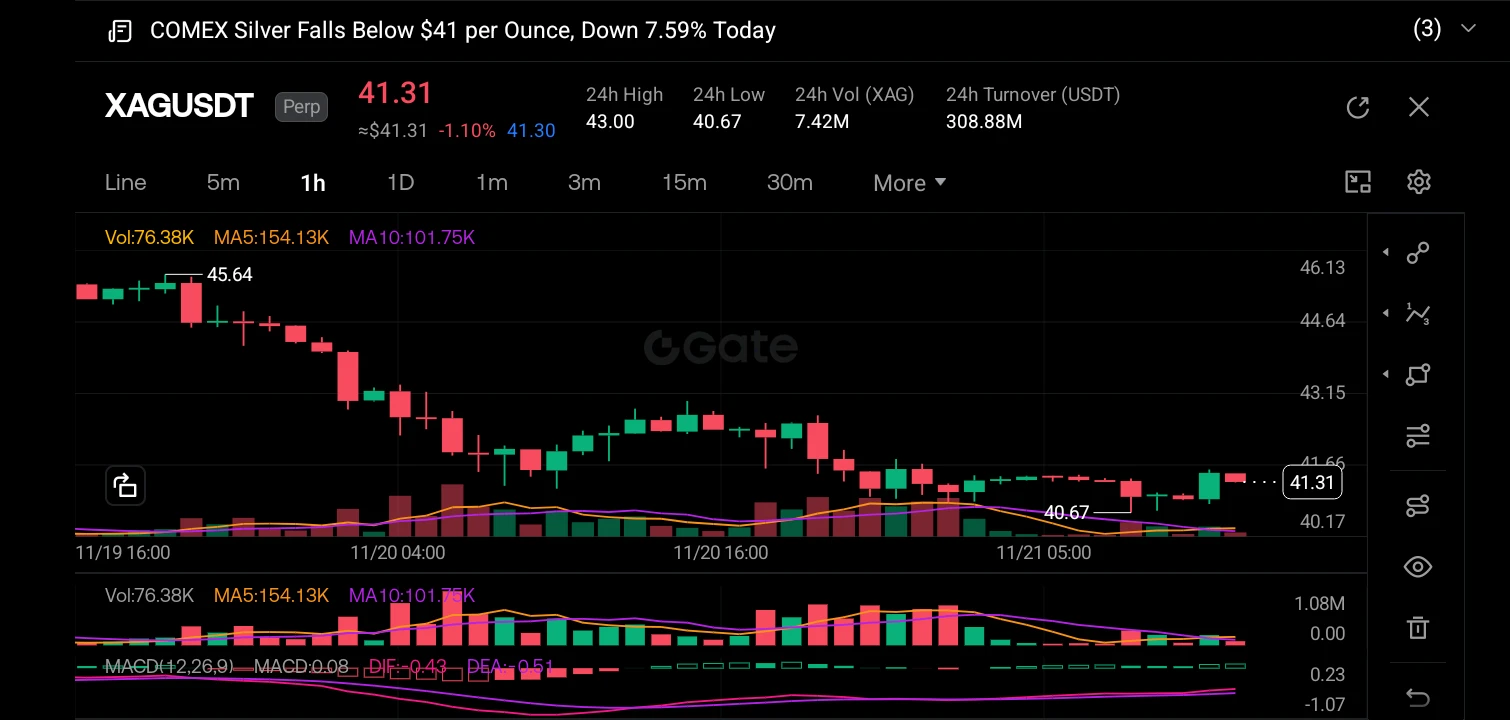
A trading style blending technical analysis with on-chain data is particularly potent when observing whale accumulation. While technicals can show you when a price is consolidating, whale accumulation data tells you why it might soon break out. By tracking large wallet inflows and outflows alongside chart patterns (such as the current MACD convergence on the XAGUSDT chart), traders can distinguish between a retail-driven fake-out and institutional accumulation. This approach allows you to position early alongside "smart money" while using technical levels to define strict invalidati
post-image
XAGUSD-3.80%
  • 1
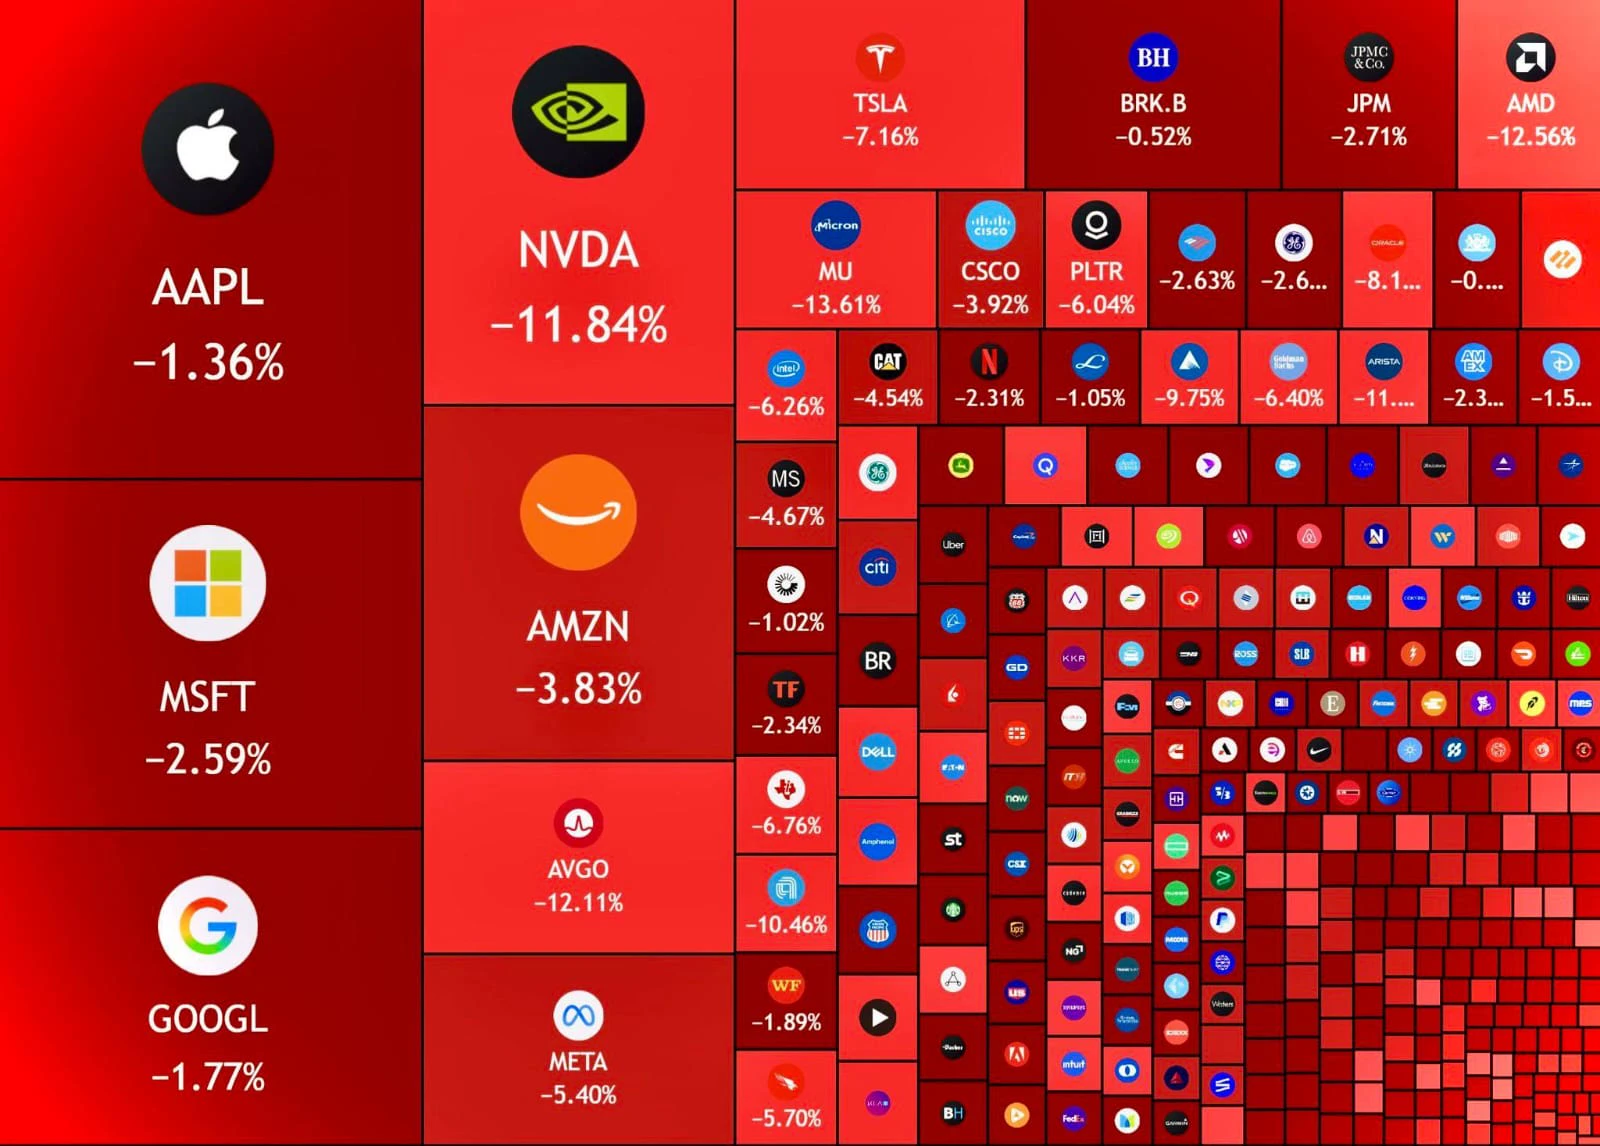
BREAKING: 🇺🇸 The US stock market has lost $8.9 trillion over the past 45 days.

The US stock market lost $2.5 trillion today.

$NVDA $AAPL $ANT $MU $QCOM #BTCBreaksBelow60K #GateDirectIPOPhase3ANTAllocates92100Shares #NvidiaDropsNearly14Percent #CookBacksFurtherRateHikes #GoldNears3500
post-image
NVDA-13.84%
AAPL-1.83%
ANT-8.68%
MU-13.88%
QCOM+0.28%
#BTCBreaksBelow60K

BITCOIN BELOW $60,000: THE MARKET IS TESTING WHO IS STILL WILLING TO BUY

📊 BEFORE VS. NOW: WHAT HAS CHANGED?

Before November 20, Bitcoin was trading above the psychologically important $60,000 mark. That level represented more than a round number. It was also a point where market participants could measure confidence, demand and the strength of the ongoing recovery.

Now, the situation is different. Bitcoin has fallen below $60,000 for the first time since July, bringing a new challenge for buyers. The November 20 decline happened alongside weakness in technology stocks
post-image
BTC-0.67%
  • 2
📉 BTC fell below $60,000—can it rebound this weekend?

On November 20, BTC briefly fell below $60,000, hitting its lowest level since July. Tech stocks also came under pressure, and selling sentiment continued to intensify.

The market had been discussing whether $60,000 could hold. Now the question is: after breaking below it, can BTC quickly reclaim that level? 👀

🔮 Weekend market predictions are live!

📈 Bullish camp: Quickly reclaim $60,000

📉 Bearish camp: Continue lower and search for new support

💬 Do you think BTC will reclaim $60,000 first, or fall further first?

Leave your pre
GateSquare
📉 BTC fell below $60,000—can it rebound this weekend?
On November 20, BTC briefly fell below $60,000, hitting its lowest level since July. Tech stocks also came under pressure, and selling sentiment continued to intensify.
The market had been discussing whether $60,000 could hold. Now the question is: after breaking below it, can BTC quickly reclaim that level? 👀
🔮 Weekend market predictions are live!
📈 Bullish camp: Quickly reclaim $60,000
📉 Bearish camp: Continue lower and search for new support
💬 Do you think BTC will reclaim $60,000 first, or fall further first?
Leave your prediction + a key price level in the comments, and we’ll review it together next week!
#BTC跌破6万美元关口

repost-content-media
BTC-0.67%
🩸 Stocks are CRASHING.
🩸 Crypto is CRASHING.
🩸 Gold is CRASHING.
🩸 Silver is CRASHING.
🩸 Copper is CRASHING.
🩸 Oil is CRASHING.

when was the LAST time everything fell together, and what happened NEXT? Is a BIGGER CRASH coming?

#ShareWeekly
#BTCBreaksBelow60K

$BTC ‌$ETH ‌$XRP ‌
BTC-0.67%
ETH-1.26%
XRP-1.12%
EVAA | Long 🟢 | Bullish | 15m | 24-hour change: +21.09% | Volume: 451.7M USDT. Long rationale: Price is above EMA200; EMA20/50/200 are in bullish alignment; RSI14 is 69.0; MACD histogram is positive; ADX14 is 19.9; volume is 1.21 times the 20-candle average; breakout from the 20-candle range. Entry price: 6.5932. Stop-loss: 5.93801. Take-profit 1: 7.41218 | Take-profit 2: 7.90357 | Take-profit 3: 8.55876. Entry price is for reference only; do not chase the rally. The strategy is invalidated if the stop-loss level is hit. Technical analysis only; this is not investment advice. $EVAA
post-image
EVAA-0.49%
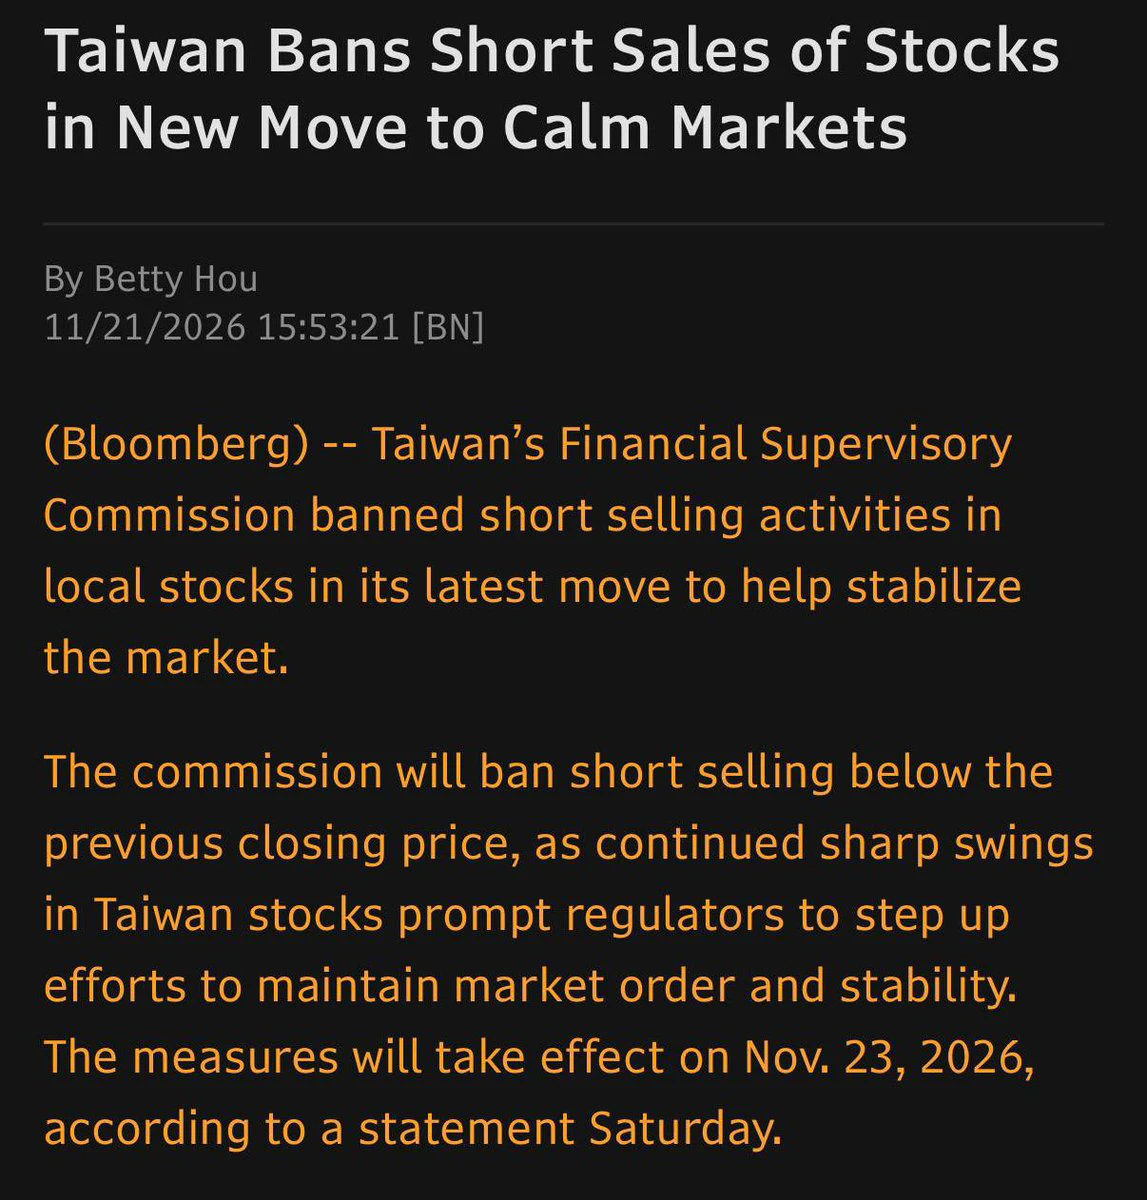
Lol Taiwan is banning all short selling.
post-image
This candle came from Eagle's close-out... at 1x, and the position wasn't even fully closed. The impact is really too great now
However, our average entry price will be a bit better than Eagle's. Even with slippage, it's about the same overall. One really tricky issue is that the instant price swings when Eagle closes altcoin positions are too large. Sometimes setting the closing delay very low actually leads to more slippage... but we can't set it too high either
If you're concerned, you can manually take profit on part of your position when you see an altcoin~ I'm still continuously optimizi
post-image
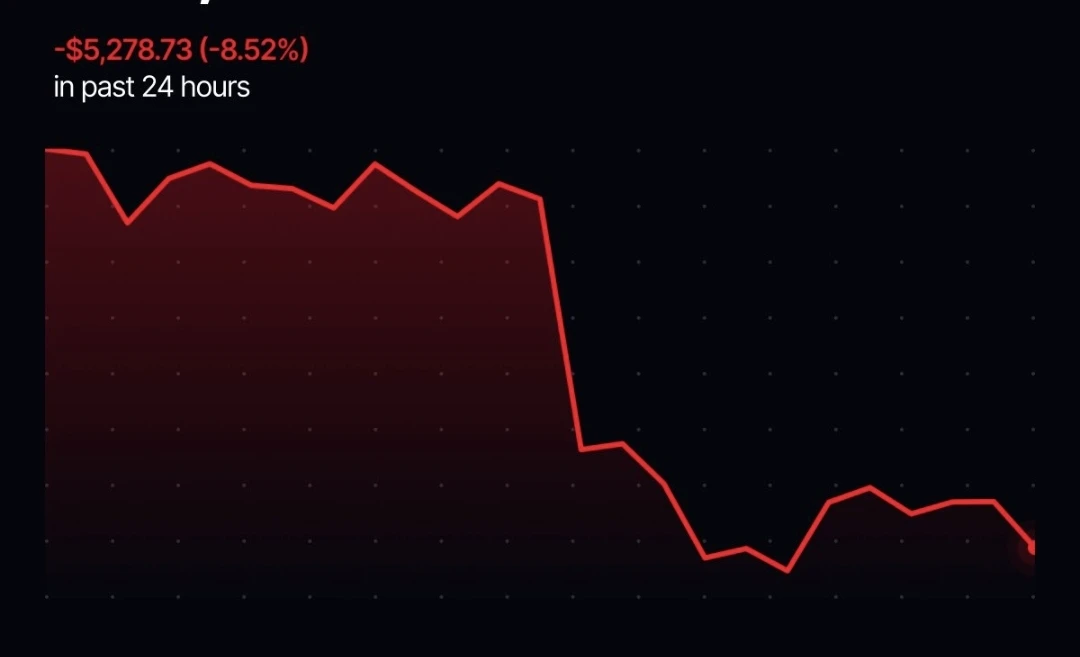
🚨 BREAKING: Bitcoin falls to its lowest level in over two years.

$BTC is down 8.52% over the last 24 hours as selling pressure intensifies across crypto.

Tech-stock losses, ETF outflows and leveraged liquidations continue to weigh on the market.

#ShareWeekly
#BTCBreaksBelow60K

$BTC ‌
post-image
BTC-0.67%
  • 1
Lucia and Jason at the highest body fat percentage in GTA 6
Still gotta build lean muscle, guys.
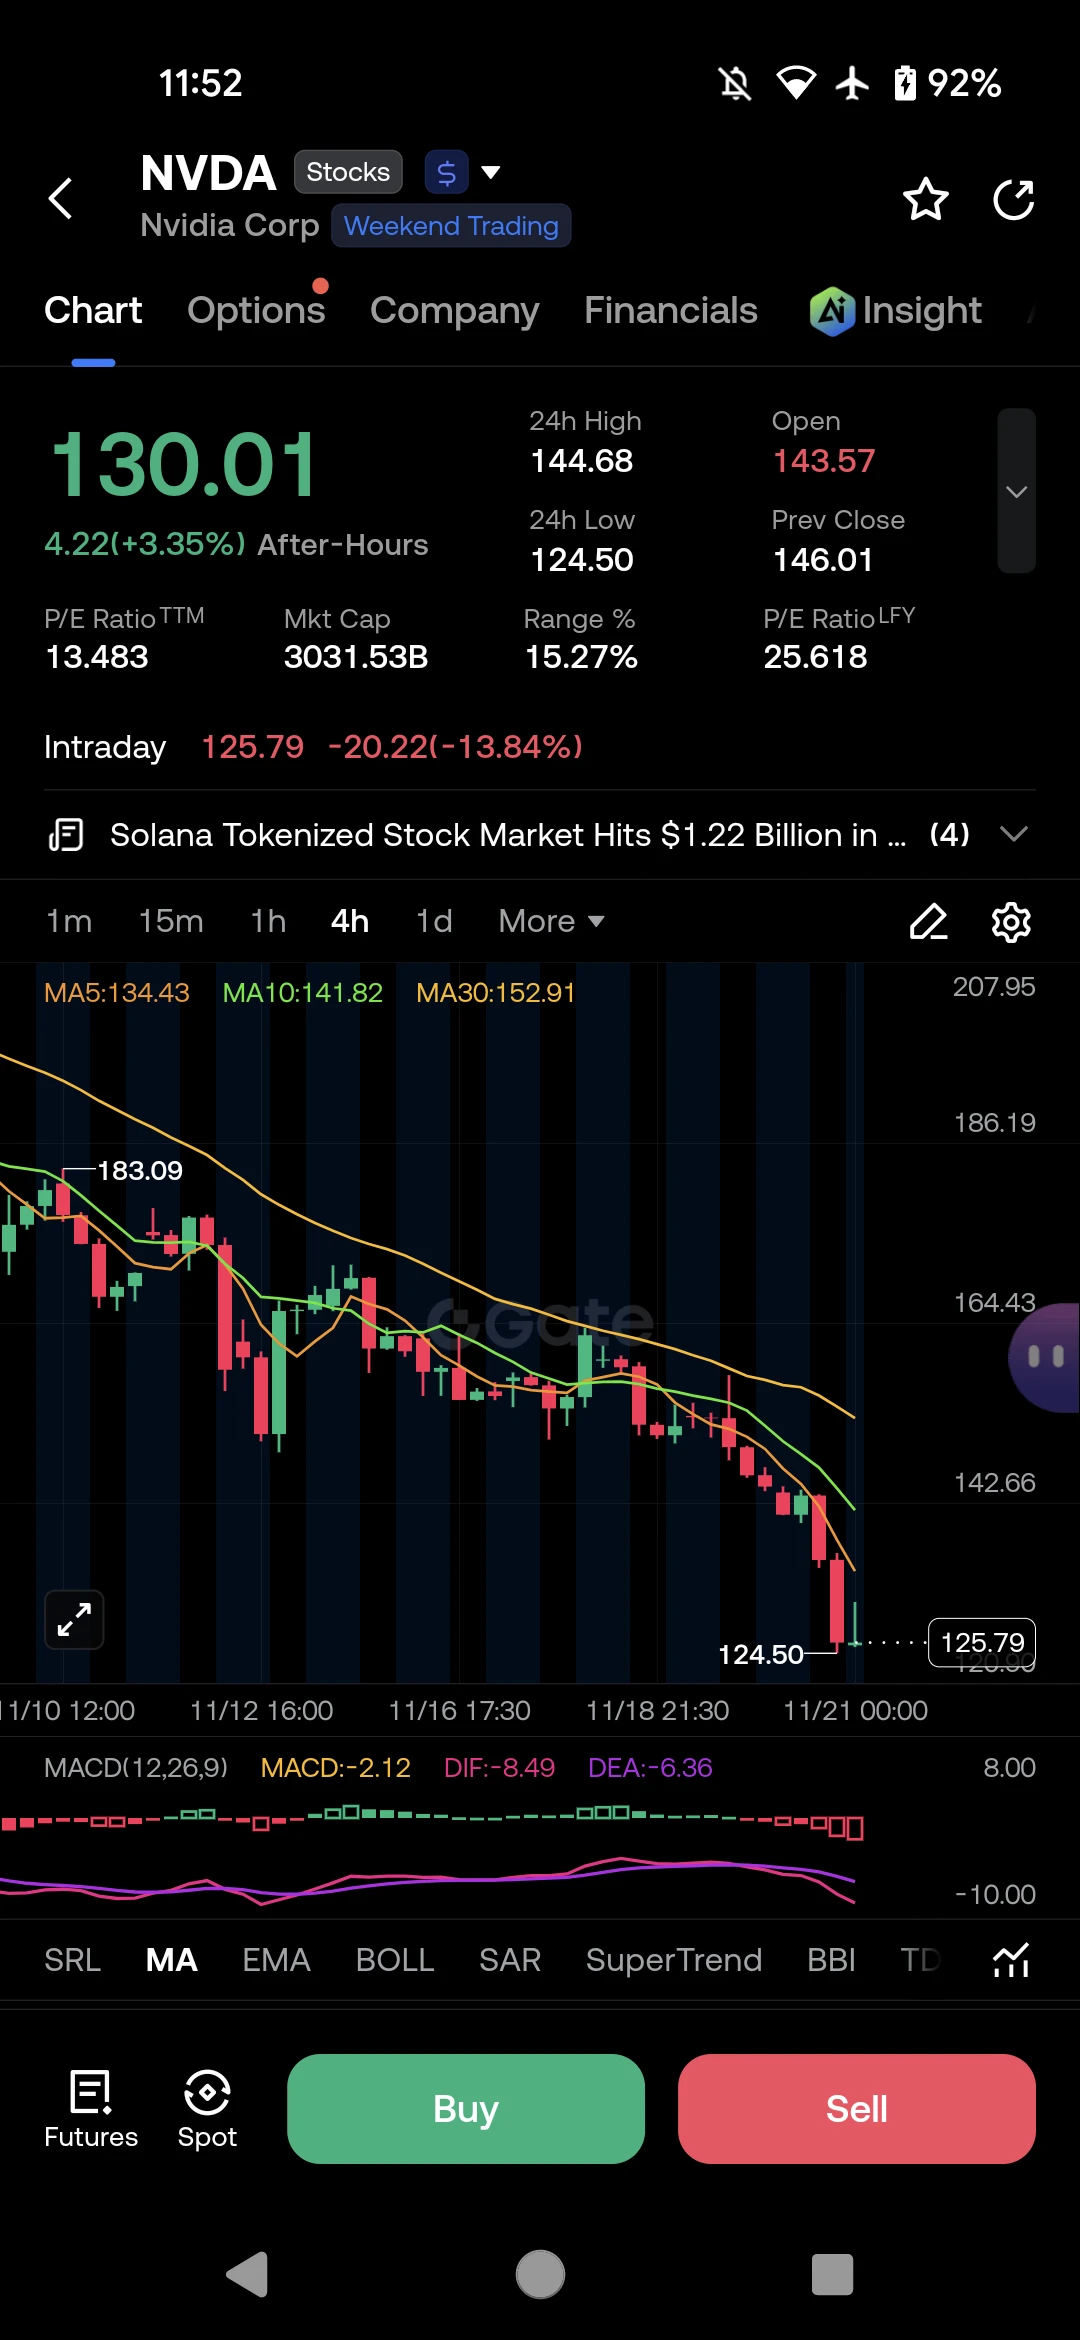
$NVDA ‌ Bleeds: Is the AI King Cracking?"

Nvidia is taking a massive hit today! The stock plunged intraday by nearly 14%, dropping from $146 to a low of $124.50. This is a bloodbath for the AI leader.

Let us look at the technical damage on the chart:

· The Trend: A clear and violent breakdown.
· Moving Averages: Price is completely destroyed below the MA5 (134.43), MA10 (141.82), and MA30 (152.91).
· MACD: Deep in the red at -2.12, showing strong bearish momentum.

My Strategy:
I am NOT trying to catch this falling knife just yet. $124.50 is the immediate support. The after-hours are showi
post-image
NVDA-13.84%
Load More

Join 40 M users in our growing community

⚡️ Join 40 M users in the crypto craze discussion

💬 Engage with your favorite top creators

👍 See what interests you

Trending Topics

BTCBreaksBelow60K

2.1M Views29.3K Discussing

BTC fell below $60,000 on November 20 for the first time since July, alongside a tech stock selloff and broader pressure on risk assets. Will $60K become resistance, or can BTC quickly reclaim it? What price or volume signals would convince you that selling pressure is easing?

GateDirectIPOPhase3ANTAllocates92100Shares

746.9K Views4.8K Discussing

NvidiaDropsNearly14Percent

313.5K Views7.5K Discussing

View More