Share your thoughts
placeholder
Article
#BTCBreaks82K
#WeeklyShare #GateSquareMidAutumnReunion $BTC $ETH
BTC Just Reclaimed Its 50-Week Moving Average, Here's Why That Actually Matters
Bitcoin closed the week at 81,159 on Coinbase, its first weekly close above the 50-week moving average in more than 10 months, with that average currently sitting around 78,700 to 78,788 depending on the source. Live data has BTC trading around 81,480, up 1.19 percent on the day, after touching highs near 82,090. This isn't a small technical footnote, Galaxy Research's Alex Thorn has been specific that what matters here isn't just poking above the
BTC+1.40%
ETH+3.46%
  • 2
BTC MARKET UPDATES
live-cover
LIVE1,456
blockstack:native stacking the deck for a more advantageous position
post-image
#BTC突破81K #Gate广场中秋团圆局 BTC back above $81,000: continue advancing or consolidate at highs?

The bias is bullish, but the most likely pattern is “surge—pullback—advance again”; the probability of breaking through in one straight move with a sharp volume increase is low. The true breakout confirmation level is $82,800 (closing above it for two consecutive days); before confirmation, treat it as “high-level consolidation.” After confirmation, the next targets are $84,000–$86,000, with room to open toward $90,000 once it holds.

Reasons it can continue rising (bullish logic)
1. Shorts have alre
post-image
ThisIsTranslateContent:
#BTC突破81K #Gate广场中秋团圆局 BTC returns to 81,000: continue higher or digest at the highs?

The bias is bullish, but the likely rhythm is “surge—pullback—attack again”; the probability of a direct, high-volume breakout is low. The real breakout confirmation level is 82,800 (a close above it for two consecutive days); before confirmation, treat it as “high-level consolidation,” and after confirmation, look for 84,000–86,000 next, with 90,000 becoming possible once it holds.

Reasons it can still move higher (bullish logic)
1. Short positions have already been flushed out to some extent: BTC rebounded from 76,000 to above 81,000 on September 18, with approximately $470 million in short positions liquidated over 24 hours, easing overhead selling pressure; perpetual funding rates have shifted from negative to neutral, and short pressure has been clearly released.
​2. Macroeconomic “bad news is priced in”: the Fed’s rate hike has been implemented, while expectations of easing tensions in Iran have boosted risk appetite; although BTC ETF funds have not recorded consecutive inflows, there have also been no major outflows, so support remains.
​3. It is just one step away from the confirmation line: the current price is less than 2% below the 82,800 confirmation level, and the rebound structure since August (58,000 low → 81,000) remains intact.

Why consolidation is needed first (pressure logic)
1、83,000–86,000 is a hard supply zone: Glassnode data shows approximately 1.07 million BTC accumulated in this range, making it the biggest ceiling for the rebound; another approximately 880,000 BTC have their cost basis around 80,000, creating a “roadblock.”
​2、ETF funds have not turned into consecutive inflows: outflows of $746 million in the first two days of this week and inflows of $593 million in the latter two days merely offset each other—without incremental institutional buying, the breakout lacks “ammunition.”
​3、This rebound has partly relied on short covering: IG analysts noted that positioning has approached neutral, so genuine new buying will be needed to take over; in addition, the 30-year US Treasury yield remains as high as 5.33%, and the high-interest-rate environment limits risk-asset valuations.

Key levels and “next stop”
Breakout confirmation level: 82,800 (a close above it for two consecutive days + net ETF inflows); after confirmation, the first targets are 84,000 → 85,200 (on-chain cost basis) → the upper edge of the 86,000 supply zone.
​After holding above 86,000: look toward 87,000–90,000 (the psychological round-number threshold), and even 95,000–100,000 (the view of some analysts).
​Pullback dividing line: 76,700—a close below it for two consecutive days would weaken the support structure, with 73,500 next and 70,000 in an extreme case (near the 200-day moving average at 69,507).

Trading approach
Right-side traders: wait for two consecutive daily closes above 82,800 before chasing, rather than trying to pick the top;
​Range traders: cautiously buy on a pullback to 79,000–80,000 if support holds, and take profits in batches within the 83,000–86,000 range;
​ Risk control: exit if 76,700 breaks; do not bet on a breakout with a heavy position at the highs.

BTC is now caught between “opening up room to the upside” and “consolidating at the highs,” with 82,800 as the only confirmation line that matters. If it breaks through, the next stop is 84,000–86,000, with 90,000 in sight once it holds; if it fails, BTC will return to range-bound trading between 77,000 and 83,000.
Watch two things: whether the closing price holds above 82,800 for two consecutive days + whether ETFs turn to consecutive net inflows—only when both conditions are met can we talk about a “new trend”; if either is missing, treat it as a range trade.$BTC
repost-content-media
BTC+1.42%
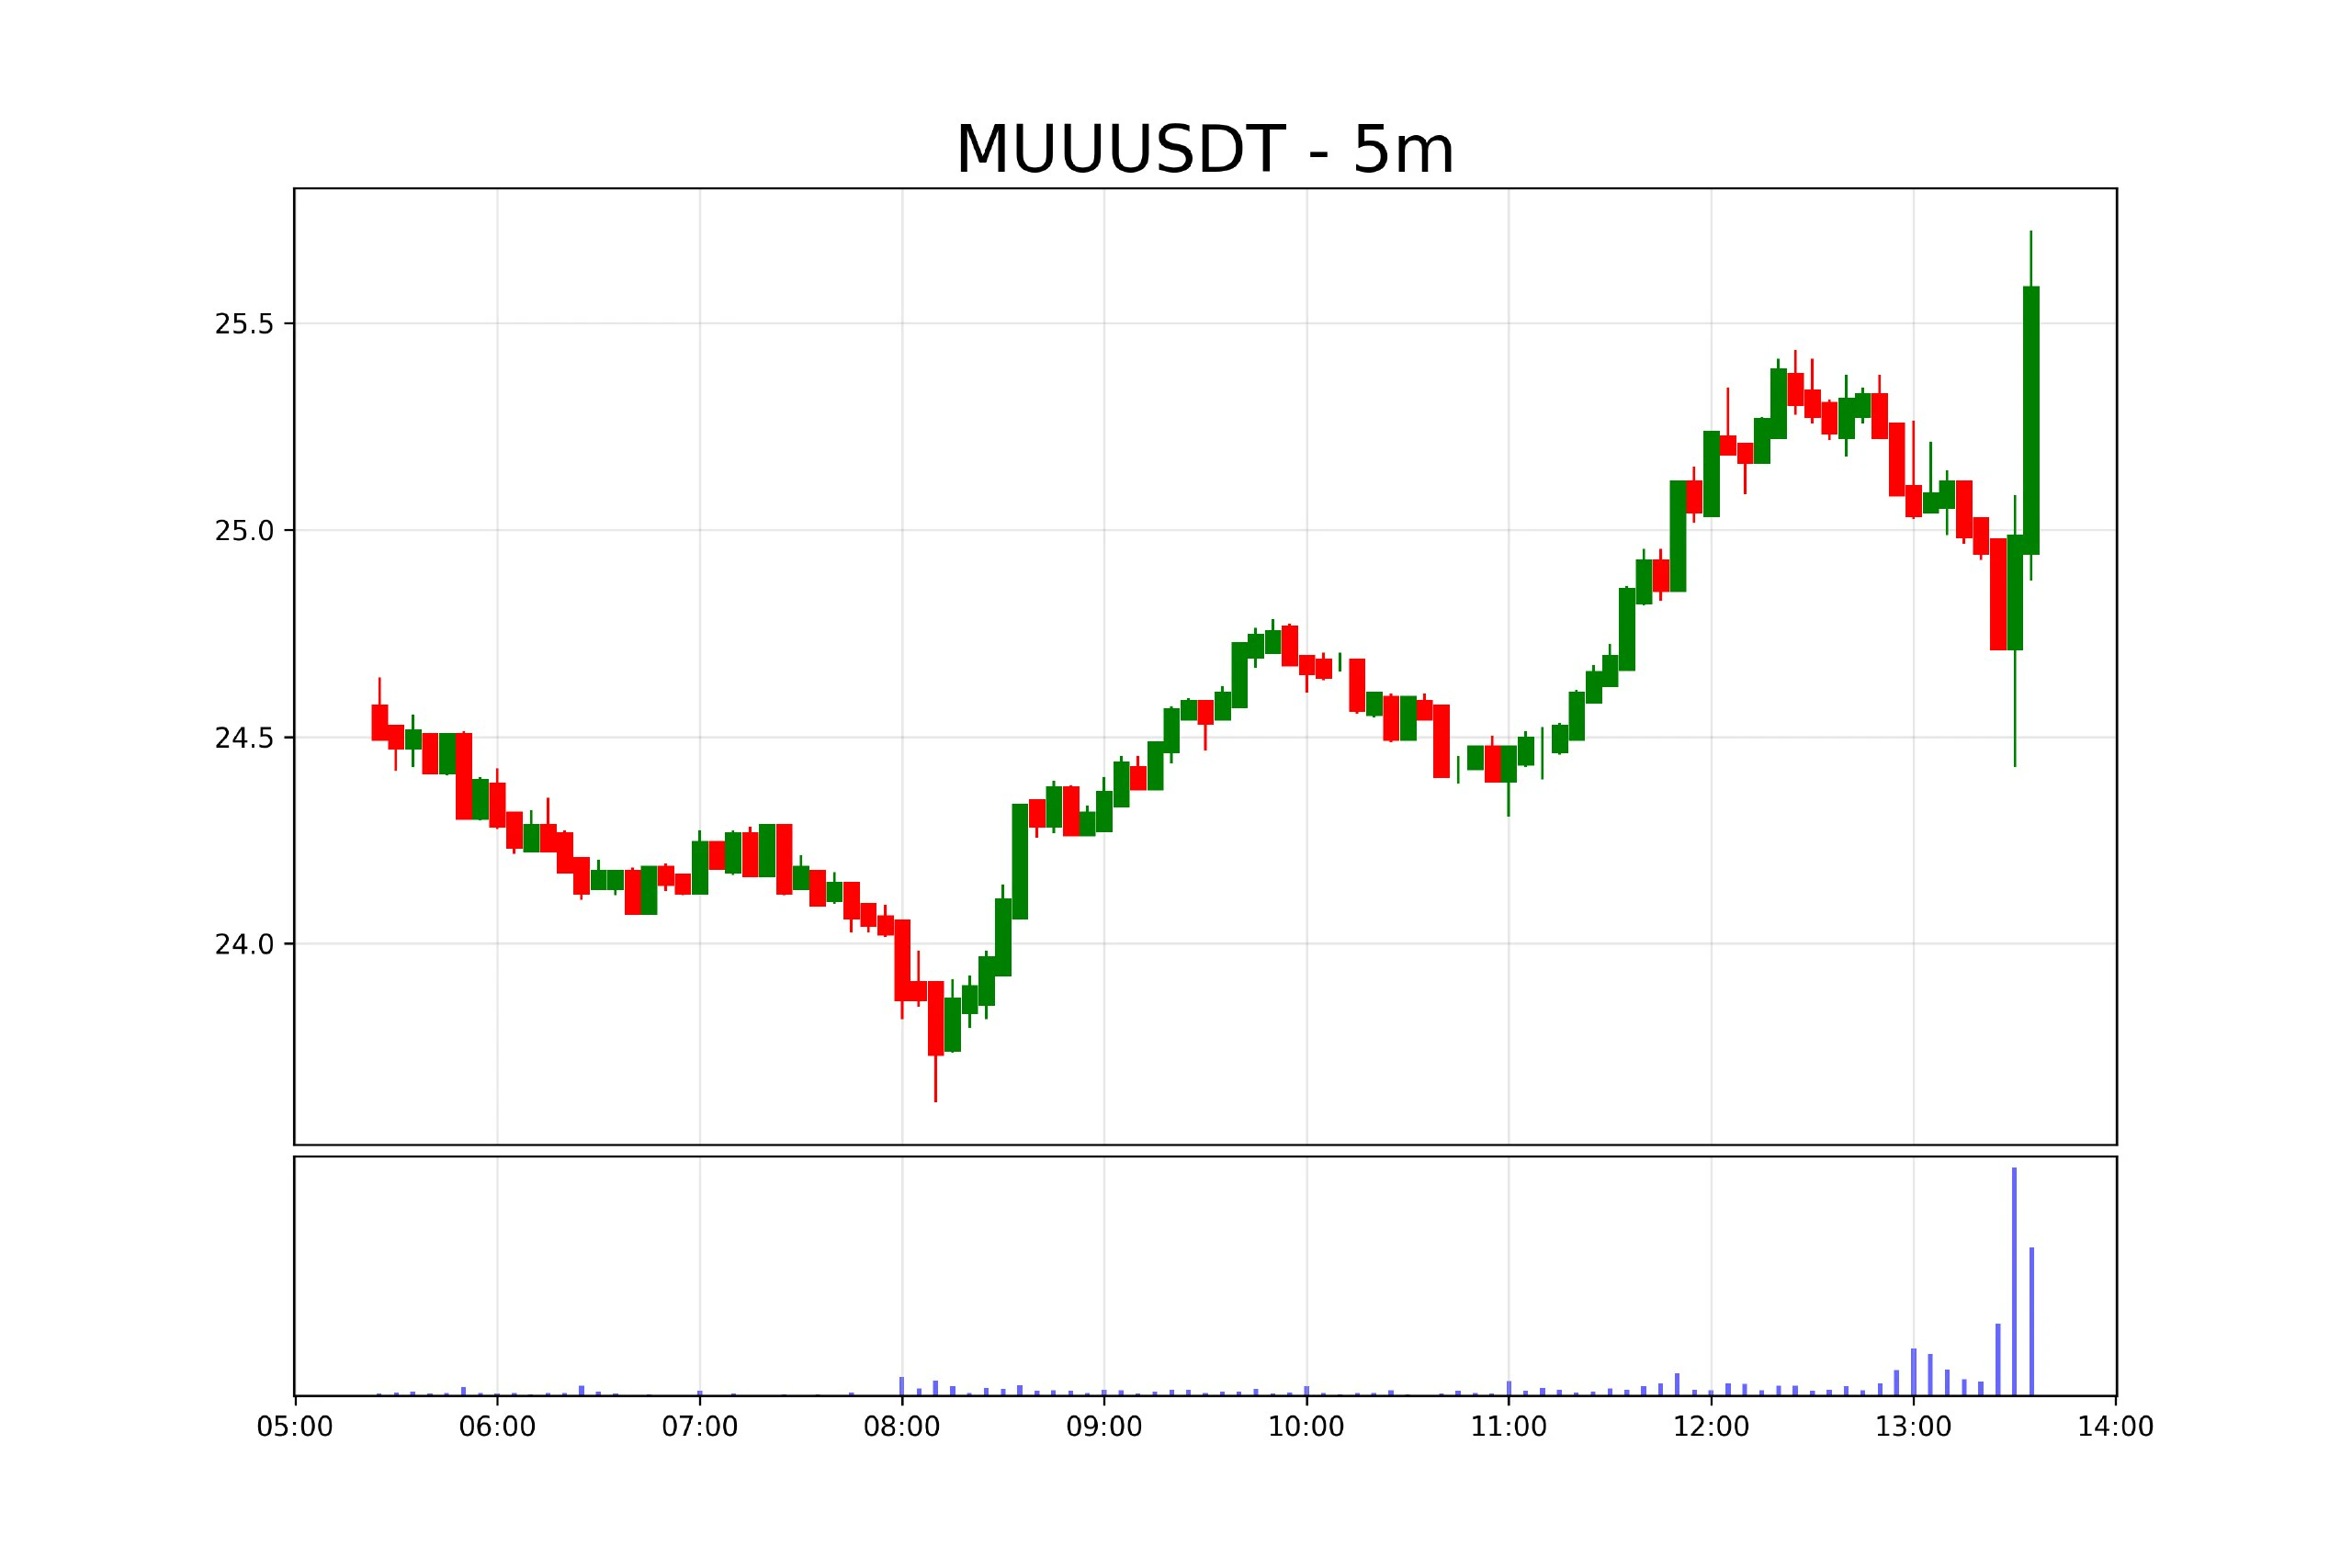
Still the simple, unpretentious student life. I wonder if everyone had this many computers when they were in school. When I was little, we didn’t even have whiteboards. Things have improved now, but there are only a few people listening to the class.$MU #BTC突破81K
post-image
MU+3.80%
$G The strangest detail today is not that it fell 49%, but that the funding rate has not even turned negative—the current price is 0.00665, down 49.27% over 24h, while trading volume surged to 51.1M USDT. A sell-off with this level of volume is usually accompanied by long-position capitulation, so the funding rate should be deeply discounted, yet the market shows that longs are still paying to hold positions. This suggests that someone is catching the falling knife against the trend, or that shorts have not yet completed their final harvest. The Fear & Greed Index is 70, with the overall marke
post-image
FTT+39.09%
I’ve done four kinds of work: taught at a university, worked in product at a Fortune 500 company, invested my own money, and then started my own company. That was the order—no particular plan. Looking back, the only consistent thread is that I’ve always been looking for a way to make the statement “I think this is how it will turn out” carry a cost.
In 2016, I was a PM at a Fortune 500 company when I happened to come across Bitcoin. I went through everything I could find and read the white paper five times. Before that, I was in academia, and in the aftermath of 2008, I watched classmates work
post-image
BTC+1.40%
#交易机器人 I'm using the CFXUSDT contract Martingale bot on Gate—come copy-trade with me!
post-image
$G Current price is 0.00684, down 44.44% over 24h, with a trading volume of 52.4M USDT. The amplitude across 30 candlesticks is as high as 131.38%, typical of panic selling. However, the chart has not completely deteriorated: MA5=0.00691 remains above MA20=0.006898, with no bearish crossover; the MACD histogram=+7.092e-05 remains bullish; RSI=41.2 has entered the weak zone but is not yet oversold; the lower Bollinger Band at 0.00649275 is the ultimate support level for this decline. The funding rate of -0.1801% is the key signal—shorts are paying longs, indicating that shorts are extremely cr
post-image
ASTER-0.27%
#KashkariSaysInflationStillTooHigh 📊 Kashkari Says Inflation Is Still Too High
Minneapolis Fed President Neel Kashkari said inflation remains too high across the U.S. economy, arguing that price pressures extend beyond volatile energy and food costs into areas such as services.
His comments come after the Federal Reserve raised its policy rate by 25 basis points to 3.75%–4.00% last week. Kashkari said the Fed’s goal remains bringing inflation back toward its 2% target.
For crypto and broader markets, persistent inflation remains an important macro factor because it can influence expectations
  • 1
Insiders are calling this the most ignored bullish setup in months for SYMBOL.

$BTC /USDT - LONG

Trade Plan:
Entry: 81426.3 – 81635.1
SL: 80528.1
TP1: 82282.6
TP2: 82783.9
TP3: 83535.9

Why this setup?
Why now? The daily trend is bullish, the 1h RSI sits at 58.14 showing room to run, and the 1h ATR of 417.74 confirms active volatility. The entry zone around 81530.7 aligns with the 1h price of 81535.4, placing TP1 at 82282.6 and TP2 at 82783.9 as realistic targets. The invalidation level at 78573.4 acts as the hard line in the sand protecting the trade. This confluence of a strong trend, n
BTC+1.42%
MARket prices updates
live-cover
LIVE1,221
Hahahaha
I’m dying laughing—AI these days.
post-image
Found a secret code at the hotel,
Bro, I'm kind of freaking out now!
What do I do, what do I do!
post-image
  • 5
  • 2

9.21 Morning/Evening Outlook (recommended 3%, 100x, total position not exceeding 5%):


🔥ETH short: Short on a wick around 2776, stop loss 34 points, take-profit references: 2668-2586-2498

🔥ETH long: Go long on a wick around 2528, stop loss 34 points, take-profit references: 2556-2602-2650


During the day, place orders as above; the levels below are where you may consider taking action

🔥🔥ETH short: Short on a wick around 2930, stop loss 46 points, take profit at 2500-2220-1921

ETH long: Go long on a wick around 2621, stop loss 24 points, take-profit references: 269
post-image
ETH+3.46%
SOL+2.94%
Range-bound SLX is about to break DOWN hard and most are still sleeping.

$SLX /USDT - SHORT

Trade Plan:
Entry: 0.06422 – 0.06460
SL: 0.06621
TP1: 0.06306
TP2: 0.06216
TP3: 0.06081

Why this setup?
Why now? The daily trend remains capped in a range, so a directional move is overdue and the setup favors downside. The 15m RSI at 47.98 shows weakening momentum just below neutral, giving sellers a window. The 1h ATR of 0.000751 confirms enough volatility to drive a meaningful move from the entry zone between 0.06422 and 0.06460. Targets sit at 0.06306 and 0.06216, offering a clean path if pric
post-image
SLX-0.35%
#CryptoMarketCapBackAbove2.8T
Market Cap Reclaims $2.8 Trillion. Is the Market Entering a New Growth Phase?
The cryptocurrency market is sending an important signal as total crypto market capitalization climbs back above $2.8 trillion. This milestone highlights renewed activity across the digital asset ecosystem and puts market sentiment back in focus.
For traders and investors, a rising total market cap is more than just a number. It reflects the combined valuation of thousands of digital assets and offers a broader view of how capital is moving through the crypto industry.
When the total m
  • 1
#GTSurges4.3%ToBreak10 GT Surges 4.3 Percent, GateToken Shows Strong Market Momentum
GateToken GT is attracting fresh attention as its price surges by 4.3 percent, bringing renewed focus to the Gate ecosystem and the growing role of GT in the crypto market. This move highlights the importance of tracking exchange tokens, market sentiment, and the developments shaping the digital asset industry.
In a market where investor confidence can change quickly, a sudden price increase often encourages traders to take a closer look at the factors behind the movement. GT remains closely connected to the G
GT+6.15%
BTC+1.40%
ETH+3.46%
  • 1
#SUI 1D
It's all set🚀 sui:native
post-image
SUI+15.36%
Why is everyone ignoring ETH at this exact entry zone?

$ETH /USDT - LONG

Trade Plan:
Entry: 2655.53 – 2667.75
SL: 2602.96
TP1: 2705.65
TP2: 2734.99
TP3: 2779.00

Why this setup?
Why now? The daily trend is bullish and the 4h structure is holding, giving us a high-confidence LONG setup. The 1h ATR of 24.45 shows the current volatility is tight enough to squeeze a clean move toward the first target at 2705.65. With the 15m RSI resting at 49.06, there is room for momentum to ignite without being overbought yet. The entry zone between 2655.53 and 2667.75 aligns with the 1h price of 2661.64, o
ETH+3.47%
  • 4
Load More

Join 40 M users in our growing community

⚡️ Join 40 M users in the crypto craze discussion

💬 Engage with your favorite top creators

👍 See what interests you

Trending Topics

BTCBreaks82K

57.75k Views18.24k Discussing

BTC has reclaimed the $80,000 level and is consolidating near 81K. The $79,800-$80,500 zone serves as near-term support, while $82,000-$82,900 remains key resistance. Funding rates are back to neutral, and spot ETF inflows have resumed. Breakout or pullback?

GateVoyage

7.45k Views9.18k Discussing

GTSurges4.3%ToBreak10

29.06k Views4.67k Discussing

View More