Square
Following
Hot
News
Profile

Opner

vip
Peak Tier 5
Active for: 1.3y
No content yet
21
Following
606
Followers
7.2k
Liked
Pin
𝐏𝐨𝐥𝐲𝐦𝐚𝐫𝐤𝐞𝐭 $𝟏𝟎𝟎 Trading Champion 𝐂𝐡𝐚𝐥𝐥𝐞𝐧𝐠𝐞 Is Now Live _ Turn Your Judgment Into Real Profit
𝐓𝐡𝐞 𝐏𝐨𝐥𝐲𝐦𝐚𝐫𝐤𝐞𝐭 $𝟏𝟎𝟎 𝐖𝐚𝐫 𝐆𝐨𝐝 𝐂𝐡𝐚𝐥𝐥𝐞𝐧𝐠𝐞 highlights how 𝐩𝐫𝐞𝐝𝐢𝐜𝐭𝐢𝐨𝐧 𝐦𝐚𝐫𝐤𝐞𝐭𝐬 are transforming modern trading by combining macro analysis, probability, and real-time market sentiment. With rising volatility across crypto, inflation, AI, and global politics, traders who understand 𝐫𝐢𝐬𝐤 𝐦𝐚𝐧𝐚𝐠𝐞𝐦𝐞𝐧𝐭, institutional flows, and market psychology may gain major advantages. The challenge rewards both profitable trading and high-quality analytical co
BTC-0.67%
  • 51
  • 4
BTC PREDICTION AND MARKET UPDATE
live-replay-cover
1,419 views11-02 12:17
11:43:07
BTC PREDICTION AND MARKET UPDATE
live-replay-cover
351 views11-02 09:20
02:37:59
BTC ETH PREDICTION
live-replay-cover
137 views11-02 06:53
01:12:09
🎃 Gate Live Halloween Special
live-replay-cover
258 views11-02 04:25
01:46:43
🎃 Gate Live Halloween Special 🎃 Gate Live Halloween Special BTC
live-replay-cover
256 views11-02 02:28
01:30:32
#GateMoneyOfficiallyLaunches
At TOKEN2049 Singapore, Dr. Han introduced Gate Money with a simple idea: “One Gate, Everything Money.” To me, the important part is not the launch itself. It is the shift from an app mainly built around trading and holding assets toward a financial platform where assets can actually move through different parts of everyday money.
Think about the traditional experience. Your cash sits in one place. Investments sit somewhere else. Digital assets are separated again. Payments require another account, while cross-border transfers can mean another layer of friction.
G
MrFlower_XingChen
#GateMoneyOfficiallyLaunches
At TOKEN2049 Singapore, Dr. Han introduced Gate Money with a simple idea: “One Gate, Everything Money.” To me, the important part is not the launch itself. It is the shift from an app mainly built around trading and holding assets toward a financial platform where assets can actually move through different parts of everyday money.
Think about the traditional experience. Your cash sits in one place. Investments sit somewhere else. Digital assets are separated again. Payments require another account, while cross-border transfers can mean another layer of friction.
Gate Money is trying to remove those walls.
The platform brings together fiat, crypto, stocks, ETFs, gold, banking and payments under one account structure. That creates a different relationship with assets: instead of simply asking where an asset is held, users can increasingly think about how that asset can be managed, converted, transferred or used.
And this is where the launch becomes more interesting.
Gate says eligible users can access a global electronic bank account through the Gate App, with plans to expand into additional markets and support collections across more than 60 local currencies. The goal is clearly bigger than domestic trading — it is about making the movement of money across borders more connected.
There is also a practical spending layer. Gate Money connects asset management with payments, while Gate’s own Money interface highlights spending through Gate Card, asset conversion and ways to keep assets working rather than treating every financial activity as a separate process.
That is the part I will be watching.
Gate has already been building a broader multi-asset ecosystem, including stocks, commodities, forex and other traditional financial products. Gate Money adds another piece to that puzzle: the connection between assets, cash flow and real-world spending.
So I would not judge Gate Money simply by asking how many features it has.
The real test is whether Gate can make moving between holding → investing → converting → transferring → spending feel like one continuous financial experience.
If it can, this is not just another product launch.
It is a change in what the Gate App is supposed to be.
One Gate. Everything Money.
$GT
#GateMoney #GateSquare #TOKEN2049

repost-content-media
GT-2.41%
BTC vs ETH — Live Stream Recap: What Was the Market Really Saying?
Tonight’s live was all about comparing Bitcoin and Ethereum at a very important moment in the market. Around the time of the stream, BTC was trading near $83.4K, while ETH was around $2.57K. Both were facing selling pressure, but the structure and reaction around key levels were different.
BTC: Bitcoin was holding near the $83K area, which became the key level to watch. The market had already seen a strong rejection from the higher $85K region, so the question was no longer simply whether BTC could bounce — it was whether buyer
MrFlower_XingChen
BTC vs ETH — Live Stream Recap: What Was the Market Really Saying?
Tonight’s live was all about comparing Bitcoin and Ethereum at a very important moment in the market. Around the time of the stream, BTC was trading near $83.4K, while ETH was around $2.57K. Both were facing selling pressure, but the structure and reaction around key levels were different.
BTC: Bitcoin was holding near the $83K area, which became the key level to watch. The market had already seen a strong rejection from the higher $85K region, so the question was no longer simply whether BTC could bounce — it was whether buyers could reclaim the lost levels and turn them back into support. A clean recovery above $84K–$85K would improve the short-term structure, while losing $83K would keep downside pressure alive and put the $80K–$82K zone into focus.
ETH: Ethereum was showing greater weakness, trading around $2.57K after falling sharply from the $2.7K area. The important point from the live was that ETH needed to stabilize before expecting a meaningful recovery. Reclaiming $2.60K–$2.65K would be the first sign that buyers were returning, while continued rejection below that region could keep the pressure toward $2.54K–$2.50K.
The bigger takeaway from tonight’s discussion was that BTC remains the market structure leader, while ETH needs stronger confirmation before showing relative strength. When both are selling off, I prefer to wait for price to prove the level rather than predicting the next candle.
For me, the key lesson from this live was simple: levels matter more than emotions. Whether BTC reclaims resistance or ETH finds support, the trade becomes clearer only after the market confirms the move.
Thanks to everyone who joined the live and discussed BTC vs ETH with me. The next move is not about guessing — it is about watching which levels hold and which ones fail.
BTC-0.67%
ETH-1.26%
#GateMoneyOfficiallyLaunches
One Gate, Everything Money.
Gate Money is now live, and for me, the interesting part is not simply the launch of another feature. It is the direction behind it: bringing asset management, payments, banking and everyday spending closer together instead of keeping them separated across different platforms.
The traditional financial experience can feel fragmented. You may hold money in one place, investments somewhere else, use another service for payments and then move funds again when you want to access a different asset. Gate Money is designed around a more connec
MrFlower_XingChen
#GateMoneyOfficiallyLaunches
One Gate, Everything Money.
Gate Money is now live, and for me, the interesting part is not simply the launch of another feature. It is the direction behind it: bringing asset management, payments, banking and everyday spending closer together instead of keeping them separated across different platforms.
The traditional financial experience can feel fragmented. You may hold money in one place, investments somewhere else, use another service for payments and then move funds again when you want to access a different asset. Gate Money is designed around a more connected approach, where users can manage and move value through one ecosystem.
What stands out is the idea of connecting holding, growing and using assets. Instead of treating assets as something that simply sits in an account, Gate is building an environment where value can potentially move from investment and conversion to payments and everyday spending with fewer steps.
Gate Money also expands the financial use cases around the Gate App, connecting areas such as fiat, digital assets, stocks, ETFs, gold, banking and payments. That broader multi-asset approach could become increasingly important as the line between traditional finance and digital finance continues to become smaller.
The cross-border side is another part worth watching. Gate has outlined plans to expand its financial services into additional global markets, supporting more currencies and use cases for international transfers, collections and asset management. If the execution matches the vision, this could make the platform much more useful for people who regularly deal with different currencies and financial markets.
I think the bigger story is simple: Gate is trying to make the Gate App more than a place to trade.
Gate Money is an important step toward building a financial ecosystem where users can manage assets, move value and eventually use those assets in more everyday situations without constantly switching between different services.
The product is still developing, so execution and global availability will matter. But this launch gives Gate a much broader direction — and that is what I will be watching next.
Explore Gate Money here:
https://gate.com/money/?ref=VgJCUQ
$GT #GateMoney #Gate
repost-content-media
GT-2.41%
#GTBurnsNearly2MTokensInQ3
Nearly 2 million GT are permanently gone. But the real question is what happens next.
Gate has completed its Q3 2026 on-chain burn, removing 1,987,321.2431520 GT from supply, worth more than $22.35 million based on the reported calculation. That brings cumulative GT burns to 191.93 million GT, reducing the original 300 million supply by approximately 63.98%.
The headline is impressive, but I don't think “2 million GT burned” is enough to explain the investment story.
A burn permanently removes tokens from circulation. That creates a structural reduction in supply, b
MrFlower_XingChen
#GTBurnsNearly2MTokensInQ3
Nearly 2 million GT are permanently gone. But the real question is what happens next.
Gate has completed its Q3 2026 on-chain burn, removing 1,987,321.2431520 GT from supply, worth more than $22.35 million based on the reported calculation. That brings cumulative GT burns to 191.93 million GT, reducing the original 300 million supply by approximately 63.98%.
The headline is impressive, but I don't think “2 million GT burned” is enough to explain the investment story.
A burn permanently removes tokens from circulation. That creates a structural reduction in supply, but scarcity only becomes powerful when there is real demand behind it. A smaller supply does not automatically mean a higher price.
That is why I see the GT thesis as a combination of burn + utility + ecosystem growth + demand.
GT already has a role across the Gate ecosystem, while Gate continues expanding its products and on-chain infrastructure. If user activity and ecosystem usage keep growing while the available supply continues to decline, the long-term supply-demand equation becomes increasingly interesting.
There is also an important detail traders should not ignore: Q2's burn was around 2.57 million GT, compared with approximately 1.99 million GT in Q3. So the latest burn was smaller.
But smaller does not automatically mean bearish.
The important question is whether the long-term supply reduction continues and whether demand grows alongside it. That's where price action becomes the real confirmation.
My three things to watch from here:
1. Sell-the-news: Traders may take profit after the announcement, creating short-term pressure even though the burn itself remains fundamentally unchanged.
2. Demand absorbs supply: If buyers continue absorbing GT after the headline fades, that would be a stronger signal that demand is supporting the scarcity narrative.
3. Structural re-rating: If supply keeps declining while Gate's ecosystem, products and user activity expand, the market could eventually start valuing GT on a broader utility and demand thesis rather than simply reacting to individual burns.
And there is one risk traders should remember: a smaller supply can amplify volatility in both directions. Strong demand can make upside moves more powerful, but weak demand can still drive sharp downside.
So I wouldn't say:
“2M GT burned = GT must pump.”
I'd frame it differently:
2M GT is permanently gone. Now the market has to prove whether demand can grow faster than the available supply.
The burn is confirmed.
The next signal comes from price, demand and ecosystem usage.
$GT #GateToken
repost-content-media
GT-2.41%
#CFTCProposesNew���CryptoAssetMarket”Category
The CFTC is moving toward a new regulatory structure for leveraged retail crypto trading — and the details matter more than the headline.
On October 5, the U.S. Commodity Futures Trading Commission opened a formal rulemaking process around Regulation CTX and Regulation CAM, seeking public feedback on a federal framework for retail crypto transactions conducted on a leveraged, margined or financed basis.
The proposal would create a new category called a Crypto Asset Market, or CAM, giving eligible platforms a potential federal registration path spe
MrFlower_XingChen
#CFTCProposesNew���CryptoAssetMarket”Category
The CFTC is moving toward a new regulatory structure for leveraged retail crypto trading — and the details matter more than the headline.
On October 5, the U.S. Commodity Futures Trading Commission opened a formal rulemaking process around Regulation CTX and Regulation CAM, seeking public feedback on a federal framework for retail crypto transactions conducted on a leveraged, margined or financed basis.
The proposal would create a new category called a Crypto Asset Market, or CAM, giving eligible platforms a potential federal registration path specifically designed around these crypto transactions. Existing CFTC-registered designated contract markets could also potentially offer these products under tailored rules.
Why is this important?
For years, one of the biggest problems surrounding U.S. crypto markets has been the gap between how quickly the industry developed and how slowly the regulatory structure evolved. Platforms, traders and builders have often had to operate around a complicated mix of federal rules and state-level requirements.
The CFTC's latest move is an attempt to create a more clearly defined federal framework rather than leaving leveraged crypto trading in a regulatory grey area.
But there is an important distinction that traders should understand.
This is not a final rule, and it does not suddenly put ordinary spot crypto trading under full CFTC supervision.
The current proposal is specifically focused on retail transactions involving leverage, margin or financing. The CFTC itself describes these as Crypto Asset Transactions, or CTXs. Broader federal regulation of the spot crypto market remains a separate issue that would require additional legal authority.
The proposed framework also goes beyond simply deciding who can offer leverage.
The CFTC is looking at the structure of these markets, including requirements designed around market integrity, anti-manipulation controls, customer protections and proof of reserves. That matters because the next phase of crypto regulation is increasingly moving toward questions such as how customer assets are protected, how platforms demonstrate financial integrity and how trading activity is monitored.
Another part of the story is the growing clarity around how U.S. regulators classify crypto assets.
Earlier this year, the SEC and CFTC issued a joint interpretation establishing categories including digital commodities, digital collectibles, digital tools, stablecoins and digital securities. The digital-commodity examples included Bitcoin, Ether, Solana, Stellar, Tezos and XRP, among others.
That doesn't mean every asset suddenly receives the same regulatory treatment in every situation. The classification depends on the characteristics and use of the particular crypto asset and the transaction involved. But compared with the uncertainty that dominated earlier crypto regulation, the direction is becoming much easier to understand.
For traders, I think the biggest potential change is the creation of a clearer path for regulated leverage in U.S. crypto markets.
If the framework eventually becomes effective in a workable form, platforms could have a defined federal route for offering leveraged crypto products instead of relying on fragmented approaches. At the same time, stronger requirements could increase compliance costs and make it harder for smaller platforms to compete.
So I wouldn't look at this announcement as simply “more regulation is bullish.”
There are two sides.
Clearer rules can reduce uncertainty, attract more institutional participation and make the U.S. market easier for serious financial businesses to navigate. But tighter requirements also mean platforms will have to prove that their systems, reserves, custody arrangements and market controls can meet a higher standard.
And there is still a major step ahead.
This is a proposal, not the finish line. The CFTC is asking for public comment, meaning the final framework can still change before any rules take effect.
What I find most significant is the direction.
The U.S. regulatory conversation is gradually moving away from simply asking “Is crypto allowed?” and toward a much more practical question:
“What should a regulated crypto market actually look like?”
That shift could matter far beyond leveraged trading.
If the U.S. eventually develops a coherent framework covering spot markets, derivatives, custody, stablecoins, tokenized assets and on-chain financial products, crypto could become much more deeply integrated with the traditional financial system.
For now, traders should avoid pricing in the entire outcome from one announcement.
Watch the comment process, final rule, registration requirements and how platforms respond.
The proposal is significant.
But the real market impact will come from what the final rules actually allow.
#CryptoRegulation #BTC #ETH
repost-content-media
BTC-0.65%
ETH-1.23%
SOL-0.77%
XLM-0.64%
XTZ-2.61%
#Bitmine���增持持仓突破601���ETH
Bitmine is getting dangerously close to owning 5% of Ethereum’s total supply — and the latest purchase makes the scale of its strategy even harder to ignore.
Bitmine Immersion Technologies has added another 15,112 ETH, taking its total holdings to 6,016,414 ETH as of October 4. At the reported valuation, that position is worth roughly $16.4 billion, representing around 4.9% of Ethereum’s total supply.
The number itself is impressive, but the consistency behind it is what really catches my attention. Bitmine has now purchased ETH every week for 66 consecutive weeks s
MrFlower_XingChen
#Bitmine���增持持仓突破601���ETH
Bitmine is getting dangerously close to owning 5% of Ethereum’s total supply — and the latest purchase makes the scale of its strategy even harder to ignore.
Bitmine Immersion Technologies has added another 15,112 ETH, taking its total holdings to 6,016,414 ETH as of October 4. At the reported valuation, that position is worth roughly $16.4 billion, representing around 4.9% of Ethereum’s total supply.
The number itself is impressive, but the consistency behind it is what really catches my attention. Bitmine has now purchased ETH every week for 66 consecutive weeks since launching its treasury strategy in June 2025. This is no longer a one-off corporate allocation or a short-term market bet. It is becoming a clearly defined long-term treasury strategy built around continued ETH accumulation.
And now Bitmine is sitting just below its 5% target.
That changes the conversation. The market is not simply watching another company buy ETH. It is watching a corporate treasury approach a position that would represent roughly one out of every twenty ETH in existence.
The important question is what happens when Bitmine reaches that target.
Does the company slow its purchases? Does it continue accumulating beyond 5%? Does the strategy change once the target is reached? Each possibility could send a different signal to the market.
There is also a bigger question for Ethereum itself.
If companies increasingly begin treating ETH as a long-term treasury asset, consistent institutional accumulation could become an important source of demand. Instead of ETH being held only by traders and individual investors, corporate balance sheets could gradually become another major part of the ownership structure.
But I wouldn't make the mistake of assuming that more ETH held by one company automatically means ETH price must go higher.
The real impact depends on whether this type of accumulation becomes a broader trend. One company reaching 5% is significant, but the bigger structural story would be multiple institutions adopting similar strategies and continuing to accumulate through different market conditions.
That is why the 66-week streak may actually be more important than today's additional 15,112 ETH.
Anyone can make one large purchase when market conditions look attractive. Continuing to buy week after week requires a much stronger conviction in the long-term thesis.
Bitmine's strategy is therefore becoming something worth watching not just for the size of its wallet, but for what it could signal about the changing role of ETH in corporate treasury management.
At 6.016 million ETH, the position is already enormous.
At 4.9%, the 5% milestone is now extremely close.
And once that milestone is reached, I think the market will have a new question to answer:
Was 5% the destination — or just the next step in Bitmine's Ethereum accumulation strategy?
That answer could matter far more than the next weekly purchase.
$ETH $BMNR
repost-content-media
BMNR-3.14%
ETH-1.26%
#SOL现货ETF单日净流出924万美元
SOL has lost the $120 handle, and the market is now testing a much more important support zone.
Solana is trading around $116.4 today, after yesterday's sharp decline pushed price from around the $120 area toward the mid-$115s. The latest 24-hour range is roughly $115.55–$121.39, while 24-hour volume is around $3.03B. The move matters because SOL is no longer simply rejecting resistance — it is now testing whether buyers can defend the lower part of the recent range.
The ETF picture has also changed. U.S. spot SOL ETFs recorded approximately $9.2M of net outflows on Octob
MrFlower_XingChen
#SOL现货ETF单日净流出924万美元
SOL has lost the $120 handle, and the market is now testing a much more important support zone.
Solana is trading around $116.4 today, after yesterday's sharp decline pushed price from around the $120 area toward the mid-$115s. The latest 24-hour range is roughly $115.55–$121.39, while 24-hour volume is around $3.03B. The move matters because SOL is no longer simply rejecting resistance — it is now testing whether buyers can defend the lower part of the recent range.
The ETF picture has also changed. U.S. spot SOL ETFs recorded approximately $9.2M of net outflows on October 5, followed by another $3.68M outflow on October 6. That means two consecutive sessions of negative flows, although the broader picture remains positive, with cumulative net inflows around $1.59B. The latest available data for October 7 currently shows no reported net flow, so I would not treat that session as another confirmed outflow.
This distinction is important.
The ETF narrative has clearly cooled from the aggressive inflow period seen in September, but that is different from saying institutional demand has disappeared. SOL's ETF complex has already accumulated substantial net inflows, and the recent weakness looks more like a deterioration in the pace of demand than a complete breakdown in institutional interest.
At the same time, SOL is dealing with a tougher macro environment.
The Federal Reserve's September meeting minutes were released yesterday, and the message was not particularly friendly for risk assets. The Fed raised rates by 25 basis points to 3.75%–4.00%, and the minutes showed that most policymakers considered another increase likely appropriate before the end of the year. That keeps the possibility of further tightening in the background and can continue to pressure higher-risk assets when yields and the dollar remain firm.
So SOL currently has three forces competing against each other: weaker recent ETF flows, a still-active Solana ecosystem, and a more restrictive macro backdrop.
The ecosystem side should not be ignored either. Solana continues expanding beyond pure speculative trading, with the Foundation recently introducing an open-source DvP settlement program aimed at institutional financial use cases. That does not create an instant price catalyst, but it adds to the longer-term narrative around Solana as infrastructure for payments, settlement and tokenized financial activity.
From a chart perspective, $115–$117 is now the area I care about most.
SOL is already testing this region. If buyers defend it and price can reclaim $118–$120, the recent sell-off could start looking more like a correction rather than a structural breakdown.
The first important recovery level is $120.
A clean reclaim of $120 would put $122–$125 back into focus. The $124–$125 region is particularly important because SOL has struggled to establish acceptance above it recently. A decisive breakout and hold above $125 would improve the short-term structure and could open the way toward the $128–$132 area.
But the bearish setup is just as clear.
If SOL loses $115 with strong selling pressure and fails to reclaim it, the next area I would watch is around $112–$114. A deeper breakdown below that zone would suggest that the September recovery structure is losing momentum and would make it harder for bulls to immediately reclaim the higher levels.
So my current map is simple:
$115–$117 → key support / buyer defense
$118–$120 → first recovery zone
$122 → short-term bullish confirmation
$124–$125 → major resistance
$128–$132 → upside zone after a confirmed breakout
$112–$114 → downside area if $115 fails
The most important thing now is not whether someone calls SOL bullish or bearish.
It is whether buyers actually respond at support.
If SOL holds $115–$117 while ETF flows stabilize and the broader crypto market finds some relief from the hawkish Fed backdrop, a recovery toward $120 and then $122 becomes reasonable to watch.
If ETF outflows continue, macro pressure remains elevated and SOL loses $115, then I would rather respect the downside structure than force a bullish thesis.
The bigger picture has not disappeared. Solana still has institutional interest, significant cumulative ETF inflows and a growing financial-infrastructure narrative.
But price has to prove it.
Right now, the market is asking one simple question:
Can SOL defend $115–$117, or is this just the beginning of another leg lower?
That reaction around support is more important to me than the headline ETF number alone.
$BTC
$SOL
repost-content-media
SOL-0.77%
#BTCBreaksThrough$86,000
Bitcoin is back near $83K, and this is where the chart starts getting interesting.
BTC is trading around $83.2K today after a sharp rejection from the $86K–$87K area pushed price back below $84K. The move has changed the short-term structure from a recovery attempt into a test of whether buyers can actually defend the lower support zone.
The $83K area is now the first level I am watching closely. Bitcoin has already traded below it during the recent sell-off, so the important part is not simply whether price touches $83K — it is whether buyers can defend the area and
MrFlower_XingChen
#BTCBreaksThrough$86,000
Bitcoin is back near $83K, and this is where the chart starts getting interesting.
BTC is trading around $83.2K today after a sharp rejection from the $86K–$87K area pushed price back below $84K. The move has changed the short-term structure from a recovery attempt into a test of whether buyers can actually defend the lower support zone.
The $83K area is now the first level I am watching closely. Bitcoin has already traded below it during the recent sell-off, so the important part is not simply whether price touches $83K — it is whether buyers can defend the area and reclaim the levels above it.
The macro backdrop is not helping bulls right now.
The latest FOMC minutes showed policymakers remained concerned about inflation, with most participants still seeing further tightening as appropriate at the September meeting. The dollar also remains close to an 18-month high, while Treasury yields have been elevated. That combination can make it harder for Bitcoin to sustain upside momentum because liquidity conditions remain restrictive.
That explains why the rejection around $86.5K–$87K matters.
Bitcoin attempted to push higher but could not establish a sustained breakout. Instead, sellers stepped in and price moved rapidly back toward $83K. The market is therefore still trapped between a meaningful resistance zone above and a critical support area below.
For the bullish scenario, I want to see BTC hold $83K and reclaim $84K–$85K first. That would show that buyers are absorbing the recent selling pressure rather than simply waiting for lower prices.
The next confirmation would be a reclaim of $86K–$87K. A clean break and hold above that zone would significantly improve the short-term structure and could reopen the path toward $88K–$90K.
But there is no reason to ignore the bearish side.
If BTC loses $83K decisively and cannot reclaim it, the next area I would watch is around $80K–$82K. A deeper break there would indicate that the recent recovery has failed and that sellers are gaining control of the larger range.
So my current map is:
$83K → key support
$84K–$85K → first recovery zone
$86K–$87K → major resistance / bullish confirmation
$88K–$90K → upside target zone after breakout
$80K–$82K → downside zone if $83K fails
What makes this setup interesting is that Bitcoin is sitting at a decision point while macro pressure remains elevated.
A strong defense of $83K could give buyers another opportunity to attack $85K and eventually $87K.
A clean break below $83K would tell a completely different story.
So I am not trying to predict the next candle.
I am watching the reaction around $83K.
If buyers defend it, BTC can attempt recovery.
If sellers break it, I would rather respect the downside structure than force a bullish narrative.
For now, $83K is the line that matters most.
$BTC ‌
repost-content-media
BTC-0.67%
#USSeptemberJobs29K
29K jobs against a 90K forecast — and the first reaction was not as simple as “bad jobs = bullish BTC.”
The September jobs report came in dramatically below expectations, with the U.S. economy adding only around 29K jobs versus the 90K forecast. Unemployment moved up to 4.2%, private hiring was only around 46K, government employment declined by roughly 17K, and previous months were revised lower.
That combination deserves more attention than the headline number alone.
The first myth I keep seeing is: “Weak jobs means the Fed will start cutting.”
That's not the right conclu
MrFlower_XingChen
#USSeptemberJobs29K
29K jobs against a 90K forecast — and the first reaction was not as simple as “bad jobs = bullish BTC.”
The September jobs report came in dramatically below expectations, with the U.S. economy adding only around 29K jobs versus the 90K forecast. Unemployment moved up to 4.2%, private hiring was only around 46K, government employment declined by roughly 17K, and previous months were revised lower.
That combination deserves more attention than the headline number alone.
The first myth I keep seeing is: “Weak jobs means the Fed will start cutting.”
That's not the right conclusion yet.
The Federal Reserve raised rates in September, so the immediate question isn't whether cuts suddenly begin. The more important question is whether this weakness reduces the probability of another hike at the late-October meeting.
That's a meaningful distinction.
A weak labor market can take some pressure away from the Fed to tighten further, but one jobs report doesn't automatically create a rate-cut cycle. Inflation still matters, and the Fed needs more evidence before changing its policy direction.
The second myth is: “It's only one bad month, so ignore it.”
I don't think that's enough either.
One weak employment report by itself can absolutely be noise. But when you combine weak hiring with rising unemployment and downward revisions to earlier data, the picture becomes more interesting.
I'm not calling it a recession signal.
I'm saying the labor market is giving policymakers another reason to be cautious.
And that matters for markets because the Fed doesn't operate in isolation. Every new employment, inflation and growth report can change expectations about the next policy decision.
The third myth is probably the most important for crypto:
“Bad economic news is automatically bad for BTC.”
Not necessarily.
Immediately after the report, risk assets could benefit because the market was more concerned about additional rate hikes than about a modest deterioration in employment. If weaker data reduces the probability of further tightening, liquidity-sensitive assets can get some breathing room.
But there is a limit to that argument.
If economic weakness remains moderate, markets can interpret it as “less pressure for more hikes.”
If the deterioration becomes severe, the interpretation can change to “growth is breaking.”
That's when the same weak economic data can become a problem for risk assets.
So the macro tailwind has an expiry date.
And Bitcoin's price action is already showing why I don't trade the headline itself.
BTC pushed into roughly the $86.7K–$87.4K area, sellers stepped in, and price came back toward the $84K region.
That tells me something important: the jobs report may have removed some macro pressure, but it did not remove the technical resistance sitting above BTC.
The chart still has the final vote.
Right now, my main area of interest is the $83K–$84K support strip.
If BTC holds this zone and buyers start reclaiming $85K, I would watch for another attempt toward $86K–$87K.
But if support breaks, I don't want to automatically assume the next move is a buying opportunity.
For a deeper pullback, I'm watching the $82.9K–$82.5K area for a potential reaction. If BTC loses roughly $82.3K, I'd rather step aside than try to catch the bottom.
That's the difference between trading a setup and trading a headline.
I don't need to predict what the Fed will do.
I don't need to predict whether the jobs market gets weaker next month.
I need to know where BTC is likely to prove or invalidate my idea.
For now, the picture is straightforward:
Weak jobs → less pressure for another hike.
Less hiking pressure → potentially supportive for risk assets.
But BTC still needs to break resistance.
And if the labor market keeps deteriorating, today's “good news” could eventually become a very different macro signal.
So my approach remains simple: small size, low leverage, clear invalidation and no chasing the first reaction.
The jobs report changed the macro conversation.
It did not change the BTC chart by itself.
Now I want to see what price does around $83K–$84K.
That's where the next real signal could come from.
$BTC
repost-content-media
BTC-0.67%
#NvidiaHitsRecordHigh
NVIDIA is sitting near $237.5 after becoming the first company to seriously challenge the $6 trillion market-cap ceiling — but the real question is no longer whether AI is real. The question is whether AI demand can continue growing fast enough to justify the expectations already priced into NVIDIA.
NVIDIA closed Wednesday around $237.47, down about 0.74% on the session, after trading as high as $239.08. The stock is still only a few dollars below its recent record zone near $243.37, while its market capitalization remains around $5.8 trillion. That makes the next move m
MrFlower_XingChen
#NvidiaHitsRecordHigh
NVIDIA is sitting near $237.5 after becoming the first company to seriously challenge the $6 trillion market-cap ceiling — but the real question is no longer whether AI is real. The question is whether AI demand can continue growing fast enough to justify the expectations already priced into NVIDIA.
NVIDIA closed Wednesday around $237.47, down about 0.74% on the session, after trading as high as $239.08. The stock is still only a few dollars below its recent record zone near $243.37, while its market capitalization remains around $5.8 trillion. That makes the next move more interesting than simply calling this another AI rally: NVIDIA is now trading in a zone where every additional percentage point represents an enormous amount of capital moving through the market.
And this is exactly why the AI-bubble debate has become more complicated.
Earlier this year, the argument was that NVIDIA had moved too far, too fast. The stock suffered a major pullback and the market questioned whether hyperscalers could keep spending at this pace, whether AI applications could generate enough revenue to justify infrastructure investment, and whether the enormous capital flowing into AI infrastructure was creating a self-reinforcing cycle.
But NVIDIA's latest numbers made the “AI is only hype” argument much harder to defend.
For fiscal Q2 2027, NVIDIA generated $96.2 billion in revenue, up 106% year over year and 18% sequentially. Data Center revenue reached $89.0 billion, up 117% year over year, while gross margin remained at 75%. Net income came in at $59.7 billion. These are not the numbers of a business waiting for AI demand to appear — they show that the demand is already translating into extraordinary financial results.
The most important part for me is not even the headline revenue number. It is the direction of the infrastructure cycle.
NVIDIA said Blackwell Ultra was driving the latest Data Center ramp, while its Vera Rubin platform was already entering full production with systems running at major AI infrastructure partners. The company also guided for approximately $108 billion of revenue in fiscal Q3, plus or minus 2%. That means the market is not simply pricing in yesterday's growth. Investors are trying to price what the next generation of AI infrastructure could look like.
At around $237.5, the chart is still structurally strong, but this is no longer an easy “buy because it is going up” setup.
The first level I would watch is $239–243, the immediate resistance and recent record zone. A clean breakout above that area, followed by a successful retest, would keep the price discovery structure intact and put the market psychologically closer to the $248–249 region, which is roughly where a $6 trillion valuation comes into view.
On the downside, $235–236 becomes an important short-term area to defend. If price loses that zone and starts accepting below it, the breakout can turn into a failed attempt and the next meaningful reaction area becomes much more important. A deeper move toward $230–232 would not automatically destroy the broader bullish structure, but it would tell me that buyers are no longer willing to chase every new high.
The bigger risk is not that NVIDIA suddenly stops selling AI hardware.
The bigger risk is expectations.
When a company is already generating tens of billions in quarterly profit and growing revenue by more than 100%, the market eventually needs another level of growth to justify an even higher valuation. That means future earnings, data-center demand, margins, new platform adoption and the spending capacity of AI customers become increasingly important.
There is also a macro risk that cannot be ignored. U.S. Treasury yields have been pushing higher, and recent market weakness has shown that even the strongest technology companies are not completely insulated from valuation pressure. At the same time, AI infrastructure spending is becoming increasingly capital-intensive, with investors debating how much of the next wave will be funded from operating cash flow versus additional financing.
So, AI boom or bubble?
My answer is somewhere in between the two extremes.
The technology demand is clearly real. NVIDIA's financial results prove that. But a real technological revolution does not automatically mean every valuation is cheap. The strongest companies can still become expensive when expectations move faster than earnings.
For NVDA, I would rather watch the reaction around $243–249 than predict the next number. Hold above the breakout zone and the market can continue discovering higher prices. Reject that area and lose $235, and the risk of a deeper consolidation increases.
The interesting part of NVIDIA's story is no longer proving that AI exists. It is finding out how much economic value the next trillion dollars of AI infrastructure investment can actually create.
$NVDA ‌#英伟达股价新高 #OneGate见证计划
repost-content-media
NVDA-1.27%
#PONSLaunchesCyclicalBuyback
$PONS has one of those catalysts that looks simple on the surface but becomes much more interesting when you connect the tokenomics with the actual price structure.
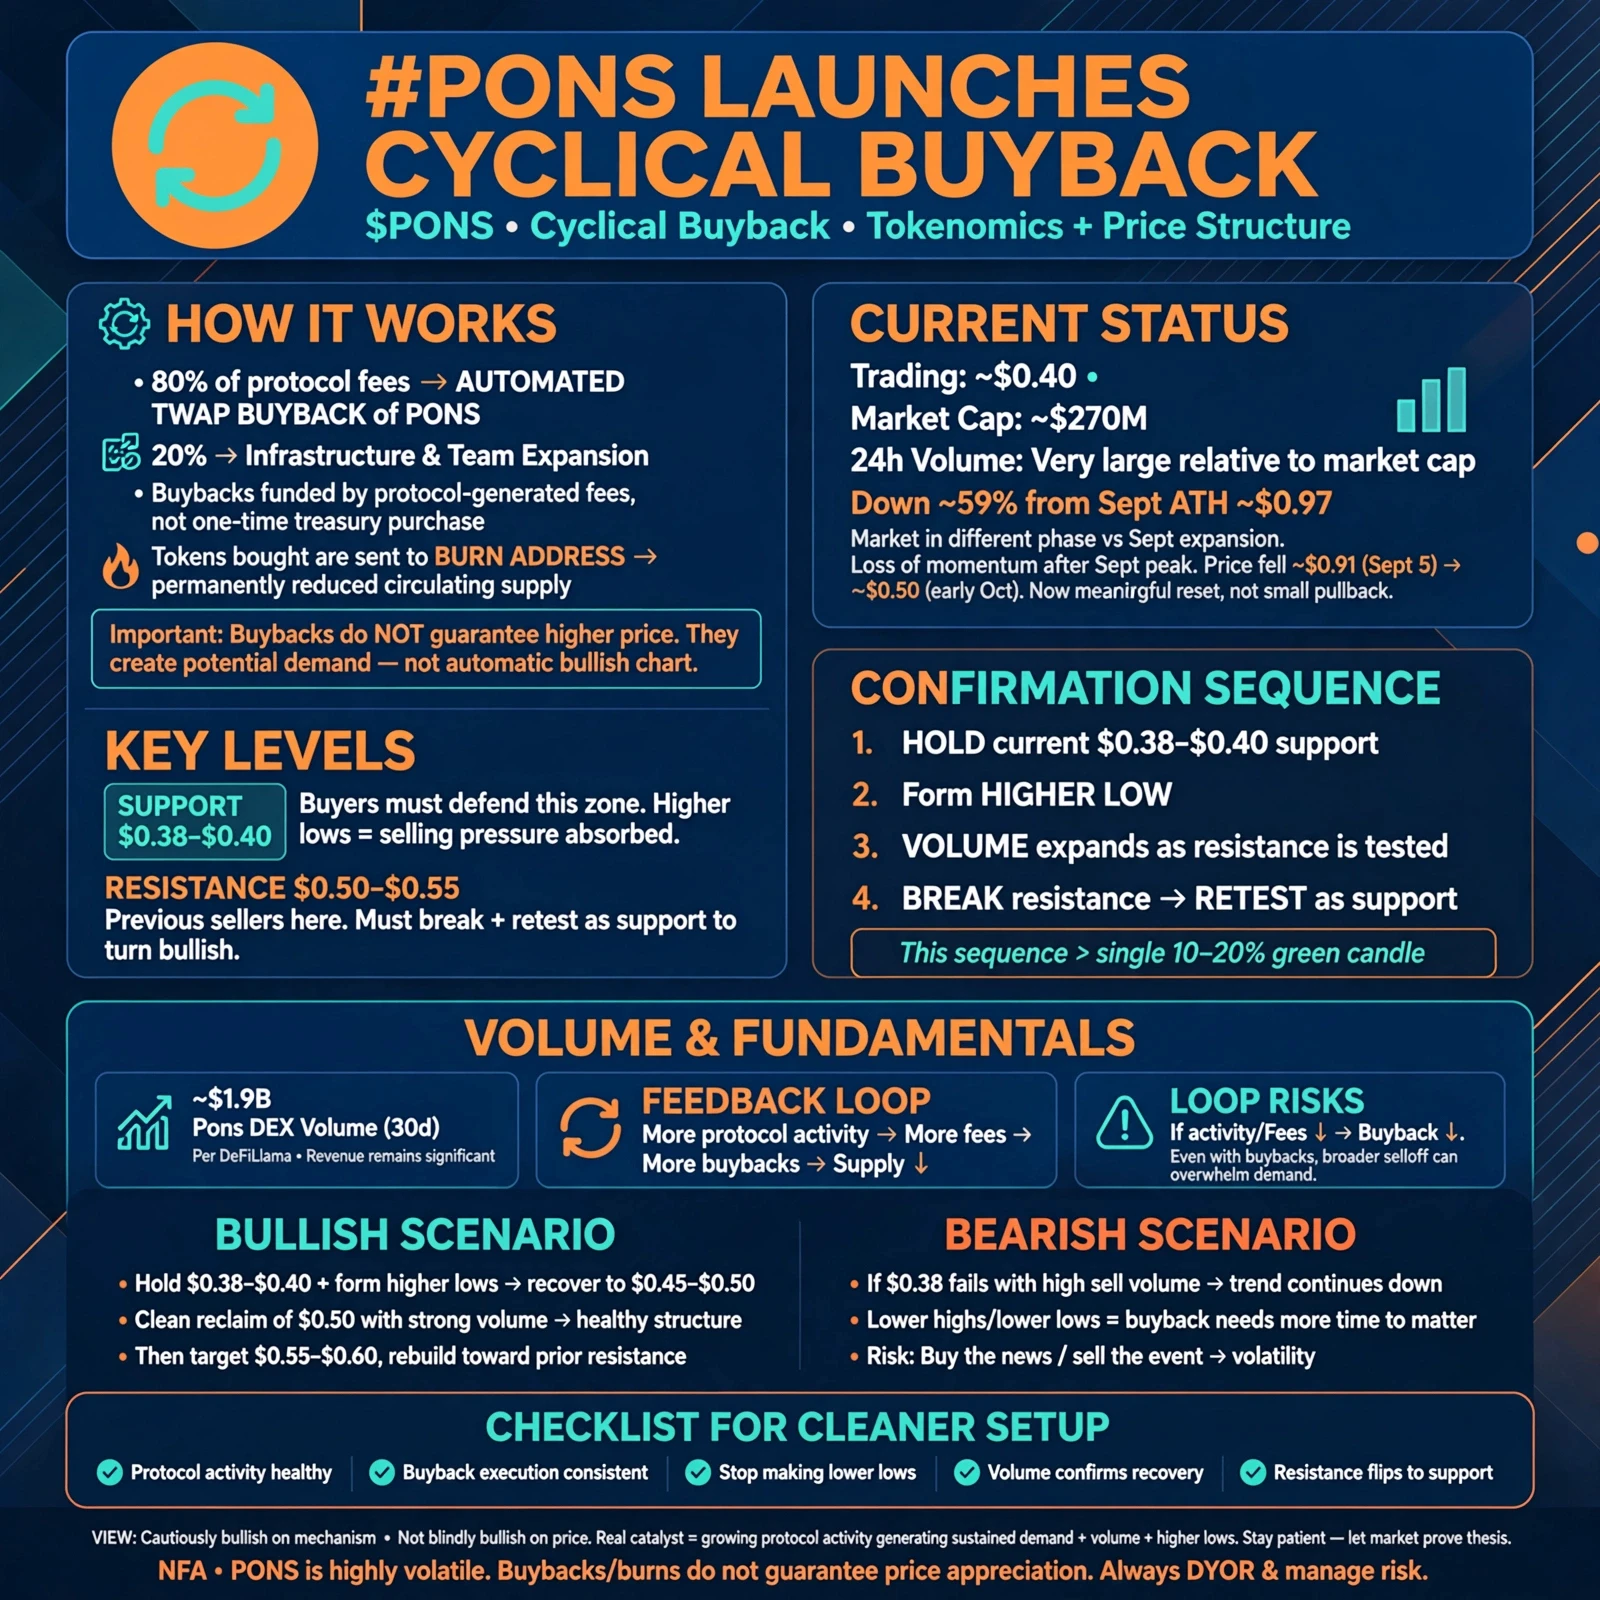
Pons currently uses 80% of protocol fees for an automated TWAP buyback of PONS, while the remaining 20% goes toward infrastructure and team expansion. The important part is that these buybacks are connected to protocol-generated fees rather than being presented as a one-time treasury purchase. The tokens bought through the protocol buyback are sent to the burn address, permanently reducing circulating
MrFlower_XingChen
#PONSLaunchesCyclicalBuyback
$PONS has one of those catalysts that looks simple on the surface but becomes much more interesting when you connect the tokenomics with the actual price structure.
Pons currently uses 80% of protocol fees for an automated TWAP buyback of PONS, while the remaining 20% goes toward infrastructure and team expansion. The important part is that these buybacks are connected to protocol-generated fees rather than being presented as a one-time treasury purchase. The tokens bought through the protocol buyback are sent to the burn address, permanently reducing circulating supply. At the same time, Pons itself makes it clear that a buyback or burn does not guarantee a higher token price.
That distinction is extremely important.
A buyback creates potential demand. It does not automatically create a bullish chart.
Right now, PONS is trading around $0.40 with a market capitalization around $270M. Recent 24-hour volume has been very large relative to the token's market cap, while the token remains roughly 59% below its September all-time high around $0.97. That tells me the market is still in a completely different phase from the September expansion.
The first thing I notice on the chart is the loss of momentum after the September peak.
PONS pushed close to $0.97 before entering a sharp correction. Historical data shows the token moved from around $0.91 on September 5 to the $0.50 area by the beginning of October, with several strong daily selloffs along the way. The latest decline has therefore not been a small pullback; it has been a meaningful reset in market structure.
That changes how I would trade the buyback narrative.
I would not treat the announcement as an automatic reason to buy.
Instead, I want to know whether the buyback can help PONS build a base after this correction.
The current area around $0.38–$0.40 is important because price has recently been testing that zone after falling from the $0.50+ region. If buyers can defend this area and start producing higher lows, that would be the first sign that selling pressure may be getting absorbed.
But there is another side to the story.
The market recently rejected much higher levels around $0.50–$0.55. Historical prices show PONS trading above $0.50 at the end of September before falling through that area during the October selloff. That makes the $0.50 region an important resistance zone in my view.
So my current map is simple.
Around $0.38–$0.40, I want to see buyers defend the market.
Around $0.50–$0.55, I want to see whether previous sellers appear again.
Above that area, the market would need to reclaim additional resistance before I would consider the broader recovery structurally convincing.
The most important confirmation for me would not be a single green candle.
It would be a sequence.
First, PONS holds the current support region.
Then price forms a higher low.
After that, volume expands as resistance is tested.
Then price breaks resistance and successfully retests it as support.
That would give me much more confidence than simply watching PONS jump 10% or 20% after the buyback narrative starts circulating.
Volume is especially important here because current activity is already substantial. DeFiLlama reports roughly $1.9B in Pons DEX volume over the past 30 days, while recent protocol revenue has also remained significant. That matters because the strength of the buyback mechanism ultimately depends on economic activity continuing to generate fees.
This creates the fundamental side of my thesis.
If users continue launching and trading tokens through Pons, the protocol can generate fees.
If fees remain strong, the buyback mechanism has more capital to work with.
If those funds continue purchasing PONS and sending the purchased tokens to the burn address, circulating supply can gradually be reduced.
That creates a potential feedback loop between platform usage and token economics.
But the loop has to be respected from both directions.
If activity falls, fee generation can fall.
If fee generation falls, buyback capacity can fall.
And even if buybacks continue, a broader market selloff can still overwhelm that demand.
So I see the buyback as a supporting mechanism, not a price floor.
Now let's look at the bullish scenario.
If PONS holds the current $0.38–$0.40 area and starts forming higher lows, I would watch the first recovery toward $0.45–$0.50. A clean reclaim of the $0.50 area with strong volume would be more important to me than the initial bounce.
If price then holds $0.50 as support, the structure starts becoming much healthier.
From there, the market could potentially challenge the $0.55–$0.60 region, followed by the larger resistance created during the September decline.
The old ATH near $0.97 is much further away and should not be treated as an immediate target. PONS would first need to rebuild its structure and prove that buyers can sustain higher prices.
The bearish scenario is equally important.
If $0.38 fails decisively and selling volume expands, I would not rush to catch the dip simply because the token has already fallen heavily.
A large correction does not automatically mean the bottom is in.
If PONS loses support and continues printing lower highs and lower lows, the buyback narrative may need much more time to translate into price strength.
There is also a classic “buy the news, sell the event” risk.
Traders may front-run the narrative, push price higher, take profits, and leave late buyers holding the volatility.
That is why my preferred setup is right-side confirmation rather than prediction.
I would rather enter after the market proves that a level has changed from resistance into support than try to guess the exact bottom.
For a high-risk asset like PONS, I would also avoid using aggressive leverage simply because the token has a strong fundamental story. The current volatility is already large enough without adding unnecessary liquidation risk.
My main checklist is therefore not complicated.
Protocol activity needs to remain healthy.
Buyback execution needs to remain consistent.
Price needs to stop making lower lows.
Volume needs to confirm the recovery.
And resistance needs to turn into support.
If those conditions start appearing together, the cyclical buyback becomes much more interesting.
The biggest thing I would watch over the next phase is whether PONS can disconnect from its recent downtrend.
A bounce is not enough.
A higher high is more interesting.
A higher high followed by a higher low is better.
A breakout followed by a successful retest is where the trade becomes much cleaner.
That is the difference between trading a narrative and trading confirmed structure.
My current view is therefore cautiously bullish on the mechanism, but not blindly bullish on the price.
The tokenomics are genuinely worth watching because Pons is directing 80% of protocol fees toward automated PONS buybacks, and the purchased tokens are burned. At the same time, current market data shows that PONS is still deeply below its September peak, meaning the chart has not yet fully confirmed a trend reversal.
For me, the real catalyst is not simply:
“PONS is buying back tokens.”
It is:
“Can growing protocol activity continuously generate enough demand to absorb selling pressure and eventually rebuild the chart?”
If the answer becomes visible through revenue, buybacks, volume and higher lows, I think the setup becomes considerably more attractive.
Until then, I would stay patient.
Let the market prove the thesis before chasing it.
Fundamentals can create the reason to watch PONS.
Price structure decides when I would actually trade it.
This is my personal market view, not financial advice. PONS remains highly volatile, and buybacks or burns do not guarantee price appreciation. Always verify liquidity, market structure and your own risk before entering a position.
#PONS #PONSToken
$PONS ‌
repost-content-media
PONS+4.32%
#GTBurnsNearly2MTokensInQ3
Nearly 2 million GT just disappeared from the supply.
Gate has completed its Q3 2026 on-chain burn, permanently removing 1,987,321.2431520 GT, valued at more than $22.35 million at the time of the reported calculation. After this burn, cumulative GT burned since the program began reached 191,934,541 GT. Gate says the total supply has now been reduced by approximately 63.98% from the original 300 million GT.
But the interesting part isn't simply the number.
Why burn GT at all?
A token burn permanently removes tokens from circulation. Once sent to the designated burn
MrFlower_XingChen
#GTBurnsNearly2MTokensInQ3
Nearly 2 million GT just disappeared from the supply.
Gate has completed its Q3 2026 on-chain burn, permanently removing 1,987,321.2431520 GT, valued at more than $22.35 million at the time of the reported calculation. After this burn, cumulative GT burned since the program began reached 191,934,541 GT. Gate says the total supply has now been reduced by approximately 63.98% from the original 300 million GT.
But the interesting part isn't simply the number.
Why burn GT at all?
A token burn permanently removes tokens from circulation. Once sent to the designated burn address, those tokens cannot return to the market. In GT's case, this has been part of a continuing deflationary mechanism since the Gate Chain mainnet launched in 2019.
The economic idea is straightforward: if supply keeps shrinking while demand and ecosystem usage remain healthy, each remaining token represents a larger share of the available supply.
But this is where the market needs to be realistic.
A burn does not automatically create a pump.
Reducing supply only becomes powerful when there is actual demand on the other side. If demand falls faster than supply is being reduced, scarcity alone cannot protect the price.
That is why I think the bigger GT story is not “2 million tokens burned.”
It is burn + utility + ecosystem growth + demand.
GT already functions as the native asset of Gate Chain and has utility across the broader Gate ecosystem. Gate is also continuing to expand its on-chain infrastructure and applications, which gives the deflationary mechanism something important to work with: potential future demand rather than scarcity in isolation.
There is another important detail traders should watch.
The Q2 2026 burn removed around 2.57 million GT, while Q3 removed around 1.99 million GT. So the latest burn is smaller than the previous quarter.
That doesn't make Q3 bearish. It simply means the correct analysis isn't “bigger burn = better price.” The market should focus on the long-term trend of supply reduction and whether GT demand is expanding alongside it.
What could happen next?
Scenario 1 — Sell the news
If traders already positioned ahead of the announcement, the actual burn can become a profit-taking event. GT could pull back even though the fundamental supply story remains unchanged.
Scenario 2 — Burn gets absorbed
If buyers continue absorbing available supply after the announcement, the burn becomes more meaningful. In that case, the market is showing that demand is strong enough to outweigh short-term selling pressure.
Scenario 3 — Structural re-rating
This is the scenario I would watch most closely.
If GT's circulating supply continues to decline while Gate expands user activity, products and on-chain utility, the market can eventually start pricing GT differently. At that point, the burn isn't the entire thesis — it becomes one part of a broader demand-and-supply equation.
And there is a fourth possibility traders shouldn't ignore:
Scenario 4 — Volatility increases
With a progressively smaller supply base, relatively modest changes in demand can have a larger impact on price. That can work both ways. Strong demand can accelerate upside, but weak demand can also make downside moves sharper.
So I wouldn't look at this announcement and immediately conclude:
“2M GT burned = GT must pump.”
The better conclusion is:
2M GT is gone permanently. Now the market has to prove whether demand can keep growing faster than the available supply.
That is the real test for GT.
The burn is confirmed.
The next signal comes from price action, demand, ecosystem usage and how the market reacts after the headline fades.
That reaction matters more than the headline itself.
#GT #GateToken
$GT ‌
GT-2.41%
#NvidiaHitsRecordHigh
NVIDIA just did something the market always pays attention to: it made a new all-time high. $NVDA pushed above its previous record and reached roughly $237.5–$237.9, putting the stock back into price-discovery territory. But for me, the interesting part isn't simply that the number is higher. It's what the market is now pricing in from here.
NVIDIA's latest fundamentals give this rally a serious foundation. In its most recent reported quarter, revenue reached $96.2 billion, up 106% year over year, while Data Center revenue jumped to $89.0 billion, up 117%. NVIDIA is also
MrFlower_XingChen
#NvidiaHitsRecordHigh
NVIDIA just did something the market always pays attention to: it made a new all-time high. $NVDA pushed above its previous record and reached roughly $237.5–$237.9, putting the stock back into price-discovery territory. But for me, the interesting part isn't simply that the number is higher. It's what the market is now pricing in from here.
NVIDIA's latest fundamentals give this rally a serious foundation. In its most recent reported quarter, revenue reached $96.2 billion, up 106% year over year, while Data Center revenue jumped to $89.0 billion, up 117%. NVIDIA is also guiding for approximately $108 billion in revenue for the next quarter. That tells me this isn't just a story built around excitement for AI anymore. The AI infrastructure cycle is translating into real revenue at an extraordinary scale.
This is where the new ATH becomes more interesting. When a stock enters price discovery, there is no major historical resistance directly above it. That can create momentum because traders have fewer previous supply zones to reference. But there is another side to the story: once price reaches record territory, expectations themselves become the resistance. Investors are no longer asking whether NVIDIA can break the previous high. They are asking whether the business can continue growing fast enough to justify the expectations already built into the stock.
For $NVDA, the answer will depend heavily on whether AI infrastructure spending remains strong. Data centers, cloud providers and other large technology companies are continuing to invest heavily in computing capacity, and NVIDIA remains deeply positioned in that ecosystem. But the market will want continued evidence through future earnings rather than relying only on the AI narrative.
From a chart perspective, I would pay close attention to how NVDA behaves after the breakout. If the stock can hold above the previous record instead of quickly falling back below it, that old resistance can begin turning into a new support area. A breakout that holds is much more meaningful than a quick spike followed by rejection. Volume and momentum will also matter because strong participation would make the move more convincing.
At the same time, I wouldn't treat a new ATH as a guaranteed signal to chase the price. NVIDIA's extraordinary growth has also created extremely high expectations. If future results begin coming in below what investors have already priced in, the reaction can be aggressive even if the company itself continues growing.
So my view is simple: the new ATH confirms that buyers are still willing to pay record prices for NVIDIA, but the next move needs confirmation. The real question isn't whether $NVDA can make another record. It's whether the company can continue delivering the kind of AI-driven growth that makes these record valuations sustainable.
For now, I'd rather watch whether the breakout holds than chase the headline.
$237+ can become a new launchpad — or eventually prove to be a temporary peak. The reaction after the breakout will tell us much more than the ATH itself.
#NVDA #NVIDIA
$NVDA ‌
NVDA-1.27%
#BONERRisesAgainstTheTrend,NearsAll-TimeHigh
$BONER is having another aggressive session, but the important part now isn't the percentage gain. It's whether buyers can turn this momentum into a sustained breakout instead of another fast rejection.
The latest market feeds put BONER around the $0.07–$0.075 area, with roughly 24–26% gains over 24 hours and about 56% over seven days. CoinGecko records a recent 24-hour range of $0.05488–$0.07375, while the latest live chart feed has pushed above that earlier range. That tells me the market is moving quickly enough that individual exchange snapshot
MrFlower_XingChen
#BONERRisesAgainstTheTrend,NearsAll-TimeHigh
$BONER is having another aggressive session, but the important part now isn't the percentage gain. It's whether buyers can turn this momentum into a sustained breakout instead of another fast rejection.
The latest market feeds put BONER around the $0.07–$0.075 area, with roughly 24–26% gains over 24 hours and about 56% over seven days. CoinGecko records a recent 24-hour range of $0.05488–$0.07375, while the latest live chart feed has pushed above that earlier range. That tells me the market is moving quickly enough that individual exchange snapshots can become outdated within minutes.
The broader structure is still bullish. BONER has climbed from the $0.037 area seen during the recent weekly range toward the $0.074–$0.075 region. That is a very large move in a short period, so momentum is clearly strengthening. But the higher price goes, the more important confirmation becomes. Chasing a vertical candle here carries a very different risk profile from buying a confirmed retest.
The first important zone is $0.074–$0.075. Price is testing this area after breaking out of the earlier intraday range, so I want to see whether buyers can actually hold it rather than simply wick through it. Above that, the major structural resistance is around $0.0823, BONER's recorded all-time high. A clean break and acceptance above that level would be much more significant because it would put the token into new price-discovery territory.
On the downside, $0.060 is the first level I would defend. It sits below the current breakout area and would be an early warning that momentum is fading. The more important support is around $0.0549, which is the recent 24-hour low in CoinGecko's latest snapshot. If BONER loses that level after failing to hold the breakout, the recent move starts looking much more like a failed expansion than healthy continuation.
The next major downside reference is the $0.0373 area, the recent seven-day low. Losing that zone would completely damage the current higher-low structure and would tell me that the recent momentum cycle has effectively been unwound. Until that happens, I would still treat pullbacks as part of a volatile bullish structure rather than automatically calling them a reversal.
Volume supports the move, but not enough to make it low-risk. Current spot turnover is around $4M over 24 hours, while BONER's market capitalization is around the high-$60M area. That is meaningful activity for a token of this size, but it also highlights the liquidity risk: BONER is still small enough that relatively modest changes in buying or selling pressure can move price sharply.
I would be careful with the derivatives picture. CoinGecko currently reports roughly $1.5M in perpetual open interest, with a mildly positive 0.0026% 8-hour funding rate. Another live derivatives aggregator reports materially lower OI and strongly negative funding across its tracked venues. Because the datasets do not agree, I don't think it is responsible to claim that BONER is currently dominated by aggressive longs or shorts. What we can say is that leverage exists, but the exact positioning signal is uncertain.
The current catalyst is clearer. Gate reported today that BONER surged 17.8% in 24 hours and briefly exceeded a $76M market cap, with the move linked to renewed attention around Robinhood Chain stock-themed meme tokens following Bloomberg's recent coverage. That is a confirmed attention catalyst, but it should be treated as a narrative catalyst rather than proof of fundamental value.
That distinction matters because BONER remains a highly speculative asset. The current move is being driven primarily by market attention, liquidity and momentum rather than a conventional earnings or cash-flow fundamental. If attention continues expanding, that can produce another leg higher. If attention disappears, the same thin-liquidity structure can amplify the downside.
Bullish scenario: I would want to see sustained acceptance above $0.075, followed by a clean test of $0.0823. A decisive break above the ATH with expanding spot volume would be the strongest confirmation that buyers are entering genuine price discovery. From there, $0.090 becomes the first psychological target, followed by $0.100. The bullish structure would be weakened significantly by a failure back below $0.060.
Bearish scenario: The first warning is rejection around $0.074–$0.0823 followed by a loss of $0.060. A confirmed breakdown through $0.0549 would make $0.046 the next area to watch, while a move back toward $0.0373 would indicate that the entire recent rally is being retraced. The bearish setup would lose credibility if buyers quickly reclaim $0.060 and then recover $0.075.
My verdict right now is bullish momentum, but not a low-risk chase. Spot price action is strong, the seven-day structure is clearly positive and today's attention catalyst is real. At the same time, BONER is approaching its historical high after a very fast move, and the liquidity profile means both breakouts and breakdowns can happen violently.
For me, the market has two numbers to prove next: $0.075 and $0.0823. Holding the first and breaking the second would strengthen the continuation case considerably. Rejection followed by a loss of $0.060 would shift the structure toward consolidation, while a break below $0.0549 would raise the probability of a deeper reversal.
Right now, the trend is bullish — but confirmation above the ATH matters more than another green candle.
BONER+7.46%
#PlanYourTradesThisWeek,
Crypto market volatility is picking up, and for me, this is not the time to simply become more aggressive because the candles are getting bigger.
It is the time to become more selective.
The market has changed quickly. Bitcoin has pushed toward the $87K area again, but the important part is that buyers have not yet managed to establish a clean hold above that zone. BTC has been trading around the mid-$86K area after another rejection near $87K, while the broader market is also reacting to changing macro expectations. Softer U.S. jobs data has supported risk sentiment
MrFlower_XingChen
#PlanYourTradesThisWeek,
Crypto market volatility is picking up, and for me, this is not the time to simply become more aggressive because the candles are getting bigger.
It is the time to become more selective.
The market has changed quickly. Bitcoin has pushed toward the $87K area again, but the important part is that buyers have not yet managed to establish a clean hold above that zone. BTC has been trading around the mid-$86K area after another rejection near $87K, while the broader market is also reacting to changing macro expectations. Softer U.S. jobs data has supported risk sentiment and reduced expectations for another rate hike, but elevated Treasury yields are still an important source of pressure.
That combination is exactly why I don't think the right response is simply “buy because the market is going up.”
For me, the first question is how much risk am I willing to carry in this environment?
When volatility increases, position management becomes much more important. A position that feels comfortable during a quiet market can become difficult to manage when price starts moving sharply in both directions. Bigger intraday ranges mean stops can be reached faster, unrealized P&L can change quickly, and emotional decisions become much easier to make.
So I’m not looking at volatility as a reason to increase every position.
I’m using it as a reason to review my exposure.
If I already have a position that is working and the original thesis remains valid, I don't need to constantly interfere with it. I can protect the trade, reassess the important levels, and allow price to prove whether the move has continuation.
If a position has become too large relative to the current conditions, reducing exposure can make sense.
And if I don't have a position, I don't think I need to create one just because the market is moving.
That distinction is important.
There is a big difference between having an opportunity and feeling that you need to trade.
Right now, I'm more interested in the reaction around important levels than in chasing individual candles.
Bitcoin approaching the $87K region is a good example. The market has already shown that this area can attract sellers. The 2026 yearly open around $87,570 is another important resistance reference. A clean move through resistance followed by acceptance would tell me something very different from another quick spike above the level followed by a rejection.
For me, confirmation matters more than the first move.
If buyers reclaim an important level and actually defend it, that can improve the quality of a long setup.
If price repeatedly fails at the same area, I don't want to pretend the resistance doesn't exist just because the overall sentiment looks bullish.
And if the market starts losing important support while volatility continues expanding, I want to be prepared for a completely different environment.
This is also why asset selection matters more right now.
When the market becomes active, it is tempting to focus on whatever asset is making the biggest move. But the fastest-moving asset is not necessarily the best trade.
I would rather trade an asset where I can understand the structure, identify meaningful support and resistance, see reasonable liquidity, and define my invalidation clearly.
A trade should not begin with a target.
It should begin with a reason.
Before entering, I want to know what I am seeing, what would confirm my idea, what would invalidate it, and how much capital I am prepared to risk if I am wrong.
If those answers are unclear, I don't think a bigger position will make the setup better.
It will only make the uncertainty more expensive.
Leverage is another area I’m paying more attention to.
Volatility can make leveraged positions look attractive because the potential return becomes larger. But the same volatility works against you when the move goes the other way. A quick wick can turn a trade that looked perfectly fine a few minutes earlier into a forced exit.
That is why I would rather have a smaller position with a clear plan than a larger position that depends on price behaving perfectly.
There is also a psychological side to this.
When the market moves quickly, FOMO becomes stronger.
You see an asset move without you and immediately start thinking that you are late. Then you enter after the move has already happened, place a tight stop because you don't want to risk much, and get stopped when price makes a normal pullback.
That cycle can repeat over and over.
I don't want to trade like that.
If I miss a move, I miss it.
There will always be another setup.
Staying on the sidelines is also part of trading.
I think this gets underestimated because social media makes it look like every market condition requires an opinion and every candle requires a position.
It doesn't.
If the structure is unclear, the risk-to-reward is poor, or price is moving too violently for me to manage the position comfortably, waiting is completely valid.
Capital is not only there to be deployed.
Capital also gives me the ability to participate when the conditions become clearer.
So where does that leave me right now?
I’m not completely stepping away from the market.
I’m also not looking to aggressively add exposure simply because volatility has increased.
My preference is active trading with controlled exposure.
I want to participate when the setup is clear, but I want to be quicker about reducing unnecessary risk when the market stops behaving according to the original thesis.
For existing positions, I'm focused on whether the structure remains valid.
For new positions, I'm waiting for confirmation rather than chasing.
For assets showing unusually large moves, I'm asking whether the move has sustainable structure or is simply attracting short-term liquidity.
And when I don't have a clear answer, I can wait.
That is probably the biggest lesson volatility teaches: you don't need to predict every move to trade well. You need to manage the moves you choose to participate in.
The market will keep changing.
Today’s bullish structure can become tomorrow’s rejection. A breakout can become a fakeout. A pullback can become a deeper correction. And a period of uncertainty can eventually produce a much cleaner trend.
So my priority is not to be right on every candle.
It is to stay positioned well enough to take the opportunities that actually make sense.
Volatility creates opportunity, but it also exposes poor position management very quickly.
For me, the current environment is about being active without being reckless, selective without being completely inactive, and flexible enough to change my view when the market gives me a reason.
What are you doing right now?
Adding, reducing, trading actively, or staying on the sidelines?
$BTC ‌
repost-content-media
BTC-0.67%
Load More