Square
Following
Hot
News
Profile

Sakura_3434

vip
Active for: 5y
Peak Tier 5
"I am an experienced user who closely monitors and publishes market trends through analysis, charts, and news tracking in the crypto market."
1.2k
Following
1.5k
Followers
39.5k
Liked
🧧 Gate Square #ShareWeekly Special Edition|Big Red Packets Winners
Congrats to the lucky winners! 🎉
New users 100% win, up to 2 USDT per post and weekly rewards up to 100 USDT!
🏆 Lucky Winners
🎁 3 USDT: @Dibango7 , @1号K线处
🎁 1 USDT: @WhaleSignal , @甲乙饼 , @jose_Butler1 1, @波浪理论学习王 , @交易老王BTC
🔥 Event is still live!
Share your market insights and ea
Gate_Square
🧧 Gate Square #ShareWeekly Special Edition|Big Red Packets Winners
Congrats to the lucky winners! 🎉
New users 100% win, up to 2 USDT per post and weekly rewards up to 100 USDT!
🏆 Lucky Winners
🎁 3 USDT: @Dibango7 , @1号K线处
🎁 1 USDT: @WhaleSignal , @甲乙饼 , @jose_Butler1 1, @波浪理论学习王 , @交易老王BTC
🔥 Event is still live!
Share your market insights and earn more rewards:
👉 https://www.gate.com/campaigns/6244
Post with #ShareWeekly and #USCPISoon and claim bonuses 🎁
👉 https://www.gate.com/post/topic/USCPISoon?topic_id=205842
repost-content-media
  • 7
CPI Today, PPI Tomorrow: Markets Focus on Inflation Data
US inflation data is once again at the center of attention this week. The September CPI data, set to be released today (October 14), is being closely watched as a key benchmark for risk assets, including cryptocurrency markets.
What Are the Expectations?
According to the median forecast of economists:
- Annual headline inflation (headline CPI): Expected to be around 3.6% (it was 3.4% in August). Much of the increase stems from rising energy prices.
- Core inflation (core CPI, excluding food and energy): Expected to be in the 2.4%–2.5% ra
User_any
CPI Today, PPI Tomorrow: Markets Focus on Inflation Data
US inflation data is once again at the center of attention this week. The September CPI data, set to be released today (October 14), is being closely watched as a key benchmark for risk assets, including cryptocurrency markets.
What Are the Expectations?
According to the median forecast of economists:
- Annual headline inflation (headline CPI): Expected to be around 3.6% (it was 3.4% in August). Much of the increase stems from rising energy prices.
- Core inflation (core CPI, excluding food and energy): Expected to be in the 2.4%–2.5% range on an annual basis and around 0.2% on a monthly basis.
The Key Factor: Deviation from Expectations
For the markets, the crucial aspect is not merely whether the figure is high or low, but how it deviates from expectations. Three scenarios are being discussed in this context:
- If core CPI comes in at 0.1% or lower, it could signal slowing inflation and lead to a decline in bond yields.
- If core CPI comes in around 0.2% (in line with expectations), market focus might shift to the details and sub-components.
- If core CPI comes in at 0.3% or higher, it could push bond yields up, strengthen the dollar, and dampen risk appetite.
Significance for Fed Expectations
This data is one of the final key economic indicators the Fed will evaluate prior to its October 27–28 meeting. Based on current market pricing, the probability of an interest rate hike in October remains low; CPI data could alter this pricing in either direction.
Tomorrow is Also Important: PPI Data
Monitoring inflation doesn't end today. The Producer Price Index (PPI) will be released tomorrow, October 15, providing additional insight into price pressures at the wholesale/producer level.
What to Watch
When assessing the market's reaction to the data, it is worth paying attention to the following factors:
- US Treasury yields
- The Dollar Index (DXY)
- The initial reaction of BTC and the broader crypto market
Another point to note: initial price movements following the release can sometimes reverse quickly. The initial reaction may shift as the market fully digests the data, so drawing definitive conclusions from a single, momentary move can be misleading.
👉This content is for informational purposes only and does not constitute investment advice. Cryptocurrency markets are highly volatile; it is important to base your investment decisions on your own research.
#USCPISoon
$EURUSD $US30 $NAS100 $BTC $GT
repost-content-media
BTC+0.94%
EURUSD-0.03%
US30+0.04%
NAS100+0.13%
GT+0.09%
  • 16
  • 1
Excited to share that our Founder & CEO @Dr. Han has been invited to speak at the Oxford Union— one of the world’s most prestigious debating societies, with a history spanning over 200 years and a stage that has hosted world leaders, Nobel laureates, and icons across every field.

On the agenda: crypto, the future of money, and what Gate Money means for how the world moves value.

November 12 at University of Oxford.
Gate_Square
Excited to share that our Founder & CEO @Dr. Han has been invited to speak at the Oxford Union— one of the world’s most prestigious debating societies, with a history spanning over 200 years and a stage that has hosted world leaders, Nobel laureates, and icons across every field.

On the agenda: crypto, the future of money, and what Gate Money means for how the world moves value.

November 12 at University of Oxford.
repost-content-media
  • 8
🏎️ 100% Win! Gate Square “Share Weekly” Special Topic is Ongoing!
💰️ Post with hashtags for red packets, Up to 2 USDT per user!
Up to 100 USDT on the weekly leaderboard!
📌 How to Join
1️⃣ Register: https://www.gate.com/campaigns/6244
2️⃣ Post with #ShareWeekly and #GateXRedBullWinsSingaporeGP
💬 Topic
Max takes his 73rd career win at Marina Bay! Gate celebrates this F1 milestone with Red Bull Racing.
💡 Share Your Thoughts
1️⃣ How do you rate Max’s performance?
2️⃣ What F1 × Web3 ideas would you like to see from Gate?
Limited red packets, first come, first served!
👉 https://www.gate.com/
Gate_Square
🏎️ 100% Win! Gate Square “Share Weekly” Special Topic is Ongoing!
💰️ Post with hashtags for red packets, Up to 2 USDT per user!
Up to 100 USDT on the weekly leaderboard!
📌 How to Join
1️⃣ Register: https://www.gate.com/campaigns/6244
2️⃣ Post with #ShareWeekly and #GateXRedBullWinsSingaporeGP
💬 Topic
Max takes his 73rd career win at Marina Bay! Gate celebrates this F1 milestone with Red Bull Racing.
💡 Share Your Thoughts
1️⃣ How do you rate Max’s performance?
2️⃣ What F1 × Web3 ideas would you like to see from Gate?
Limited red packets, first come, first served!
👉 https://www.gate.com/post/topic/GateXRedBullWinsSingaporeGP?topic_id=205782
repost-content-media
  • 9
$MSFT ‌
📈 Microsoft has reclaimed a $4 trillion market cap, bringing the number of companies above that threshold to four.
The milestone was reached on Monday, roughly a year after the company first crossed it in July 2025. The move follows the unveiling of Microsoft's next-generation Maia 300 AI chip, which the company says can handle more useful computing per megawatt than leading GPU-based systems.
⚖️ The $4 trillion club:
• Nvidia: ~$5.47T
• Apple: ~$4.96T
• Alphabet (Google): ~$4.26T
• Microsoft: ~$4.00T
All four are technology companies, and AI-related demand has been a central driver
User_any
$MSFT ‌
📈 Microsoft has reclaimed a $4 trillion market cap, bringing the number of companies above that threshold to four.
The milestone was reached on Monday, roughly a year after the company first crossed it in July 2025. The move follows the unveiling of Microsoft's next-generation Maia 300 AI chip, which the company says can handle more useful computing per megawatt than leading GPU-based systems.
⚖️ The $4 trillion club:
• Nvidia: ~$5.47T
• Apple: ~$4.96T
• Alphabet (Google): ~$4.26T
• Microsoft: ~$4.00T
All four are technology companies, and AI-related demand has been a central driver of their valuation gains. Microsoft's return to the threshold reflects renewed confidence in its AI and cloud strategy after a period of investor caution around hyperscaler spending.
When four of the world's largest companies are all in the same sector, what does that concentration mean for the broader market? 👇
#MSFT #AI #GateSquare #BigTech
Not financial advice.
repost-content-media
MSFT+1.04%
NVDA-1.92%
AAPL-0.31%
GOOGL+0.37%
  • 18
#CRCLandCOINCantherallyspread?
Can Market Strength Spread from Crypto Stocks ($CRCL,$COIN) to the Broader Sector?
The rally in public crypto-adjacent equities serves as an essential liquidity indicator, but a broader sector-wide rally depends on specific conditions:
* Why Equities Lead First: Institutional investors often gain crypto exposure via regulated equity markets ($COIN, Bitcoin/Ethereum ETFs, infrastructure stocks) before rotating directly into liquid altcoins. Strong earnings or valuation expansion in equity markets signals institutional risk-on sentiment.
A market report from Octo
ybaser
#CRCLandCOINCantherallyspread?
Can Market Strength Spread from Crypto Stocks ($CRCL ,$COIN ) to the Broader Sector?
The rally in public crypto-adjacent equities serves as an essential liquidity indicator, but a broader sector-wide rally depends on specific conditions:
* Why Equities Lead First: Institutional investors often gain crypto exposure via regulated equity markets ($COIN, Bitcoin/Ethereum ETFs, infrastructure stocks) before rotating directly into liquid altcoins. Strong earnings or valuation expansion in equity markets signals institutional risk-on sentiment.
A market report from October 9 offers a useful example: following participation in a funding round, CRCL rose approximately 7% and COIN about 6%. The same report noted that crypto-linked businesses outperformed both Bitcoin and broader stock indices during that session.
* Key Drivers to Spread Strength:
1. Flow Transition from Equity to Spot/Derivatives: Profits from crypto stocks usually re-enter decentralized protocols and native tokens once institutional capital seeks higher beta returns.
2. Regulatory Clarity & Stablecoin Expansion: Strong performance in balance-sheet crypto companies typically coincides with increased stablecoin market capitalization, driving systemic liquidity for the broader ecosystem.
3. Macro Headwinds vs. On-Chain Metrics: Stock momentum can broaden to layer-1s and altcoins provided macro yields stabilize and key on-chain metrics (active addresses, total value locked) align with price action.
Could the rally spread? Yes, but confirmation is key.
Three factors could support a broader move:
Bitcoin strength: A sustained recovery in major crypto assets could boost sentiment toward exchanges, miners, and other crypto-related businesses.
Trading volume: Higher spot and derivatives trading activity could benefit other trading-focused platforms.
Stablecoin adoption: Continued growth in USDC usage could support CRCL’s business, alongside factors like reserve income and interest rates.
Risks are equally significant. Rising Treasury yields, regulatory hurdles, or weak trading activity could quickly reverse gains from a short-term spike. Recent reports have also highlighted macroeconomic pressures weighing on crypto assets and related stocks.
Bottom line: While the strength of CRCL and COIN signals encouraging sentiment, it is not yet proof of a sustained, sector-wide rally. Before interpreting the move as a confirmation, monitor Bitcoin's trend, trading volumes, relative performance across crypto stocks, and the broader interest rate environment.
‍$CRCL $COIN
repost-content-media
CRCL+9.26%
COIN+6.35%
BTC+0.94%
ETH+1.67%
USDC-0.01%
  • 26
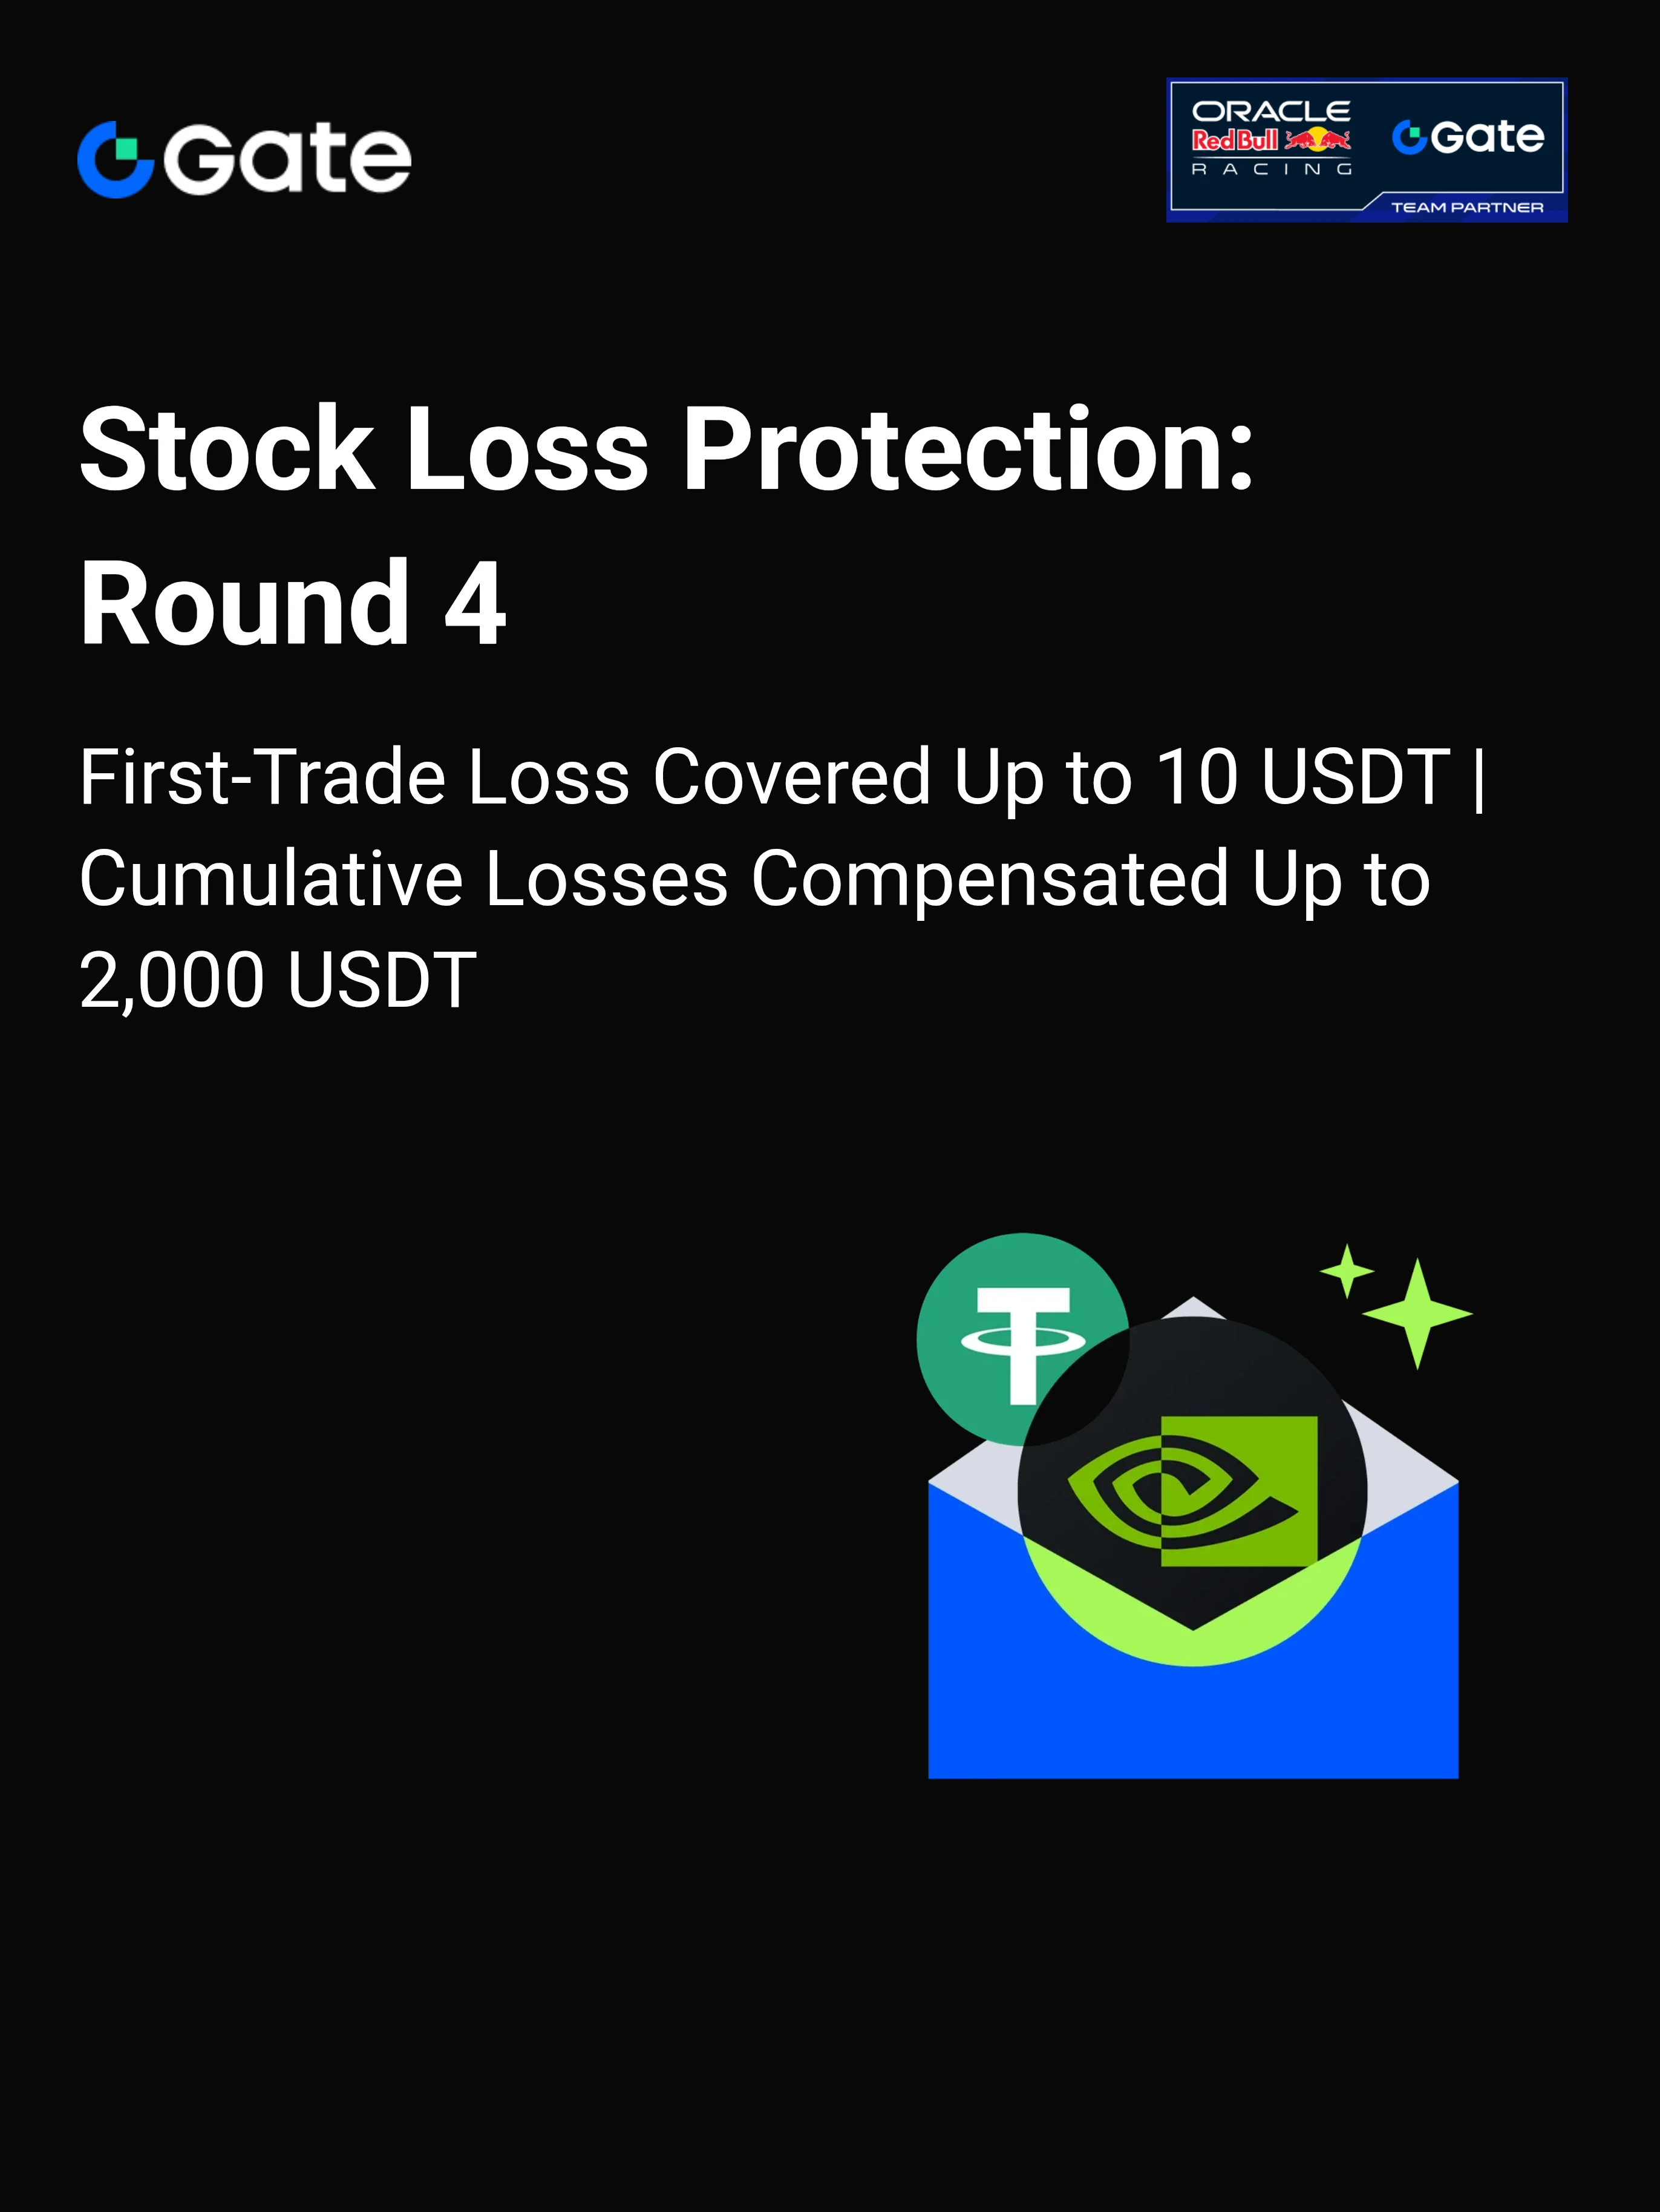
First-Trade Loss Covered Up to 10 USDT | Cumulative Losses Compensated Up to 2,000 USDT https://www.gate.com/campaigns/6480?ref=UQdAUAwJ&ref_type=132
post-image
  • 23
I've joined Gate #WCTCS9 . Join now, trade global assets, and share in 6,000,000 USDT with me! https://www.gate.com/competition/wctc-s9?ref_type=165&utm_cmp=tgv0wayw&ref=UQdAUAwJ
post-image
  • 21
🏆 WCTC S9 Plaza Carnival kicks off
Form teams · Show off your results · Discuss strategies, and share the 50,000 USDT prize pool + GT rewards
Team recruitment is now open—where are your teammates? 📣
Come to Gate Square and post a team recruitment card with #WCTCS9 , discuss your team manifesto, and share how to join so more traders can find your team.
✨ High-quality recruitment content may receive featured recommendations and additional traffic support, helping your team gain more exposure.
Once the competition officially begins, there will also be trading results showcases and daily trading
GateSquare
🏆 WCTC S9 Plaza Carnival kicks off
Form teams · Show off your results · Discuss strategies, and share the 50,000 USDT prize pool + GT rewards
Team recruitment is now open—where are your teammates? 📣
Come to Gate Square and post a team recruitment card with #WCTCS9 , discuss your team manifesto, and share how to join so more traders can find your team.
✨ High-quality recruitment content may receive featured recommendations and additional traffic support, helping your team gain more exposure.
Once the competition officially begins, there will also be trading results showcases and daily trading insights challenges, with GT, position experience vouchers, Gate merchandise, and more waiting for you to win.
👇 Come to Square first and gather more teammates for your team
👉Join now: https://www.gate.com/campaigns/6559.
repost-content-media
GT+0.09%
  • 17
50,000 XRP Airdrop Boost: Earn 3 XRP per Referral and More with Every Invite https://www.gate.com/campaigns/6435?ref=UQdAUAwJ&ref_type=132&utm_cmp=74u0sizB
post-image
  • 16
#BTC回调触及81000美元
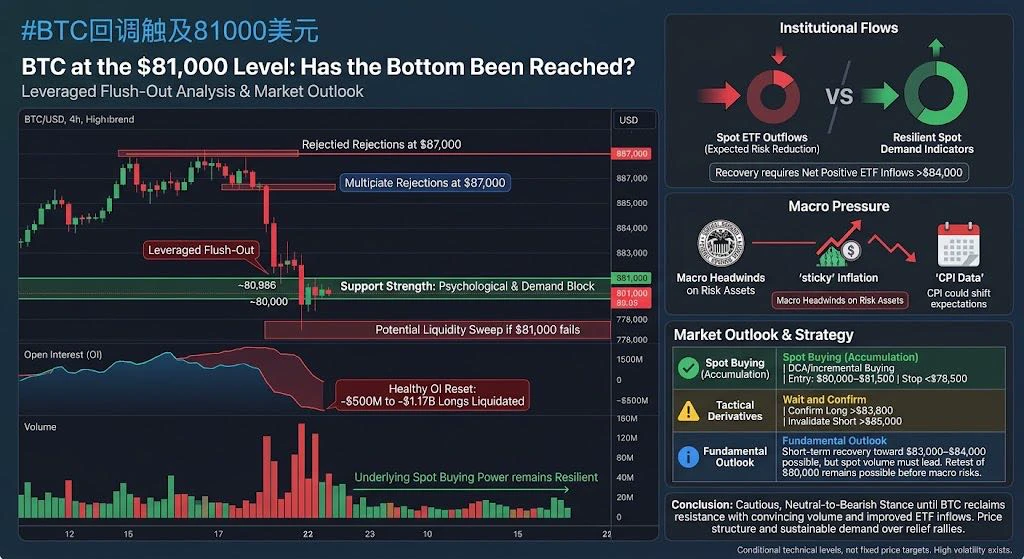
BTC at the $81,000 Level: Has the Bottom Been Reached?
In my view, the $81,000 level could serve as a short-term support zone; however, a single recovery is not enough to confirm that the market has bottomed out. The decisive factor is whether BTC can sustain its recovery or if sellers will regain control near the resistance level.
The current market structure in the $81,000–$82,000 range points to a textbook "leveraged flush-out" rather than a fundamental structural collapse. The market had become heavily weighted toward long positions following multiple rejections at the $87
ybaser
#BTC回调触及81000美元
BTC at the $81,000 Level: Has the Bottom Been Reached?
In my view, the $81,000 level could serve as a short-term support zone; however, a single recovery is not enough to confirm that the market has bottomed out. The decisive factor is whether BTC can sustain its recovery or if sellers will regain control near the resistance level.
The current market structure in the $81,000–$82,000 range points to a textbook "leveraged flush-out" rather than a fundamental structural collapse. The market had become heavily weighted toward long positions following multiple rejections at the $87,000 resistance level; this created a cluster of stop-loss orders and liquidation points just below the $84,000 mark.
1. Support Strength: $81,000 and $80,000
* Current Zone: The drop to the ~$80,986 level triggered the liquidation of over-leveraged long positions ranging from $500 million to $1.17 billion. Such sudden, vertical moves typically signal a local bottom in the derivatives market rather than a lasting trend reversal.
* Critical Level: The $80,000 level acts as both a significant psychological threshold and a key demand block on higher timeframes. If BTC closes the day below $81,000, a sweep of liquidity in the $78,000–$80,000 zone is likely before a structural bottom forms.
2. Institutional Flows (Spot ETFs and Derivatives Markets)
* ETF outflows during pullbacks are to be expected, as institutional trading desks tend to reduce risk ahead of macro catalysts. However, spot demand indicators reveal that underlying spot buying power remains relatively resilient compared to liquidations in the derivatives market. A genuine recovery cannot be sustained by perpetual swaps alone; reclaiming levels at or above $84,000 requires net positive ETF inflows over consecutive sessions. 3. Macro Pressure and Fed Expectations
* The Fed's hawkish rhetoric and expectations that inflation will remain sticky (ahead of CPI data) continue to exert pressure on risk assets.
* The expectation that interest rates will remain high for an extended period limits short-term upward momentum. Until there is macro clarity, any attempts to rally toward the $87,000–$90,000 range are likely to face strong selling pressure (supply walls). Market Outlook and Strategic Positioning
Spot Buying (Accumulation) DCA / Incremental Buying The long-term macro structure remains intact above the $78,000 level. Pullbacks driven by liquidations offer market entry opportunities with attractive risk/reward ratios. Staggered buy orders in the $80,000 – $81,50 range.
Tactical Derivatives Trading Wait and Confirm The reset in open interest is a healthy development; however, downside risk persists should CPI data come in higher than expected. Confirmation for "long" positions above $83,800; Invalidation of the "short" scenario above $85,000.
Risk Management Deleveraging High volatility regarding interest rate expectations makes high leverage unfavorable. Maintain stop levels below $78,500 for medium-term positions.
Fundamental Outlook
Testing the $81,000 level served as a necessary deleveraging process. While a short-term recovery toward the $83,000–$84,000 range is underway, confirming a definitive bottom requires observing spot trading volume leading the next upward wave.
The possibility of retesting the $80,000 level prior to macro-driven risks cannot be ruled out; however, gradually entering spot positions within this range remains a solid, risk-adjusted thesis for medium- and long-term strategies.
The CPI report could rapidly shift expectations. Avoid assuming that the current price already reflects all possible outcomes. These are not fixed price targets but rather conditional technical levels.
Bottom line: I will maintain a cautious, neutral-to-bearish stance until BTC reclaims the resistance level with convincing volume and ETF inflows improve. For investors considering market entry, scaling in and defining risk upfront is generally more prudent than hinging everything on the assumption that $81,000 is the absolute bottom.
The market does not need to set a new low or rally immediately to confirm a bottom in order to invalidate the bearish thesis. Price structure, liquidity, and sustainable demand are more important than a one-off relief rally.
$BTC ‌
$NAS100 ‌$XBRUSD $MU ‌$NVDA ‌
repost-content-media
BTC+0.94%
NAS100+0.13%
XBRUSD-0.36%
MU+1.93%
NVDA-1.92%
  • 17
  • 1
#Gate净流入1.26亿美元位列行业第三
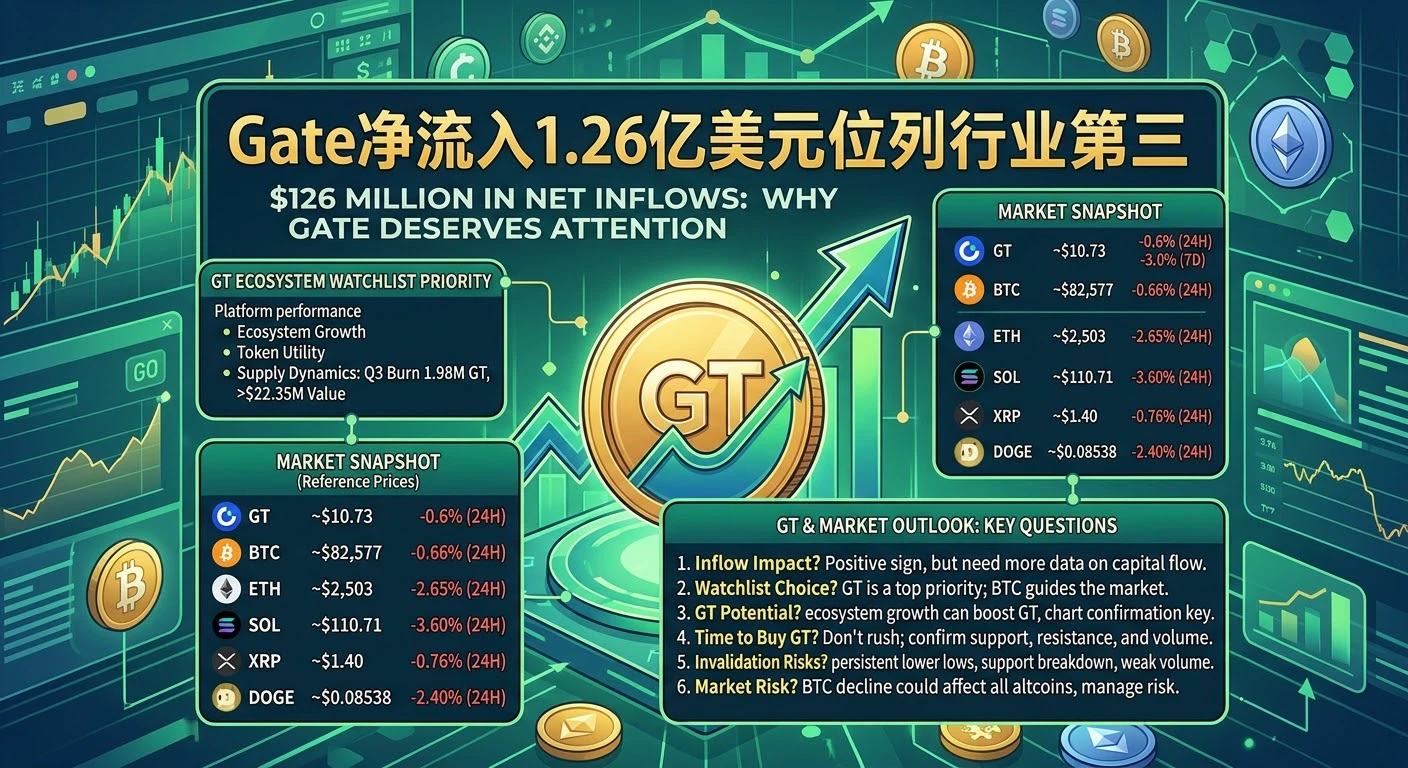
💰 $126 MILLION IN NET INFLOWS: WHY GATE DESERVES ATTENTION AND WHY GT IS MY TOP WATCHLIST PRIORITY
1. 🚀 $126 MILLION IN NET INFLOWS: GATE’S GROWING MOMENTUM
Gate reportedly recorded approximately $126 million in net inflows over the past month, ranking third among centralized exchanges globally. With more than 61 million users across 150+ countries and regions, Gate continues to strengthen its presence in the digital asset industry.
For me, this development deserves attention because capital flows, user adoption, liquidity, and ecosystem growth are important factors w
HighAmbition
#Gate净流入1.26亿美元位列行业第三
💰 $126 MILLION IN NET INFLOWS: WHY GATE DESERVES ATTENTION AND WHY GT IS MY TOP WATCHLIST PRIORITY
1. 🚀 $126 MILLION IN NET INFLOWS: GATE’S GROWING MOMENTUM
Gate reportedly recorded approximately $126 million in net inflows over the past month, ranking third among centralized exchanges globally. With more than 61 million users across 150+ countries and regions, Gate continues to strengthen its presence in the digital asset industry.
For me, this development deserves attention because capital flows, user adoption, liquidity, and ecosystem growth are important factors when evaluating the long-term potential of a crypto platform.
However, exchange-level inflows do not automatically mean that investors are buying GT. The key question is whether Gate’s expansion will generate stronger demand for its native ecosystem token.
My personal focus is GT. I want to see whether ecosystem development, token utility, and supply dynamics translate into sustainable buying pressure rather than temporary market excitement.
2. 💎 WHY GT IS MY TOP WATCHLIST PRIORITY
GateToken (GT) is the native token of GateChain, supporting blockchain gas fees and utility across the broader Gate ecosystem.
I am monitoring GT for four main reasons.
First, ecosystem expansion. As Gate grows its global user base and financial services, increased activity could create additional opportunities for GT utility.
Second, token burns. Reported Q3 2026 figures indicate that approximately 1,987,321 GT was burned, valued at more than $22.35 million. Cumulative burns reportedly reached approximately 191.93 million GT, representing around 63.98% of the original 300 million GT supply.
This is a significant supply-related development. However, reduced supply alone cannot guarantee price appreciation. Sustainable demand, liquidity, and market sentiment remain essential.
Third, market recognition. Gate’s reported inflows and growing user base make its ecosystem worth watching, although these figures do not independently confirm increased GT purchases.
Fourth, long-term potential. I evaluate GT through ecosystem growth, token utility, supply changes, and technical price confirmation.
My outlook is cautiously bullish on GT’s longer-term potential, provided that these factors strengthen together. For short-term trading, I still want confirmation from price action and volume.
3. 📊 MARKET SNAPSHOT: GT, BTC, AND MAJOR ALTCOINS
The following figures are reference market snapshots for October 9, 2026, and may have changed. They should not be treated as verified live prices.
GateToken (GT)
Price: approximately $10.73
24-hour change: -0.6%
7-day change: -3.0%
Market capitalization: approximately $1.12 billion
24-hour volume: approximately $3.12 million
GT was showing short-term weakness despite positive developments across Gate’s ecosystem. I want to see price stabilization, stronger spot volume, and a confirmed resistance breakout before considering the recovery technically convincing.
Bitcoin (BTC)
Price: approximately $82,577
24-hour change: -0.66%
7-day change: -2.45%
Market capitalization: approximately $1.65 trillion
Ethereum (ETH)
Price: approximately $2,503
24-hour change: -2.65%
7-day change: -7.22%
Solana (SOL)
Price: approximately $110.71
24-hour change: -3.60%
7-day change: -10.60%
XRP
Price: approximately $1.40
24-hour change: -0.76%
7-day change: -6.40%
Dogecoin (DOGE)
Price: approximately $0.08538
24-hour change: -2.40%
7-day change: -11.90%
These snapshots show weakness across several major altcoins, especially on a seven-day basis. SOL declined 10.60%, DOGE fell 11.90%, and ETH lost 7.22% over the reported week.
My interpretation is that the broader market still needs stronger recovery signals. Gate’s reported inflows are encouraging platform-level news, but they do not prove that the overall crypto market is ready for a sustained rally.
BTC’s direction, liquidity, trading volume, and market structure remain important indicators for GT and other altcoins.
4. 🔥 MY GT TRADING VIEW: BULLISH POTENTIAL WITH CONFIRMATION
My approach is cautiously bullish on GT’s long-term potential, but I will not buy simply because Gate ranked third in reported net inflows.
Scenario A: GT starts recovering
If GT forms higher lows, breaks nearby resistance with increasing spot volume, and successfully retests the breakout level as support, I would consider that a stronger bullish signal.
I would also compare GT’s performance with BTC and other altcoins. Improving relative strength would add confidence to my recovery thesis.
Scenario B: GT remains under pressure
If GT continues making lower lows or breaks important support with rising selling volume, I would reconsider the short-term bullish outlook. Positive ecosystem developments cannot prevent price declines when selling pressure dominates.
Scenario C: Bitcoin falls further
If BTC loses important support, additional market-wide selling could affect GT and other altcoins. In that situation, I would reduce risk and wait for clearer signals instead of entering too early.
My trading principle is straightforward: fundamentals help me identify opportunities, while technical confirmation helps me decide when to enter.
I would not assign fixed targets or stop-loss levels without reliable chart confirmation. Position sizing, liquidity, and risk management remain essential.
5. 💰 WHERE COULD CAPITAL MOVE NEXT?
My watchlist has four main priorities.
First: GT. I want to see whether Gate’s ecosystem expansion, token utility, and supply changes coincide with stronger spot buying and improving price structure. GT remains my preferred ecosystem-focused watchlist asset, but real demand must confirm the thesis.
Second: BTC. Bitcoin remains my primary indicator of overall market direction. A sustained recovery could improve market sentiment, while another breakdown could increase pressure on altcoins.
Third: ETH and SOL. I will monitor trading volume, relative strength, and resistance levels to identify whether these assets are beginning to recover.
Fourth: XRP, DOGE, and emerging narratives. These assets may attract attention during market rotations, but I prefer confirmed price action and liquidity over chasing sudden rallies.
I want to see capital translate into sustainable demand rather than short-lived excitement. That is why I will continue watching actual market behavior instead of assuming that exchange inflows directly benefit a particular token.
6. 🌟 WHY I APPRECIATE GATE’S LONG-TERM DIRECTION
For me, Gate’s progress involves more than one ranking or one monthly inflow report. Its reported user base of more than 61 million, presence across 150+ countries and regions, and continued ecosystem development demonstrate the scale of its ambitions.
I also appreciate the attention given to GT’s token-burning mechanism. The reported Q3 burn of approximately 1.99 million GT and cumulative burns approaching 192 million GT provide important supply-related information for investors.
At the same time, sustainable growth requires security, transparency, reliable services, strong liquidity, and genuine user demand.
I want to see Gate continue strengthening its global position while GT develops greater utility and attracts sustainable market interest. My support for Gate goes hand in hand with disciplined analysis: positive developments matter, but measurable demand and market confirmation matter too.
7. ❓ GATE SQUARE: SEVEN KEY QUESTIONS, MY VIEW
Q1. What does $126 million in net inflows tell us?
It indicates positive net platform-level flows during the reported period. I consider this noteworthy, but further data is needed to identify which assets attracted capital and whether the trend continues.
Q2. Which asset am I watching most closely?
GT is my top ecosystem-focused watchlist asset, while BTC remains my primary indicator of overall market direction.
Q3. Could GT benefit from Gate’s growth?
Potentially. Greater ecosystem activity could support interest in GT, but stronger demand, spot volume, and price confirmation are still necessary.
Q4. Is this the right time to buy GT?
I would not make that decision based on the inflow headline alone. I want to see support holding, resistance breaking, and volume confirming the move.
Q5. What would weaken my bullish outlook?
Persistent lower lows, a decisive support breakdown, weak buying pressure, and continued underperformance would weaken my short-term bullish thesis.
Q6. What is my biggest market risk?
A further BTC decline could trigger additional selling across altcoins. I would manage position sizes carefully, avoid excessive leverage, and never assume that positive exchange news guarantees positive token returns.
Q7. What do I want to see next from Gate?
Continued ecosystem development, transparent reporting, sustainable user growth, strong trading infrastructure, and evidence that GT utility and demand are strengthening over time.
8. 🚀 FINAL CONCLUSION: GATE’S GROWTH AND GT’S OPPORTUNITY
Gate’s reported $126 million in monthly net inflows, third-place industry ranking, 61 million-plus users, and presence across 150+ countries and regions make its progress worth discussing.
My view is that GT deserves special attention as Gate continues developing its ecosystem. Its utility, token-burning mechanism, and potential relationship with platform growth provide several factors worth monitoring.
At the reference price of approximately $10.73, with a reported 24-hour decline of 0.6% and a seven-day decline of 3.0%, GT was not showing an unambiguous short-term breakout in the snapshot used here.
Therefore, I remain selectively bullish on GT’s longer-term potential while waiting for stronger technical confirmation. I want to see Gate continue growing, GT attract sustainable demand, and positive ecosystem developments translate into real market activity.
.
#Gate净流入1.26亿美元位列行业第三
repost-content-media
  • 17
#SamsungQ3OperatingProfitSurges782.5%
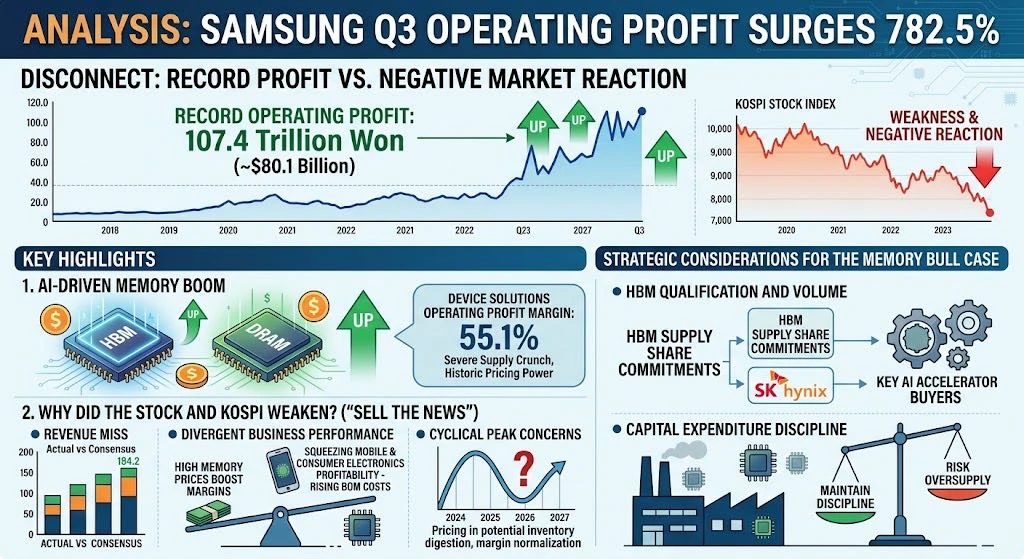
The disconnect between Samsung's record profit of 107.4 trillion won (~$80.1 billion) and the market's negative reaction illustrates a classic Wall Street dynamic: the clash between concerns over a cyclical peak and strong current fundamental performance.
Key Highlights
1. AI-Driven Memory Boom
* High Bandwidth Memory (HBM) and enterprise DRAM pricing continue to boost profit margins in the Device Solutions division.
* An operating profit margin of 55.1% reflects the severe supply crunch in server DRAM and high-density NAND, as well as the historic pricin
ybaser
#SamsungQ3OperatingProfitSurges782.5%
The disconnect between Samsung's record profit of 107.4 trillion won (~$80.1 billion) and the market's negative reaction illustrates a classic Wall Street dynamic: the clash between concerns over a cyclical peak and strong current fundamental performance.
Key Highlights
1. AI-Driven Memory Boom
* High Bandwidth Memory (HBM) and enterprise DRAM pricing continue to boost profit margins in the Device Solutions division.
* An operating profit margin of 55.1% reflects the severe supply crunch in server DRAM and high-density NAND, as well as the historic pricing power resulting from it.
2. Why Did the Stock and KOSPI Weaken? (The "Sell the News" Trend)
* Revenue Miss: While operating profit exceeded estimates (consensus ~105.7–106 trillion won), total revenue of 195 trillion won fell short of the market consensus (approx. 206.8 trillion won), signaling slowing revenue growth in non-memory segments.
* Divergent Business Performance: High memory prices are directly squeezing profitability in Samsung's Mobile and Consumer Electronics divisions. Rising Bill of Materials (BOM) costs—stemming from internal chip sourcing—are dragging down smartphone profit margins.
* Cyclical Peak Concerns: As markets approach the late-2026/2027 period, they are pricing in potential inventory digestion phases and likely margin normalization for large-scale data center companies.
Strategic Considerations for the Memory Bull Case
* HBM Qualification and Volume: The primary focus of the full earnings call later this month will be HBM supply share commitments to key AI accelerator buyers, particularly in comparison to SK Hynix.
* Capital Expenditure Discipline: Whether memory manufacturers can maintain capital expenditure discipline or risk oversupplying DRAM nodes as enterprise AI infrastructure spending undergoes realignment.
$SAMSUNG ‌
$HBM ‌$DRAM ‌
repost-content-media
SK Hynix-11.06%
  • 9
U.S. equities fell sharply on Thursday, with technology and semiconductor shares leading the decline after a Financial Times report indicated that OpenAI's annualized revenue was approximately $20 billion lower than previously signaled. The ChatGPT developer told investors its annualized revenue was nearing $50 billion at the end of September, below the $70 billion figure that had circulated in media reports the prior month. The discrepancy was attributed to differences in how sales to cloud partners were calculated.
The report intensified concerns that the massive spending on artificial intel
User_any
U.S. equities fell sharply on Thursday, with technology and semiconductor shares leading the decline after a Financial Times report indicated that OpenAI's annualized revenue was approximately $20 billion lower than previously signaled. The ChatGPT developer told investors its annualized revenue was nearing $50 billion at the end of September, below the $70 billion figure that had circulated in media reports the prior month. The discrepancy was attributed to differences in how sales to cloud partners were calculated.
The report intensified concerns that the massive spending on artificial intelligence infrastructure may be harder to justify than previously assumed. A selloff in chipmakers sent stocks lower, with equities extending losses after the revenue figure became public. The Nasdaq Composite took a sharp dive in afternoon trading, and the Nasdaq 100 fell as much as 2% as the news circulated. Nvidia, Oracle, and other major AI-linked names came under pressure, and the S&P 500 tech sector led the index's losses.
The scale of the decline drew attention to the concentration of market gains in a small group of AI-related companies. The S&P 500 and Nasdaq had both reached record highs earlier in the month, driven largely by expectations for continued growth in artificial intelligence spending. When a single data point challenges the revenue assumptions behind that spending, the effect is amplified because so much of the index's value is tied to the same theme. The $500 billion figure cited in market reports reflects the aggregate decline in U.S. equity value on the day.
It is worth noting what the revenue discrepancy does and does not represent. OpenAI's annualized revenue of roughly $50 billion is still a substantial figure, and the company remains one of the largest AI developers in the world. The gap between the two numbers reflects a methodological difference in how revenue from cloud partnerships is accounted for, rather than a sudden collapse in demand. The market's reaction was driven by the uncertainty that such a large discrepancy creates, not by evidence that AI spending is declining. Investors had been pricing in a specific growth trajectory, and the report suggested that trajectory may be less certain than assumed.
The broader macro backdrop has also been a factor in recent market volatility. The 10-year Treasury yield remains near multi-decade highs above 5.3%, and the Federal Reserve's September meeting minutes signaled that another rate hike before year-end could be appropriate. When the risk-free rate is that elevated, the discount rate applied to future earnings rises, and high-growth sectors are more sensitive to changes in that rate. That dynamic makes the market more reactive to news that questions the earnings assumptions underlying those valuations.
The next data point to watch is the October 14 Consumer Price Index release, which will provide fresh information on the inflation trajectory and, by extension, the path for interest rates. The AI trade and the rate outlook have become intertwined, and any shift in either will affect the other. For now, the market has repriced some of the enthusiasm that had driven the record highs, and the durability of that repricing will depend on whether the revenue figures that sparked it are revised or confirmed in the weeks ahead.
This article is not investment advice. Analysis is based on publicly available information and does not guarantee future outcomes.
$US30 $NAS100 $SNDK $NVDA $MU
#PlanYourTradesThisWeek #ShareWeekly #布局本周交易 #布局本周交易
repost-content-media
NVDA-1.92%
ORCL+2.98%
MU+1.93%
SNDK-0.56%
NAS100+0.13%
  • 18
  • 1
📚 Nice profit! How did you catch it? Tell us more.
After showing your gains, do people in the comments always ask, “How did you buy?” “Why did you sell?”

💡 Share a little more when you post:
• What signal made you enter?
• How did you adjust when the market changed?
• If you did it again, what would you do differently?

Show your gains and your strategy—give everyone something to learn and discuss!
👉 Share on Gate Square: https://www.gate.com/post
GateSquare
📚 Nice profit! How did you catch it? Tell us more.
After showing your gains, do people in the comments always ask, “How did you buy?” “Why did you sell?”

💡 Share a little more when you post:
• What signal made you enter?
• How did you adjust when the market changed?
• If you did it again, what would you do differently?

Show your gains and your strategy—give everyone something to learn and discuss!
👉 Share on Gate Square: https://www.gate.com/post
repost-content-media
  • 6
  • 1
#OneGate见证计划 #美联储会议纪要将公布 Fed minutes to be released tonight: How many rate hikes are hidden in Waller’s remark that it is “hard to characterize [policy] as restrictive”?
Is a 25-basis-point hike in September just the beginning? The minutes may reveal how the Fed determines “just how tight policy really is.” One sentence from Waller has left a key question hanging.
Why the word “restrictive” has become so important
First, let’s explain what “restrictive policy” means.
Simply put, it means interest rates are high enough to suppress demand and bring inflation down. If policy is truly restrictive,
ThisIsTranslateContent:
#OneGate见证计划 #美联储会议纪要将公布 Fed minutes to be released tonight: How many rate hikes are hidden in Waller’s remark that it is “hard to characterize [policy] as restrictive”?
Is a 25-basis-point hike in September just the beginning? The minutes may reveal how the Fed determines “just how tight policy really is.” One sentence from Waller has left a key question hanging.
Why the word “restrictive” has become so important
First, let’s explain what “restrictive policy” means.
Simply put, it means interest rates are high enough to suppress demand and bring inflation down. If policy is truly restrictive, businesses will reduce borrowing, consumers will cut back on major spending, and the economy will slow noticeably. Conversely, if rates are merely “no longer accommodative” but have not actually tightened the reins, inflation can easily rebound. Waller said it was “hard to characterize [policy] as restrictive,” effectively acknowledging that current rates may still be in the stage of “pulling back from extreme accommodation,” far from the stage of “genuine tightening.” That leaves the market with a huge question mark—if policy is still not tight enough, how much more will rates have to rise?
Financial conditions indicators: Money is still relatively cheap
The market has tried to answer this question with data, but the answer is hardly reassuring. The Chicago Fed National Financial Conditions Index shows that US financial conditions have actually been easing gradually since reaching a peak in the fall of 2022. Although current conditions are not the loosest from a long-term historical perspective, they still lean toward the accommodative side of the historical range.
In other words, money in the US market is still not particularly difficult to borrow.
Now look at the corporate bond market. The option-adjusted spread on the ICE BofA US High Yield Index remains relatively narrow, with only a very small number of periods in history recording lower levels than today. Narrow high-yield spreads mean investors are willing to buy riskier corporate bonds at relatively low premiums, making corporate financing conditions quite accommodative. This points to the same conclusion: financial conditions have not truly “tightened.”
Michael Kramer, founder of Mott Capital Management, noted that if the Fed is indeed watching these indicators, current financial conditions would be difficult to define as restrictive in the strict sense. This also explains why the September rate hike may be just the beginning, rather than a “one-and-done” move.
Real rates are only 50 basis points—where is the “tightness”?
A more intuitive comparison comes from real interest rates.
Some background first. The August PCE data was released only after the September meeting, so the information available for the minutes did not include that report. However, when the BEA released the August data, it also conducted an annual revision, retrospectively adjusting data going back to 2021. After the revision, headline PCE rose 3.4% year over year in August, while core PCE rose 3.0%, both unchanged from July.
Notice one detail: Apart from a short period in 2024 and 2025, headline PCE has almost never fallen below 2.5% since early 2021, and has never reached the 2% target. This means inflation remains a considerable distance from “mission accomplished.” Now let’s do the math. The current effective federal funds rate is about 3.9%. Based on headline PCE, the real federal funds rate is only about 50 basis points; even based on core PCE, it is only around 90 basis points. Real rates of 50 to 90 basis points are hardly “tight” by historical standards.
Waller himself should be highly sensitive to this. In mid-2006, he served as a Federal Reserve governor. At the time, headline PCE inflation was about 3.3% to 3.5%, roughly comparable to today’s level. But the real federal funds rate was then about 1.5% to 2.0%; by October 2006, as inflation gradually declined, the real rate had risen further to 3.6%. In other words, with inflation at similar levels, the current real rate is more than 300 basis points below where it was during Waller’s mid-2006 tenure. Even compared with earlier levels in 2006, the gap remains enormous. This is why Waller said it was “hard to characterize [policy] as restrictive”—he was not being polite; he was stating a data-based fact.
What may be hidden in the minutes
Kramer believes the most important thing to watch in the minutes is not why the Fed raised rates by 25 basis points in September—that decision itself has already been announced. What truly requires close reading is how officials discuss financial conditions, real interest rates, and the pace of disinflation. Three questions are worth keeping in mind while reading the minutes:
First, how quickly does the Fed want inflation to return to 2%? If the minutes show disagreement among officials over “patiently allowing inflation to decline slowly,” that would indicate internal expectations for how long tightening should continue are not aligned. Second, do officials believe current policy is already sufficiently restrictive? If the minutes match the tone of Waller’s press conference and repeatedly emphasize that “financial conditions remain relatively accommodative,” it can basically be inferred that further action lies ahead.
Third, is the recent rise in market interest rates viewed as a substitute for tightening?
If officials believe that “rising Treasury yields amount to the Fed hiking rates for them,” the likelihood of holding rates steady in December will increase; if they believe the rise in market rates merely reflects inflation expectations, the central bank will still need to act itself.
Of course, the minutes also have limitations: They reflect only the discussion at the September meeting and may not include data released afterward, such as the revised August PCE results and the latest nonfarm payrolls data; they may also lack clear forward guidance. If the minutes use vague language and avoid quantifying how “restrictive” policy is, the market may continue to speculate.
What this means for the market
The minutes released early today are essentially a reference point for the market to reprice.
If the minutes acknowledge that “financial conditions remain accommodative, real rates are low, and further observation is needed,” pricing for another rate hike in December will gain support, Treasury yields may rise again, the dollar may strengthen, and gold and growth stocks may come under pressure.
If the minutes emphasize that “the recent rise in long-term yields has automatically tightened financial conditions,” that would leave the door open to pausing rate hikes. The market may interpret it as dovish, with Treasury yields falling, the dollar weakening, and precious metals and equity assets getting some breathing room.
The most subtle scenario is that the minutes neither commit to further rate hikes nor signal an end, emphasizing only data dependence.
In that case, the market will turn its attention to the subsequent CPI, nonfarm payrolls, and geopolitical developments, while the minutes themselves can provide only short-term volatility.
Based on current market pricing, expectations for a December rate hike remain above 50%, but voices saying that “September was just the beginning” are also growing louder. The minutes will become the most important “signpost” before the next directional decision.
repost-content-media
  • 16
  • 1
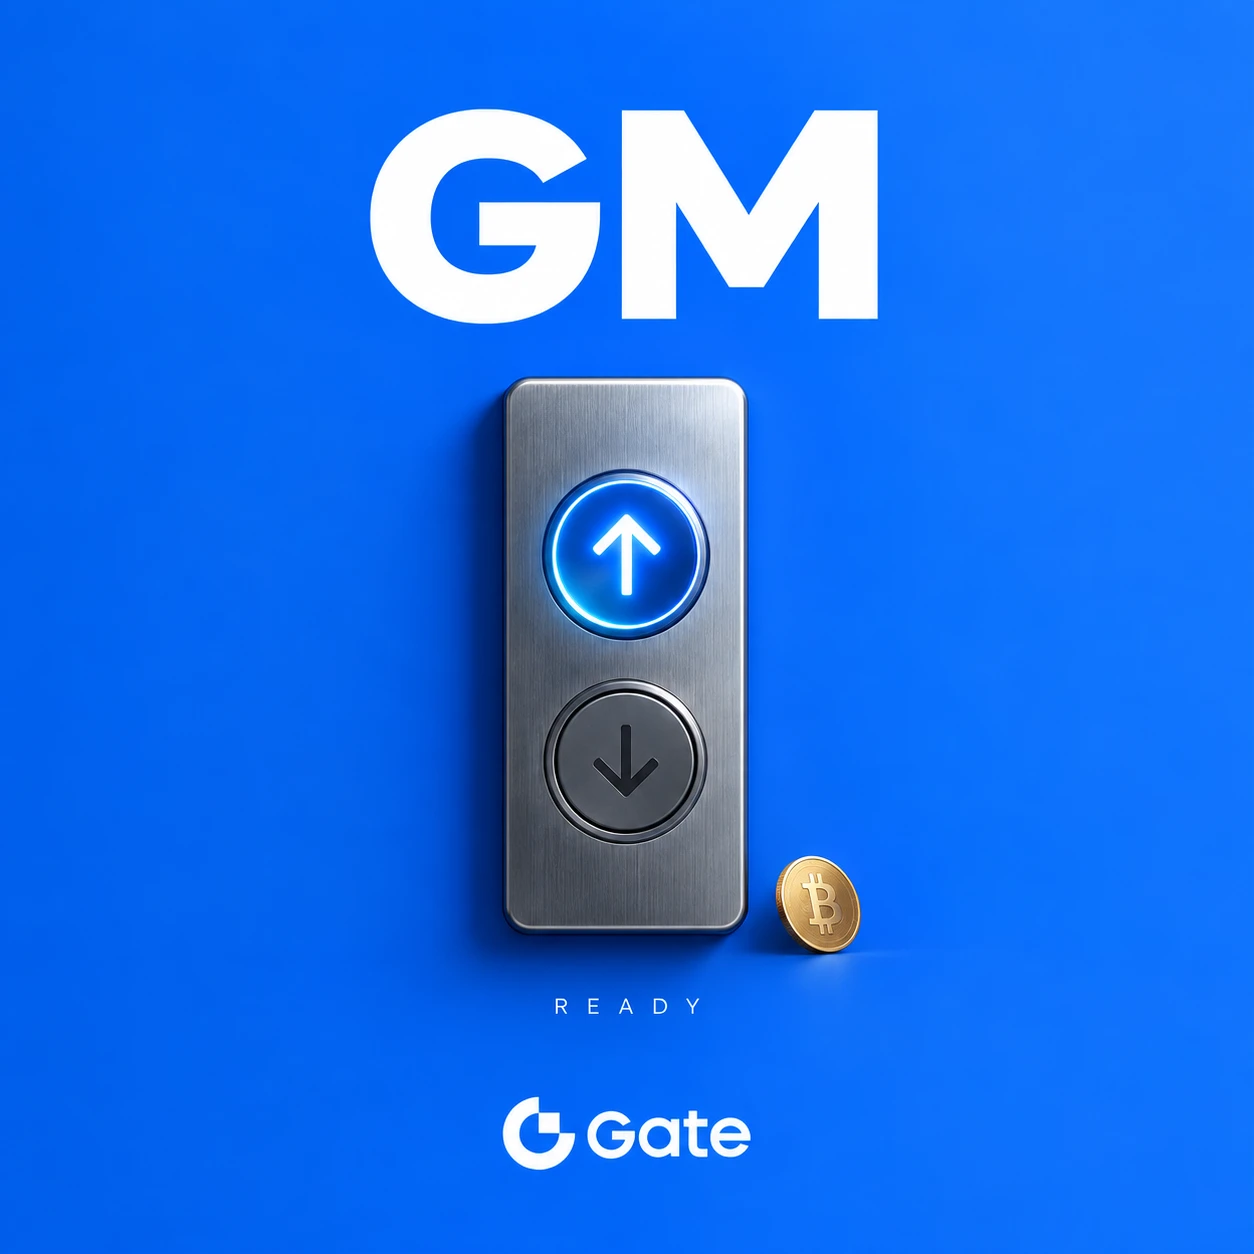
☀️ GM! The up arrow is lit—how are you planning to move today? 👀
📌 Topic of the day: With this market move, are you pressing the up arrow or continuing to observe?
You can talk about:
- Are you more bullish on further upside now, or waiting for the right moment
- Which direction or opportunity you’re watching most closely next
- Is your plan today to make a move, stay on the sidelines, or continue holding
✨ If you have a view, it’s worth sharing.
Come to Gate Square and share your perspective. High-quality content may be featured and receive additional traffic support.
👇 Press your directio
GateSquare
☀️ GM! The up arrow is lit—how are you planning to move today? 👀
📌 Topic of the day: With this market move, are you pressing the up arrow or continuing to observe?
You can talk about:
- Are you more bullish on further upside now, or waiting for the right moment
- Which direction or opportunity you’re watching most closely next
- Is your plan today to make a move, stay on the sidelines, or continue holding
✨ If you have a view, it’s worth sharing.
Come to Gate Square and share your perspective. High-quality content may be featured and receive additional traffic support.
👇 Press your direction:
https://www.gate.com/post
repost-content-media
  • 9
The U.S. services sector didn't just grow in September. It grew at the fastest pace in more than four years, and the details inside the report tell a story that is more complicated than the headline number suggests. The S&P Global U.S. Services PMI came in at 58.8 for September, up sharply from 56.5 in August and slightly above the 58.7 flash estimate. The Composite PMI, which tracks both manufacturing and services, held at 58.4, matching the flash reading and marking the strongest expansion in private-sector business activity in over five years. Readings above 50 indicate growth, and these nu
User_any
The U.S. services sector didn't just grow in September. It grew at the fastest pace in more than four years, and the details inside the report tell a story that is more complicated than the headline number suggests. The S&P Global U.S. Services PMI came in at 58.8 for September, up sharply from 56.5 in August and slightly above the 58.7 flash estimate. The Composite PMI, which tracks both manufacturing and services, held at 58.4, matching the flash reading and marking the strongest expansion in private-sector business activity in over five years. Readings above 50 indicate growth, and these numbers are far above that threshold.
The engine behind the surge was domestic demand. New orders rose at their fastest rate in more than four years, driven primarily by U.S. consumers and businesses rather than by exports. Export orders were a weak spot, particularly in services, as unpredictable tariff policy kept international clients on the sidelines. The strength in domestic demand was enough to offset that drag. Services firms reported one of the strongest output expansions in the survey's history, and all five service categories reported higher activity for the first time in ten months, with transportation and storage returning to growth.
The hiring response was equally striking. Employment increased for a third consecutive month, with job creation reaching its fastest pace since June 2022. The surge in demand strained capacity, and backlogs of uncompleted work rose for the 19th consecutive month. Companies responded by adding staff at a rate not seen in more than four years, which tells you that businesses are treating this demand as durable rather than temporary. Business confidence climbed to a one-year high, reinforcing that view.
Then there is the part of the report that matters most for policy. Input costs accelerated to their fastest pace since October 2022, driven by higher fuel, transportation, and wage costs. The war in Iran pushed oil prices higher, and those costs fed directly into what service providers pay to operate. Businesses passed a portion of those costs on to customers, with selling price inflation rising at its second-fastest pace in just over a year. S&P Global characterized the September signal as being in rate-hike territory.
Chris Williamson, chief business economist at S&P Global Market Intelligence, summarized the tension in the data. He said the surveys pointed to accelerating momentum in the economy, with manufacturing and services data consistent with roughly 4% growth in the third quarter and about 5% growth in September alone. But he also noted that rising orders and confidence had pushed companies to hire at record speed, while price pressures continued to risk keeping inflation above the Fed's 2% target. The combination of fast output growth, supply bottlenecks, elevated energy and logistics costs, and rising selling prices is inflationary, especially in services, where price pressures tend to adjust more slowly.
The Federal Reserve's position is now more complicated. The central bank raised rates by 25 basis points to a range of 3.75% to 4.00% at its September meeting, citing elevated inflation, and projections pointed to a median federal funds rate of 4.1% at year-end, with most policymakers anticipating at least one more increase in 2026. Richmond Fed President Tom Barkin said the risks to inflation outweighed those to maximum employment, pointing to firming conditions and continued consumer strength. The services PMI data reinforces that view. When input costs are rising at their fastest pace in nearly three years and companies are passing those costs through, the case for holding rates steady becomes harder to make, even if growth is strong.
For markets, the strong-growth and higher-cost combination is generally hawkish. It reduces the case for near-term policy easing and can lift expectations for higher interest rates and bond yields. Equities face a mixed picture. Cyclically sensitive companies may benefit from strong activity, but higher rates and input costs can pressure long-duration growth stocks, highly leveraged firms, and housing-related activity. Energy and logistics costs were a major driver of September's input inflation, and those costs can feed quickly into delivered goods, travel, freight, and service prices. Trade policy uncertainty remains a drag on export orders, making domestic demand the key growth engine while raising risks for trade-exposed firms.
The net read is that the U.S. economy entered the fourth quarter with stronger momentum than most forecasters expected, and that momentum is being driven by the domestic consumer rather than by exports or manufacturing. The services sector is hiring, order books are filling, and backlogs are building. But the cost of that growth is rising inflation pressure, and that pressure is now showing up in the prices businesses charge their customers, not just in the costs they pay. The Fed's next move will depend on whether those price pressures persist or fade as energy costs stabilize. For now, the data supports the case for caution rather than easing, and the burden of proof has shifted to the inflation side of the mandate.
This article is not investment advice. Analysis is based on publicly available information and does not guarantee future outcomes.
repost-content-media
  • 11
  • 1
🔥 Gate Square is looking for high-quality creators!
Focus on crypto and stocks, share professional insights, and earn traffic and creator income!
🎁 Exclusive Creator Benefits
1️⃣ High commissions: Earn up to 60% in content mining fee rebates
2️⃣ Generous incentives: $100,000+ monthly certified creator prize pool + $50,000+ exclusive newcomer incentives
3️⃣ Monthly lucky draws: Win high-value vouchers, popular tokens, and exquisite Gate merchandise
4️⃣ Comprehensive support: Homepage recommendations, leaderboard exposure, preferential traffic for newcomers, exclusive communities, and dedicate
GateSquare
🔥 Gate Square is looking for high-quality creators!
Focus on crypto and stocks, share professional insights, and earn traffic and creator income!
🎁 Exclusive Creator Benefits
1️⃣ High commissions: Earn up to 60% in content mining fee rebates
2️⃣ Generous incentives: $100,000+ monthly certified creator prize pool + $50,000+ exclusive newcomer incentives
3️⃣ Monthly lucky draws: Win high-value vouchers, popular tokens, and exquisite Gate merchandise
4️⃣ Comprehensive support: Homepage recommendations, leaderboard exposure, preferential traffic for newcomers, exclusive communities, and dedicated 1-on-1 customer service
Let high-quality content attract its own traffic and make every share more profitable!
👉 Apply to join now: https://www.gate.com/questionnaire/7698
👉 Start your creator journey: https://www.gate.com/post
repost-content-media
  • 26