
Square
Following
Hot
News
Notifications
Profile
Share your thoughts
placeholder
Article
crypto market update
live-cover
LIVE2,192
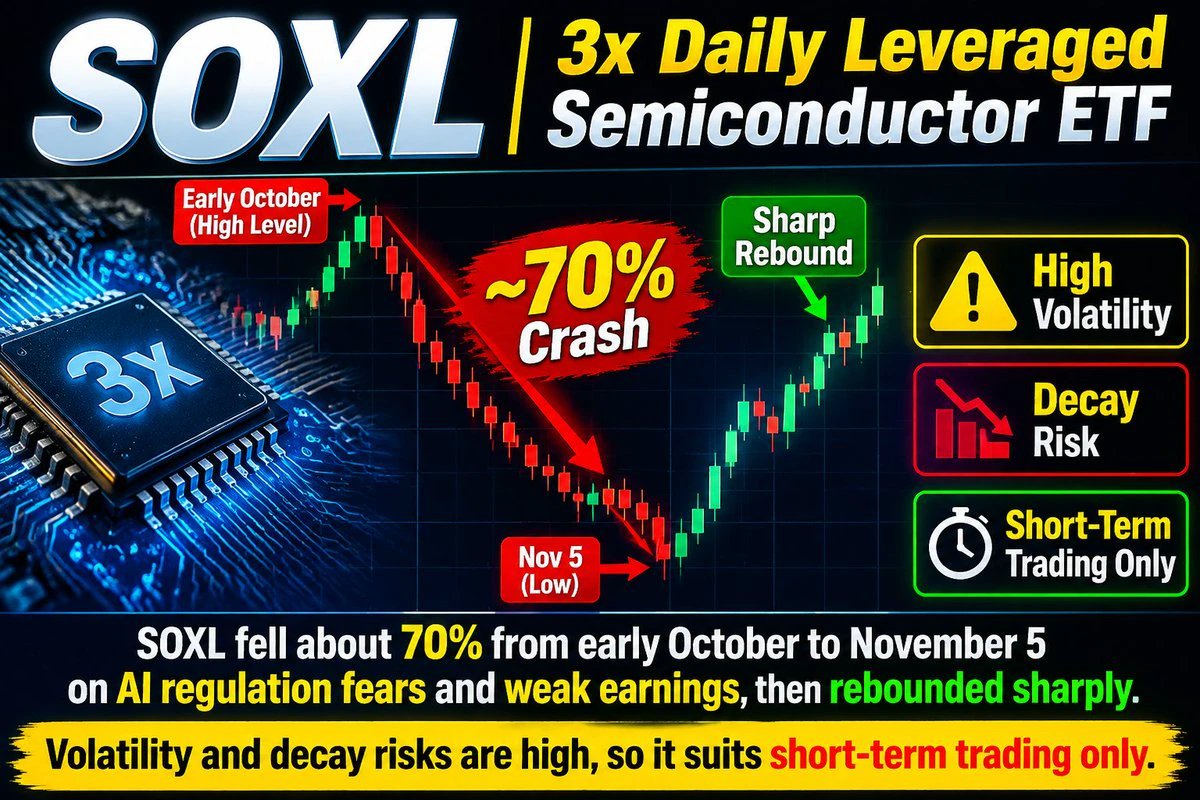
SOXL is a 3x daily leveraged semiconductor ETF. It fell about 70% from early October to November 5 on AI regulation fears and weak earnings, then rebounded sharply. Volatility and decay risks are high, so it suits short-term trading only. $SOXL
post-image
SOXL+22.83%
Trenches
PIEVERSE
P
bade
b
PIEVERSE
0x0e...25a9
Market Cap
$.
Change
.
24h Vol
$.
Holders
.
牛逼
牛
bade
b
牛逼
0x96...7777
Market Cap
$.
Change
.
24h Vol
$.
Holders
.
STONK
S
bade
b
STONK
6GmA...UNgx
Market Cap
$.
Change
.
24h Vol
$.
Holders
.
ON
O
bade
b
ON
0x0e...1d48
Market Cap
$.
Change
.
24h Vol
$.
Holders
.
FLOAT
F
bade
b
FLOAT
Bv1a...BMmr
Market Cap
$.
Change
.
24h Vol
$.
Holders
.
$ETH The current price is 2,093.15, just above the 24-hour low of 2,083.06, with the overall structure leaning bearish. The intraday range was 3.3%, and long and short liquidation volumes were roughly symmetrical. Compared with $4.77 billion in open interest, this movement has barely shaken the positions’ foundations. Although the price is falling, leverage has not been flushed out on a large scale, suggesting this weakness is primarily driven by active selling pressure, with most contract positions still in the market. Since longs have not been forced out, stop-loss orders remain stacked bel
post-image
ETH-1.26%
What Is Trade Expectancy? How Can Win Rate, Average Profit and Loss, and Trading Costs Be Combined in One Formula to Determine Whether a Strategy Is Worth Executing?

In cryptocurrency trading, one profitable trade does not mean a strategy is effective, and one loss does not mean it has failed. What really matters is how much profit each trade can generate on average after repeated execution over the long term. Trade expectancy is an important metric for assessing this.

First, what is trade expectancy?

Trade expectancy is the average expected profit or loss per trade when trading repeatedly
post-image
BTC's morning rebound hit resistance at 75500 and was rejected again. We followed the momentum with a short position, and the market pulled back as expected, capturing over 800 points of movement and netting Luo 4593U!
The strategy was shared in advance, with clear entry levels. Follow the rhythm and lock in steady profits!#Gate全球合规版图扩展 $BTC ‌
BTC-0.65%
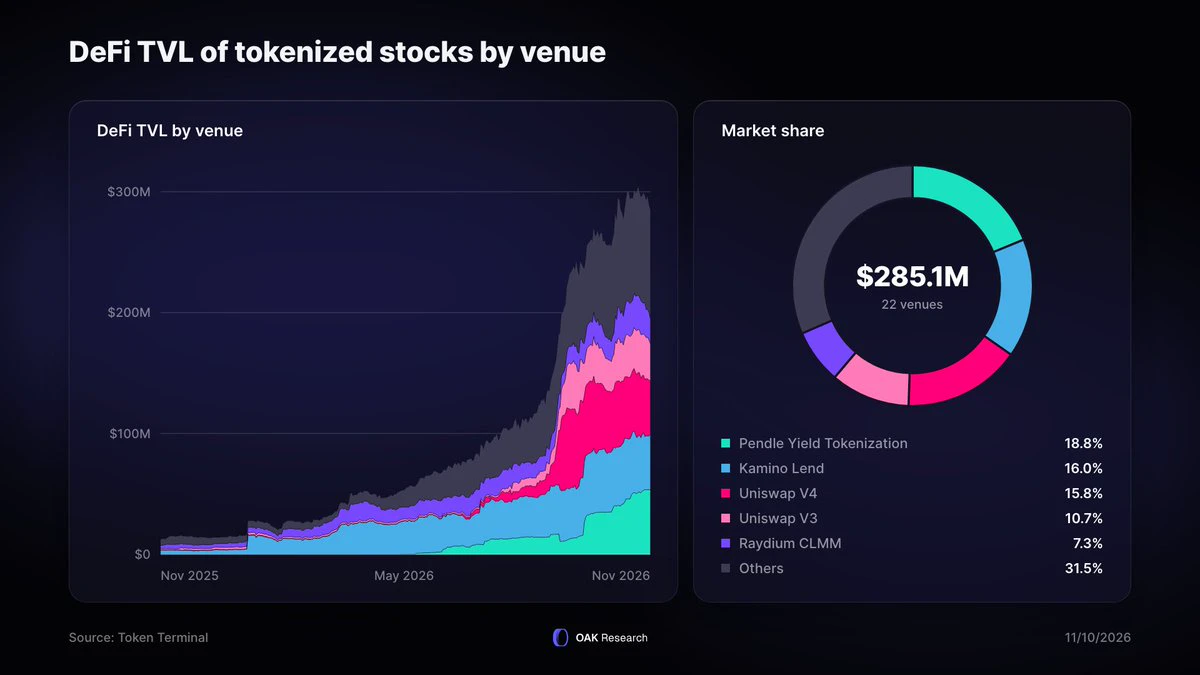
🟣 Tokenized stock TVL in DeFi recently topped $300M, and Pendle is now the leading platform in the sector (with Uniswap V3 and V4 counted separately).
Over the past year, tokenized stock TVL in DeFi has absolutely exploded, rising more than 2,200%. Yet despite that growth, only 6% of existing tokenized stocks are currently deployed in DeFi.
@pendle_fi recently became the platform with the highest TVL in this vertical, with $53.5M today, ahead of @kamino Lend ($45.5M), @Uniswap V4 ($45M) and Uniswap V3 ($30.4M).
In practice, its TVL is almost entirely (99.8%) made up of STRCx, @xStocksFi’s to
post-image
PENDLE-1.93%
UNI+3.05%
KMNO+3.65%
SAFE-5.04%
Me: CPI comes out tonight; just stick to the plan.
Also me: Did it just go up? Should I chase? Why is it dropping again? 😂

VIPs, does anyone else have “a strategy in my head, but my fingers have a mind of their own”?

Having a trading bot to help makes things much easier:
👉 Clearly define in advance what conditions trigger entry, how many batches to execute, and where to take profit or cut losses
👉 Then go to
@Gate_zh
the trading bot, choose a strategy and set the parameters. Once the conditions are met, it executes according to plan, so you’re less likely to change your mind on the spot
post-image
  • 1
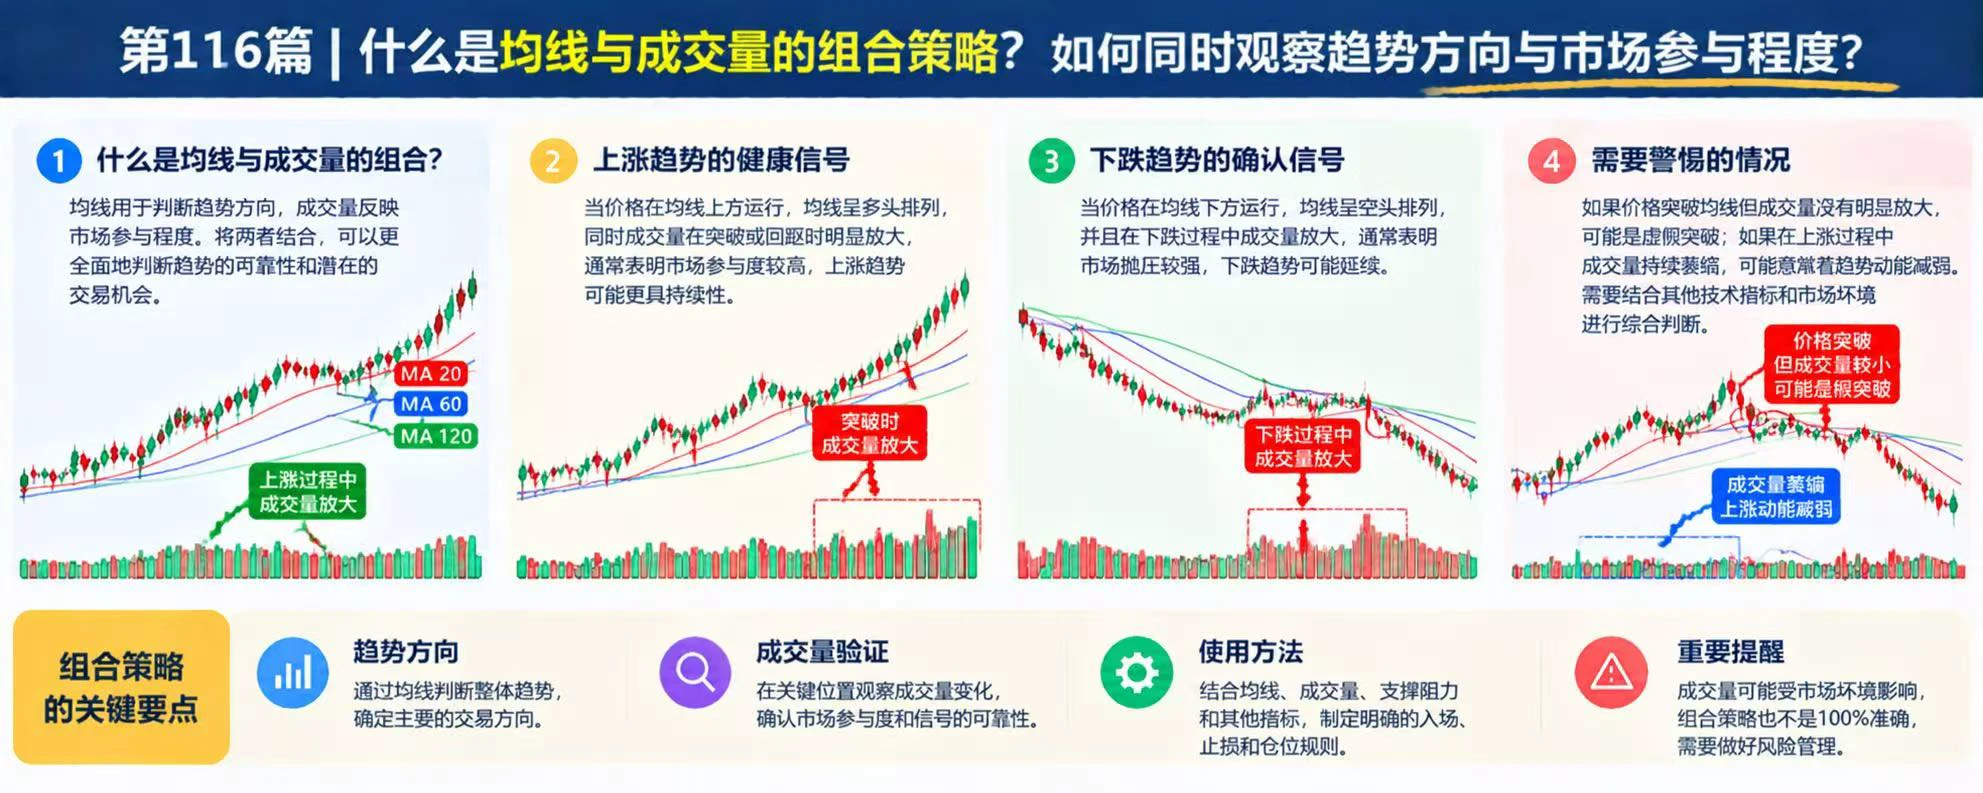
What Is a Moving Average and Volume Combination Strategy? How Can You Observe Trend Direction and Market Participation at the Same Time?

In cryptocurrency trading, rising prices do not necessarily indicate a strong trend, and an upward-sloping moving average does not mean the market cannot reverse. Moving averages (MAs) help assess trend direction, while volume reflects market activity. Combining the two provides a more comprehensive way to assess the credibility of breakouts and trend continuations.

First, what do moving averages and volume each show?

Moving averages smooth historical pric
post-image
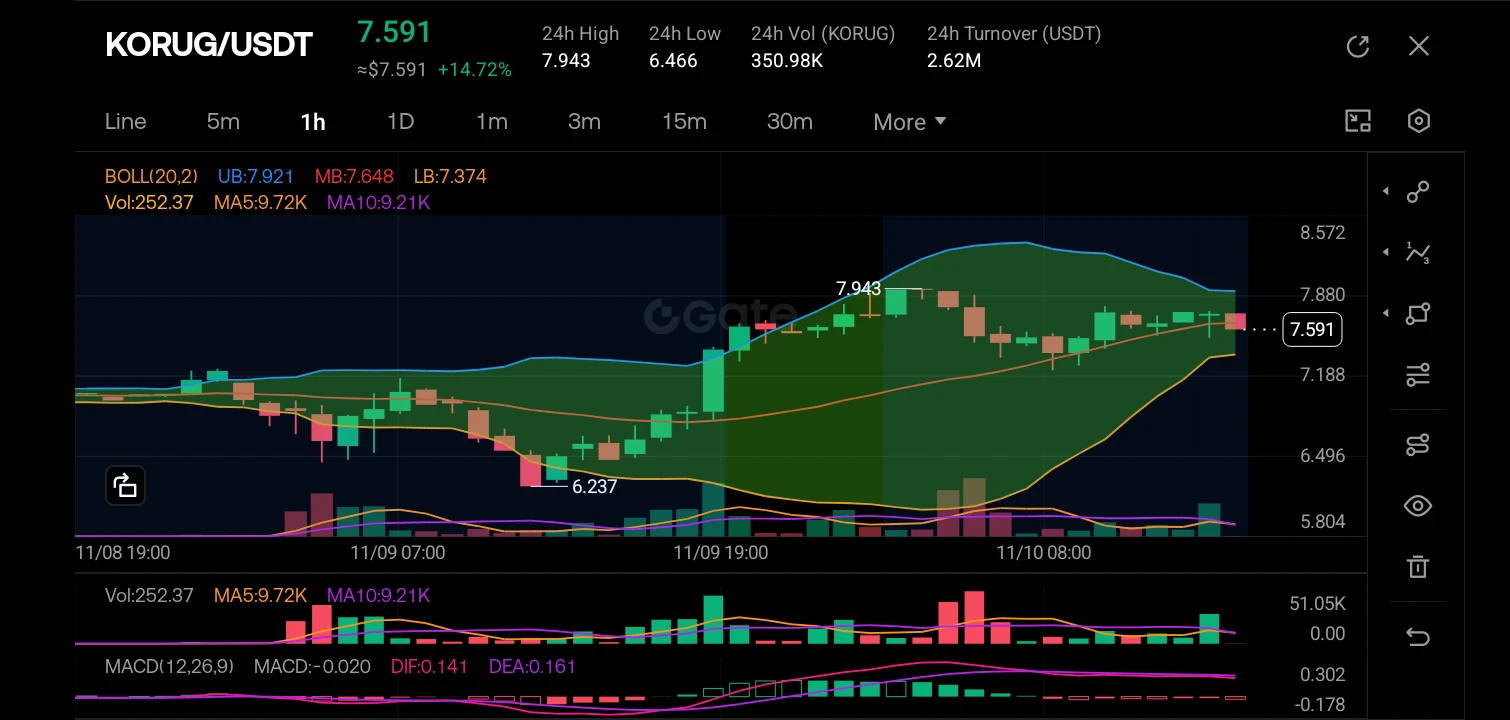
$KORUG ‌
The market structure has recently shifted from a downtrend to a strong bullish momentum, evidenced by the price breaking above the middle Bollinger Band and establishing a higher low around the 6.237 level before aggressively pushing upward to a 24h high of 7.943.

The current price action shows a consolidation phase after a sharp rally; the price is currently trading at 7.591, which is slightly below the upper Bollinger Band (7.921) but well above the middle band (7.648), indicating a bullish bias but with potential for short-term exhaustion as the candles transition from strong gre
post-image
KORUG-0.98%
  • 3
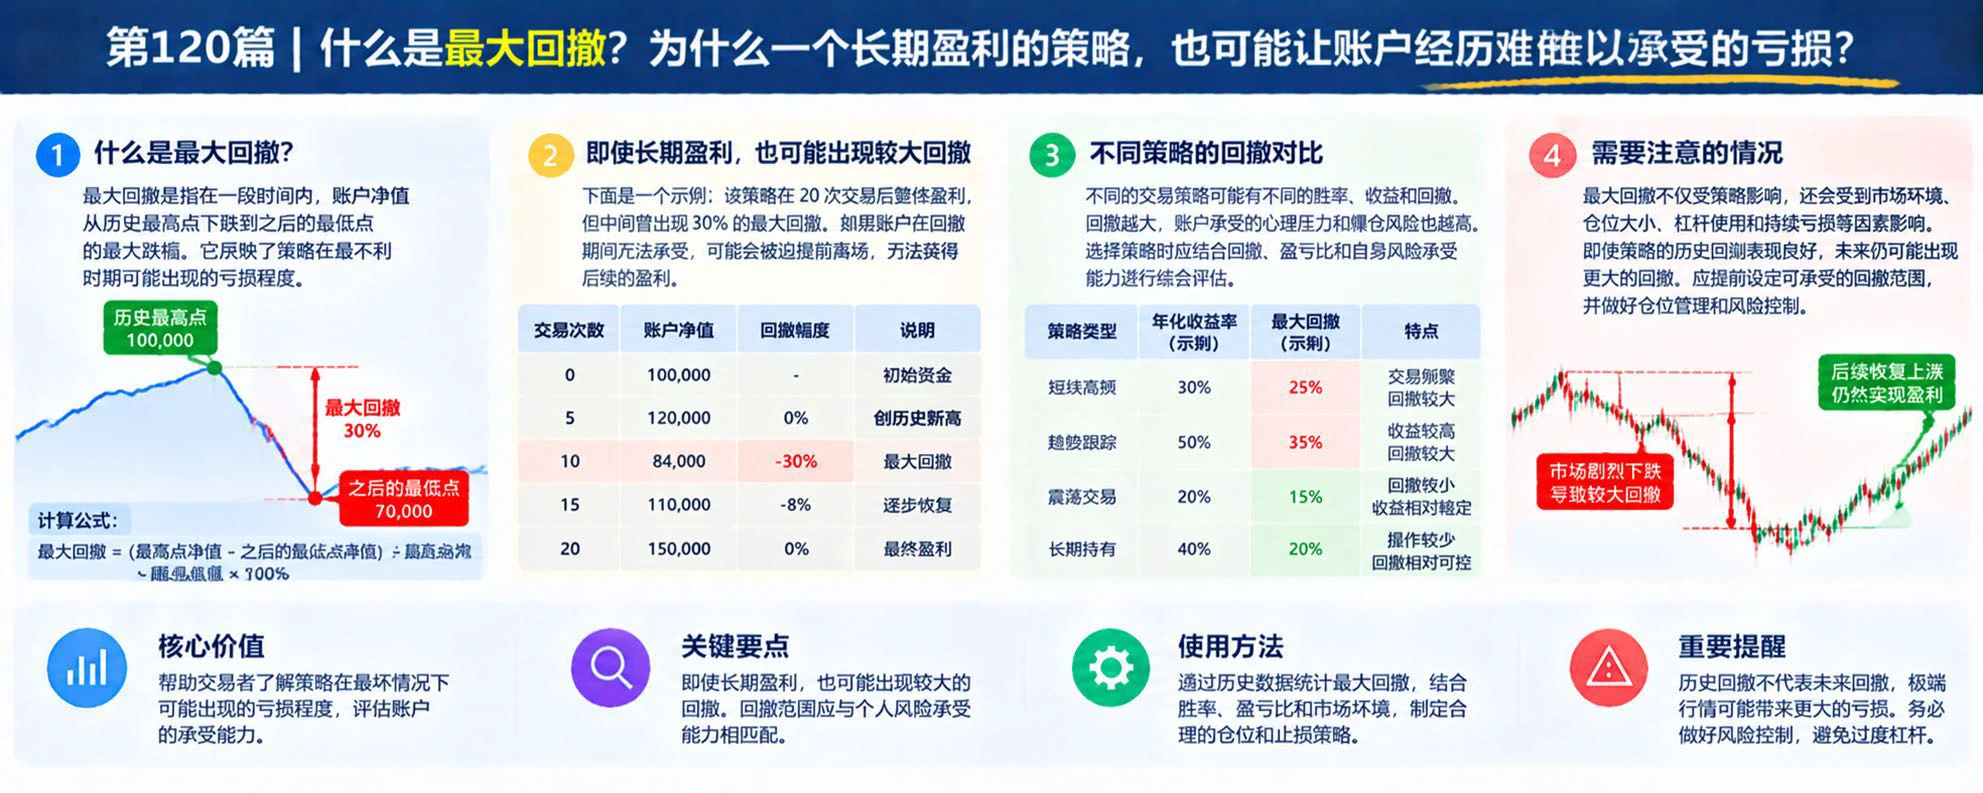
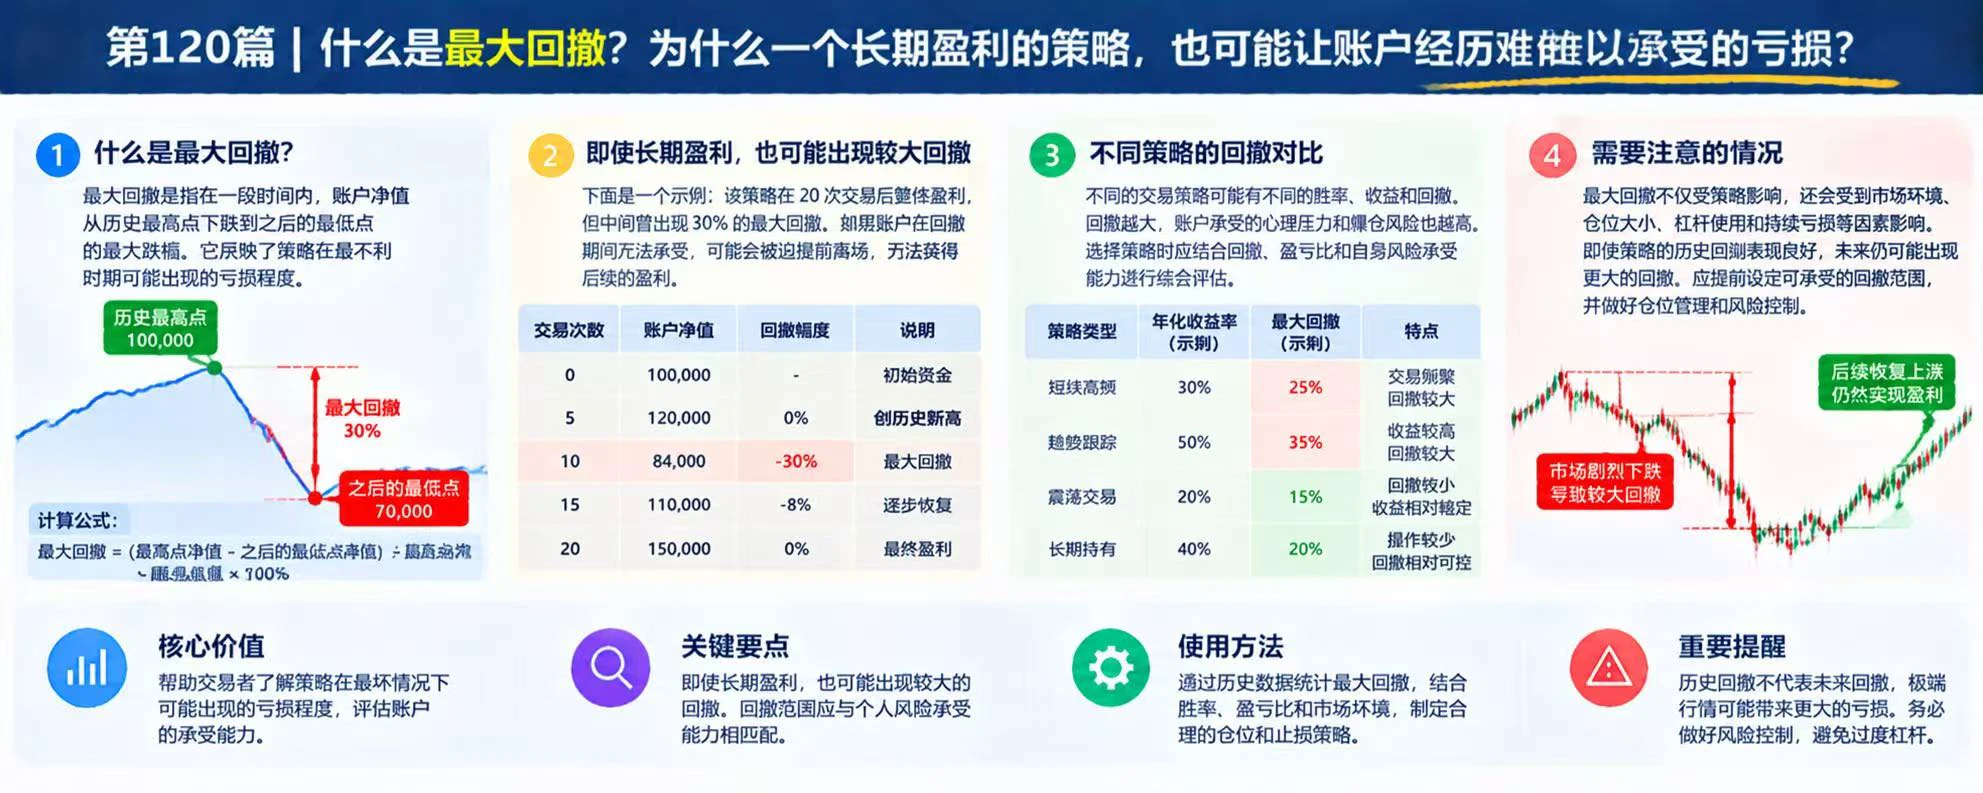
What Is Maximum Drawdown? Why Can a Long-Term Profitable Strategy Still Cause Unbearable Losses in an Account?

In cryptocurrency trading, many people focus only on how much they ultimately earn, while overlooking how much their account loses along the way. Maximum drawdown helps traders measure the most severe historical decline in an account’s value, making it an important metric for assessing risk and risk tolerance.

First, what is maximum drawdown?

Maximum drawdown is the largest decline in an account’s value from a historical peak to a subsequent low during a given observation period. F
post-image
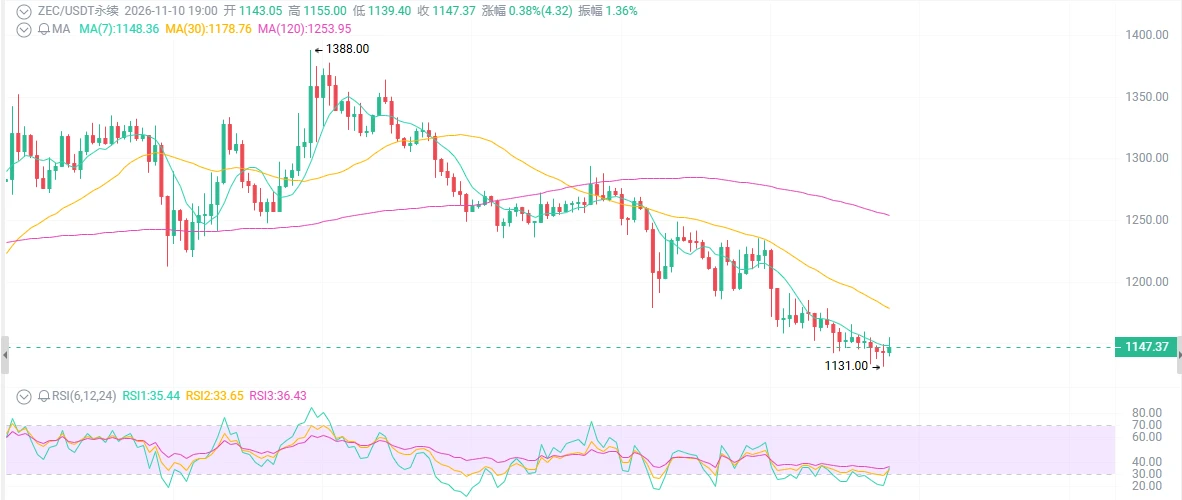
ZEC at $1,145—did the NU7 upgrade bait you?
NU7 has gone live, cutting block times from 75 seconds to 25 seconds, and everyone is shouting, “The king of privacy is back.” So what happened? ZEC dropped from 1380 to 1145, down another 5% in 24 hours, with longs getting liquidated left and right. Where’s the promised rally on good news? Are market makers using the upgrade to unload, or is this the nastiest shakeout of the bull market?

First, the surface story: good news priced in, then a price reversal.

NU7 activated on mainnet on November 5-6, cutting block times by two-thirds and launching a
post-image
BTC-0.67%
ETH-1.26%
ZEC+1.16%
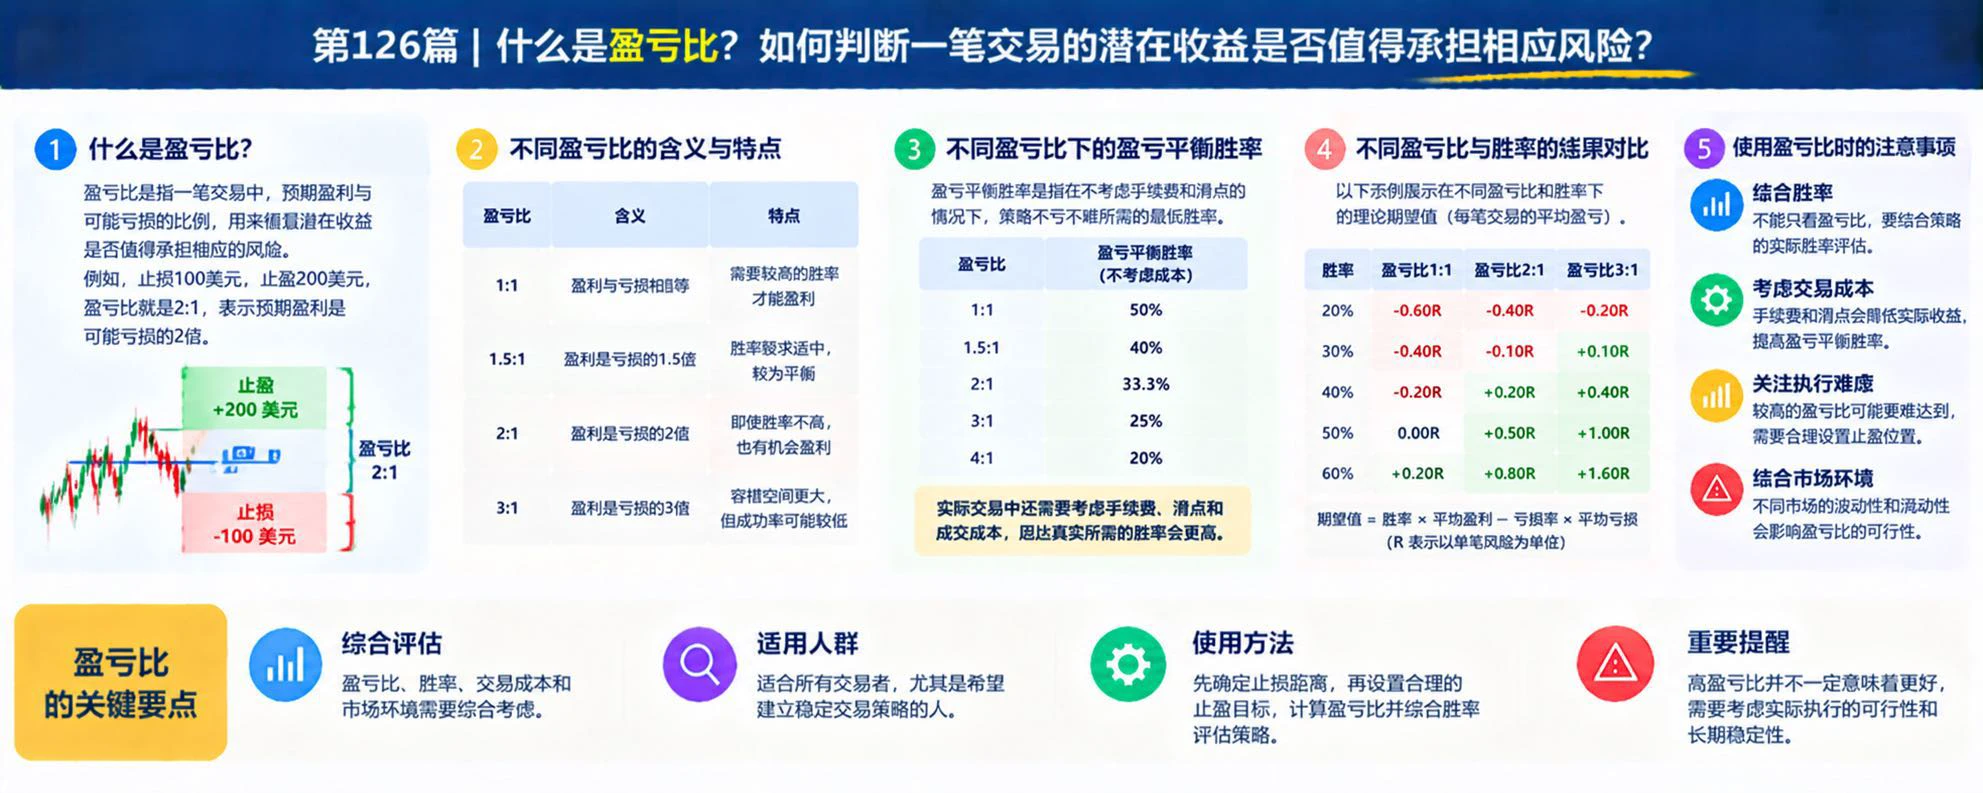
What Is the Risk-Reward Ratio? How Can You Tell Whether a Trade’s Potential Returns Are Worth the Risk?

In cryptocurrency trading, deciding whether a trade is worthwhile means looking beyond how much the price might rise and comparing potential gains with possible losses. The risk-reward ratio is an important tool for measuring this relationship, but a high ratio does not guarantee that a strategy will be profitable. You also need to consider the win rate, trading costs, and how difficult the strategy is to execute in practice.

First, what is the risk-reward ratio?

The risk-reward ratio usu
post-image
#Gate股票畅聊季 If I could choose only one stock right now, I would choose Broadcom (AVGO), not NVDA or AMD.

The reason is not that Broadcom has “risen the most,” but that the key threshold for the next generation of AI leaders is shifting from single-chip computing power to the economics of computing power per unit and system-level delivery capabilities. Ahead of Nvidia’s earnings, Goldman Sachs reiterated its Buy rating and $300 price target, forecasting FY3Q27 EPS 6% above consensus, on the rationale that gross margins would beat expectations and the risk to 2027 data center deployments was lim
post-image
AVGO+8.99%
NVDA-4.34%
AMD+13.35%
SPYX+0.01%
  • 1
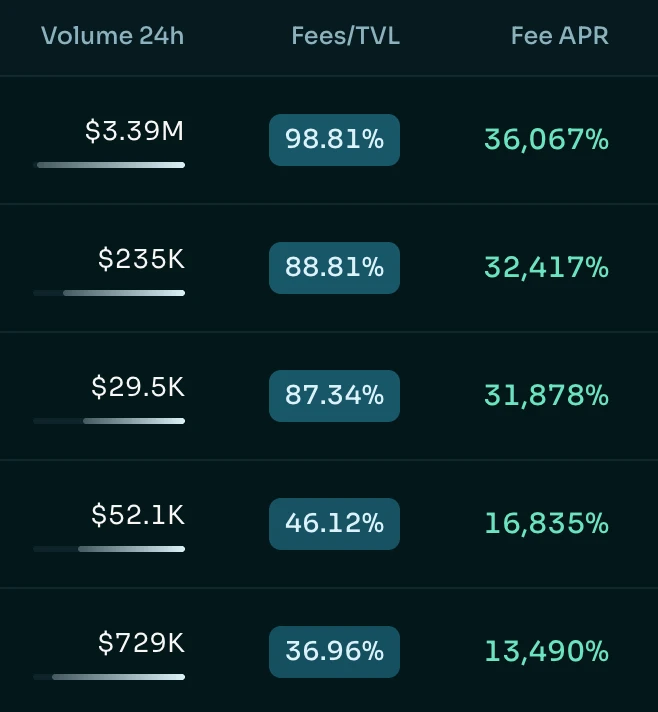
LPs are already making $250K a day on Elysium
With APRs up to 36,000 % !!!
Here's exactly how to LP on Elysium, step by step (be fast):
1. What is Elysium?
Elysium is Kinetiq's new Layer 2 for Hyperliquid, which launched its mainnet on November 9.
A few things to know:
- Network ID: 99901
- Gas token: HYPE
- DEX: Uniswap (preferred one)
2. How to bridge to Elysium
Step 1: Move HYPE to HyperEVM
If your HYPE is in your Hyperliquid spot balance, you first need to move it to HyperEVM
Open the official Hyperliquid app and select "Transfer to/from EVM"
Step 2: Bridge HYPE to Elysium
Use the official
post-image
HYPE+0.24%
USDC+0.01%
UNI+3.05%
What Is Maximum Drawdown? Why Can a Long-Term Profitable Strategy Still Cause Unbearable Losses for an Account?

In cryptocurrency trading, many people focus only on how much they ultimately earn, while overlooking how much the account loses along the way. Maximum drawdown helps traders measure the most severe historical decline in a strategy’s account value, making it an important indicator for assessing risk and risk tolerance.

First, what is maximum drawdown?

Maximum drawdown is the largest decline in an account’s net value from a historical peak to a subsequent low during a given observa
post-image
India’s Ministry of External Affairs said that lobbying firms contacting Congress is standard practice in the United States. That’s true—whoever takes office has to play the K Street game in Washington. What’s really worth watching is which way the lobbying agenda tilts: trade or defense. That’s what could set the stage for the market’s next move. Maybe I’m wrong; I’ll wait to be proven wrong.
post-image
The little one is making progress!
Keep it up 👏
post-image
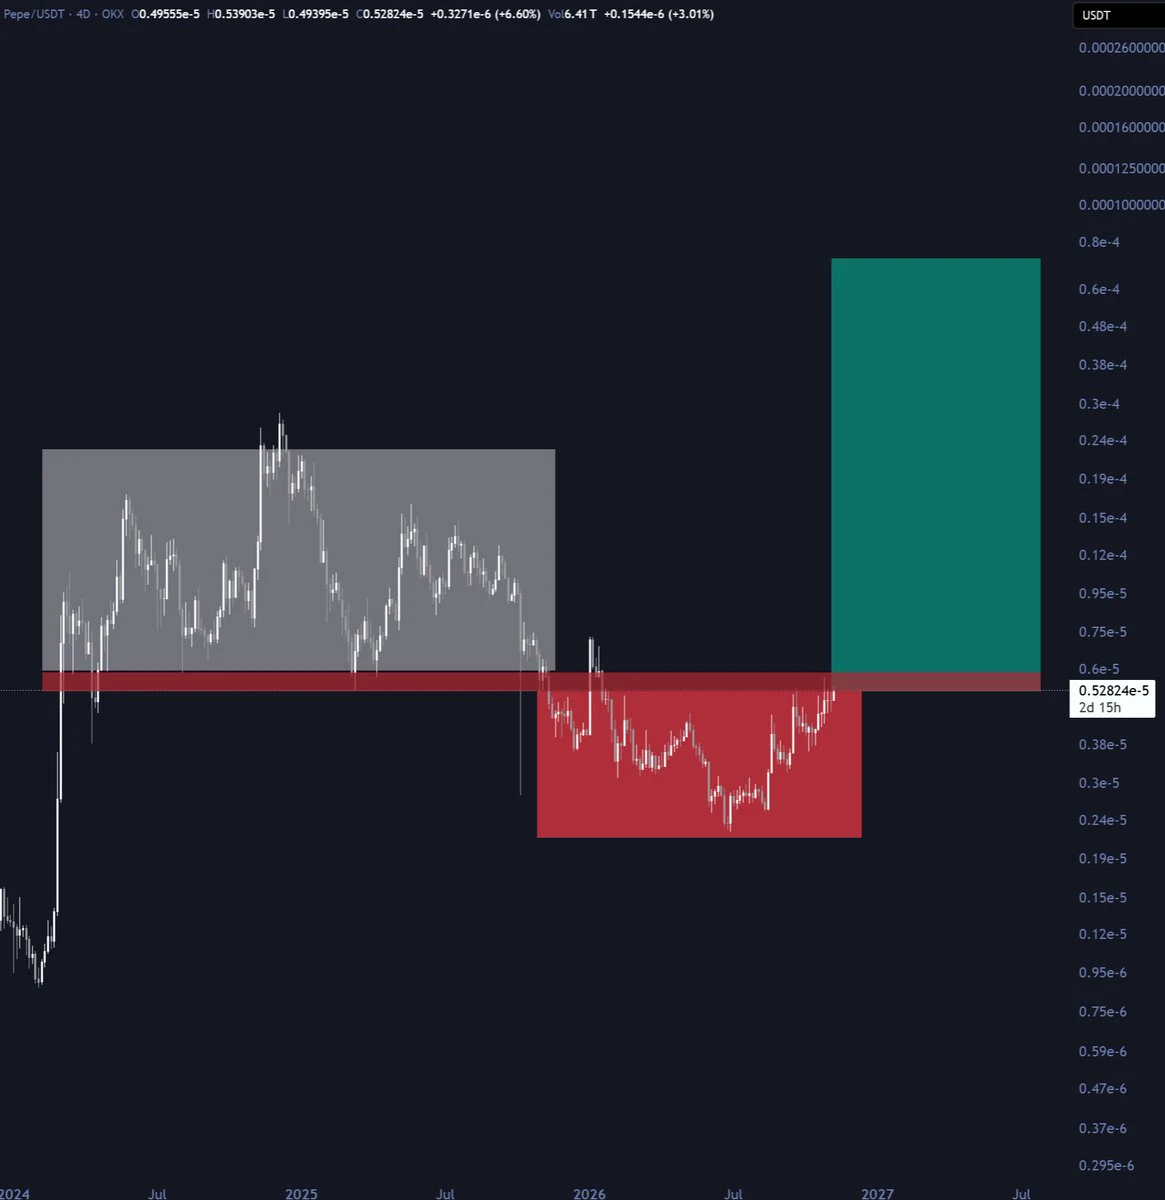
$PEPE is very close to breaking out of its manipulation phase
What's coming next will be a multi-year uptrend
post-image
PEPE+0.97%
[new streamer]market update
live-cover
LIVE3,642
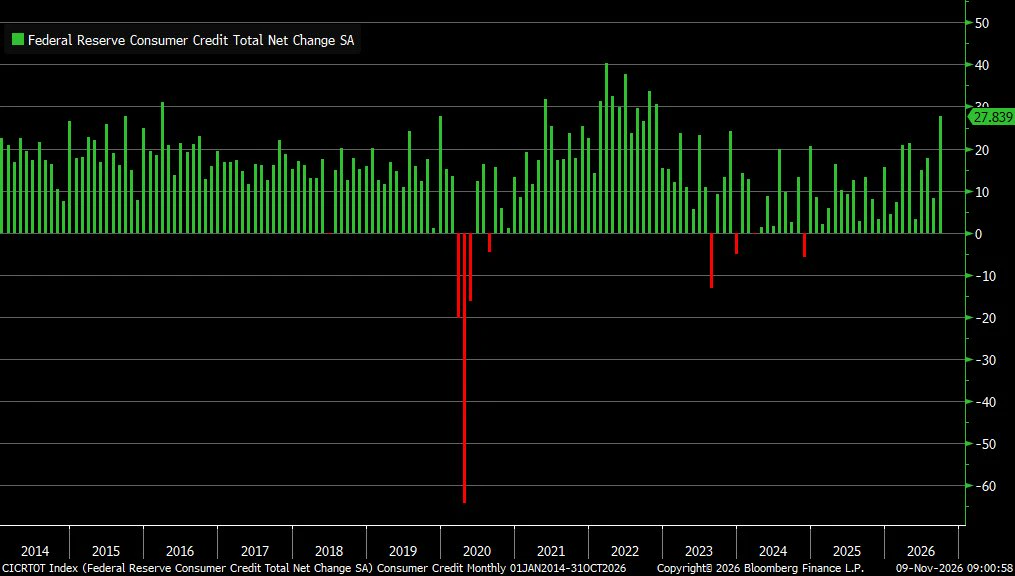
Consumer borrowing surged in September, rising to $27.8B … revolving credit (credit cards) rose $16.3B; non-revolving credit (auto and student loans) climbed $11.5B
post-image
Load More

Join 40 M users in our growing community

⚡️ Join 40 M users in the crypto craze discussion

💬 Engage with your favorite top creators

👍 See what interests you

Trending Topics

GateGlobalComplianceExpansion

1.19k Views214 Discussing

Gate continues to expand its global compliance footprint, now covering 81 regulated jurisdictions across Europe, North America, Asia, and Oceania. From MiCA and U.S. state-level MTLs to Japan’s FSA, Dubai, and Australia-related regulatory approvals, global exchanges are entering a new stage of compliance competition. Do you think regulatory strength will become as important as products and liquidity for exchanges in the future?

USCPIDataIncoming

57.35k Views2.31k Discussing

USIranTalksShowNewProgress

10.91k Views1.3k Discussing

View More