Square
Following
Hot
News
Profile
Share your thoughts
placeholder
Article
🔹Microsofts Cloud Business Beats Expectations Again! With Cash Flow Holding Steady, Can Microsoft C
live-cover
LIVE2,261
$BLESS Short-term setup... After the sharp rally, sellers are now gaining the upper hand! Entry price: $0.0100 – $0.0103Take-profit 1: $0.0095Take-profit 2: $0.0090Final target: $0.0083Stop-loss: $0.0112$BLESS Momentum is fading after the sharp rally. A break below $0.0100 could lead to further downside. Watch for confirmation of the breakdown.
post-image
BLESS-2.00%
Trenches
BNCB
B
bade
b
BNCB
0x49...ec3f
Market Cap
$.
Change
.
24h Vol
$.
Holders
.
TTWO
T
bade
b
TTWO
TTWo...FbKo
Market Cap
$.
Change
.
24h Vol
$.
Holders
.
STONK
S
bade
b
STONK
6GmA...UNgx
Market Cap
$.
Change
.
24h Vol
$.
Holders
.
ZIG
Z
bade
b
ZIG
0x8c...1145
Market Cap
$.
Change
.
24h Vol
$.
Holders
.
Q
Q
bade
b
Q
0xc0...0589
Market Cap
$.
Change
.
24h Vol
$.
Holders
.
If you're used to perpetual contracts, you may suddenly notice another contract with a date after its name and a somewhat different price. Don't mistake that date for an ordinary identifier—it may be the expiry date.
Delivery contracts have fixed expiry settlement schedules. At the designated time, open positions are usually settled according to the platform's rules, and you can't keep holding them as the same position indefinitely.
It's a bit like a rental agreement: a contract with a clearly defined term and one without the same fixed expiry arrangement naturally have different processes aft
post-image
What Is a Classification Threshold? Why Can Changing a Probability Threshold Alter an Entire Trading Strategy’s Returns and Risks?
In crypto quantitative trading, a machine learning model may predict a 65% probability that BTC will rise in the next period. But should a trader buy immediately? The answer depends on the classification threshold set by the strategy. A classification threshold is the cutoff that converts a model’s probability output into an actual trading signal. It affects the number of signals, the rate of false predictions, and the final trading results.
First, what is a classi
post-image
BTC-0.67%
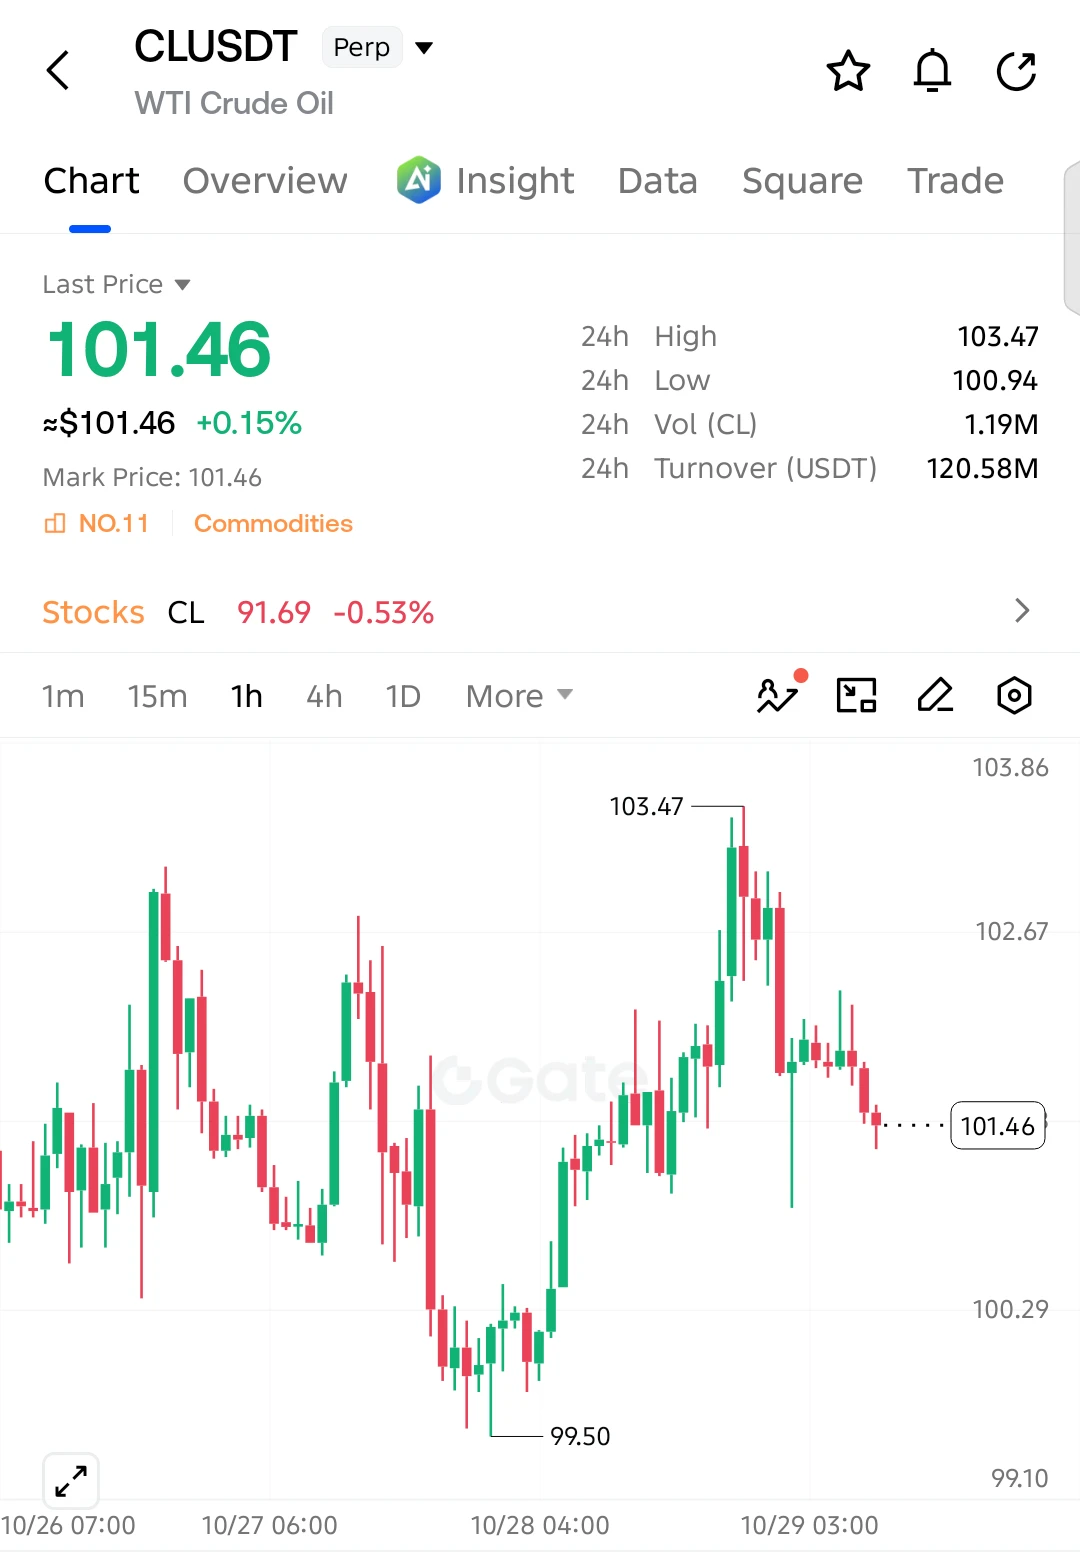
$CL SHORT SETUP — 100 NEXT?
$CL is showing bearish pressure on the 1H chart after a sharp rejection from 103.47. Sellers are forming lower highs, and price is now testing the 101.40 support area. A confirmed breakdown could open the door toward 100.
Entry: 101.40–101.60
SL: 102.20
TP1: 101.00
TP2: 100.50
TP3: 100.00
Extended Target: 99.50
As long as price stays below 102.20, the bearish setup remains valid. A sustained break above that level would weaken the short outlook.
post-image
CL-1.83%
  • 6
  • 1
Last night's short positions and today's long positions during the decline—after the market dipped, it rebounded successfully, and the long positions secured another win
post-image
Floki all time high hype ath go
post-image
FLOKI-0.82%
Google’s stock plunged—is the AI bubble bursting, or is the market tapping the brakes on exuberance?
Seeing Google Cloud revenue surge 103% year over year, some were excited: The AI era is here! Seeing net profit fall 25% and free cash flow turn negative, others grew concerned: Can it earn this money back? The stock’s after-hours drop of more than 10% at one point gave both bulls and bears more reason to support their views.
But I think truly smart investing doesn’t mean having to choose between “AI is invincible” and “AI is finished.”
Rapid growth in the cloud business shows that corporate de
GOOGL+1.58%
  • 27
Morning Market Update
live-cover
LIVE3,290
Price reacted without touching our zone
It was 40 points away from our entry
Entry conditions are already present on the lower 5M timeframe
I’ll wait for price to pull back into the 41/39 zone to enter
If it extends to the 15M timeframe, I’ll continue holding for the next TP.
Conversely, if there’s no pullback and it expands on a higher timeframe here, we’ll enter at market or miss this trade🤝
post-image
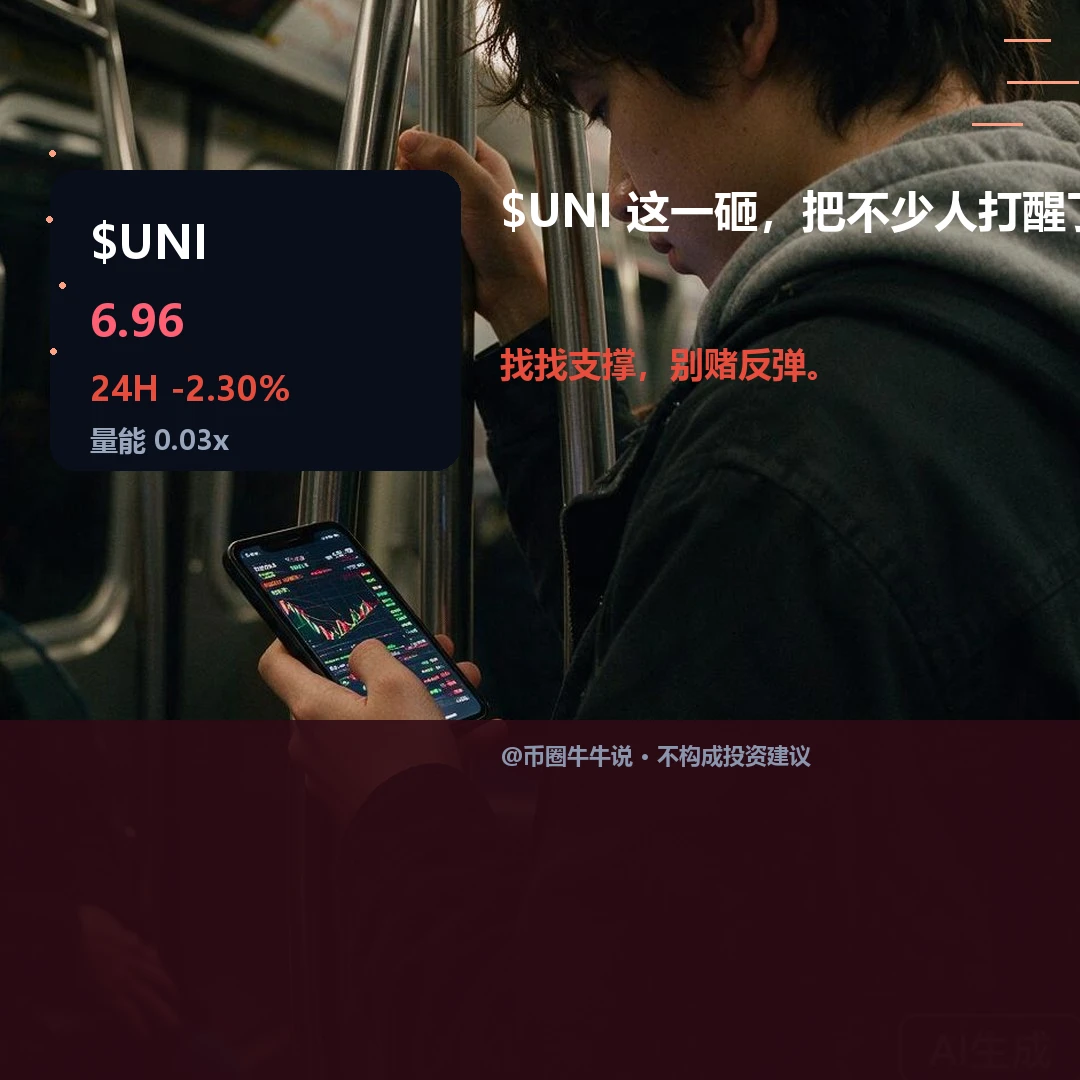
$UNI The price fell to 6.957. The 24-hour decline of 2.30% looks weak, but 1-hour trading volume is only 2.96% of its usual level. The price slid from a high of 7.35 to near the 6.914 support level without panic selling, making the short-side momentum behind this low-volume decline look questionable.
The current outlook remains weak, but whether the trend will continue is uncertain. Trends across both timeframes are pointing down, but the extremely low volume undermines the credibility of a support break. A high-volume break below 6.914 would confirm an acceleration in the decline, while a re
post-image
UNI+3.05%
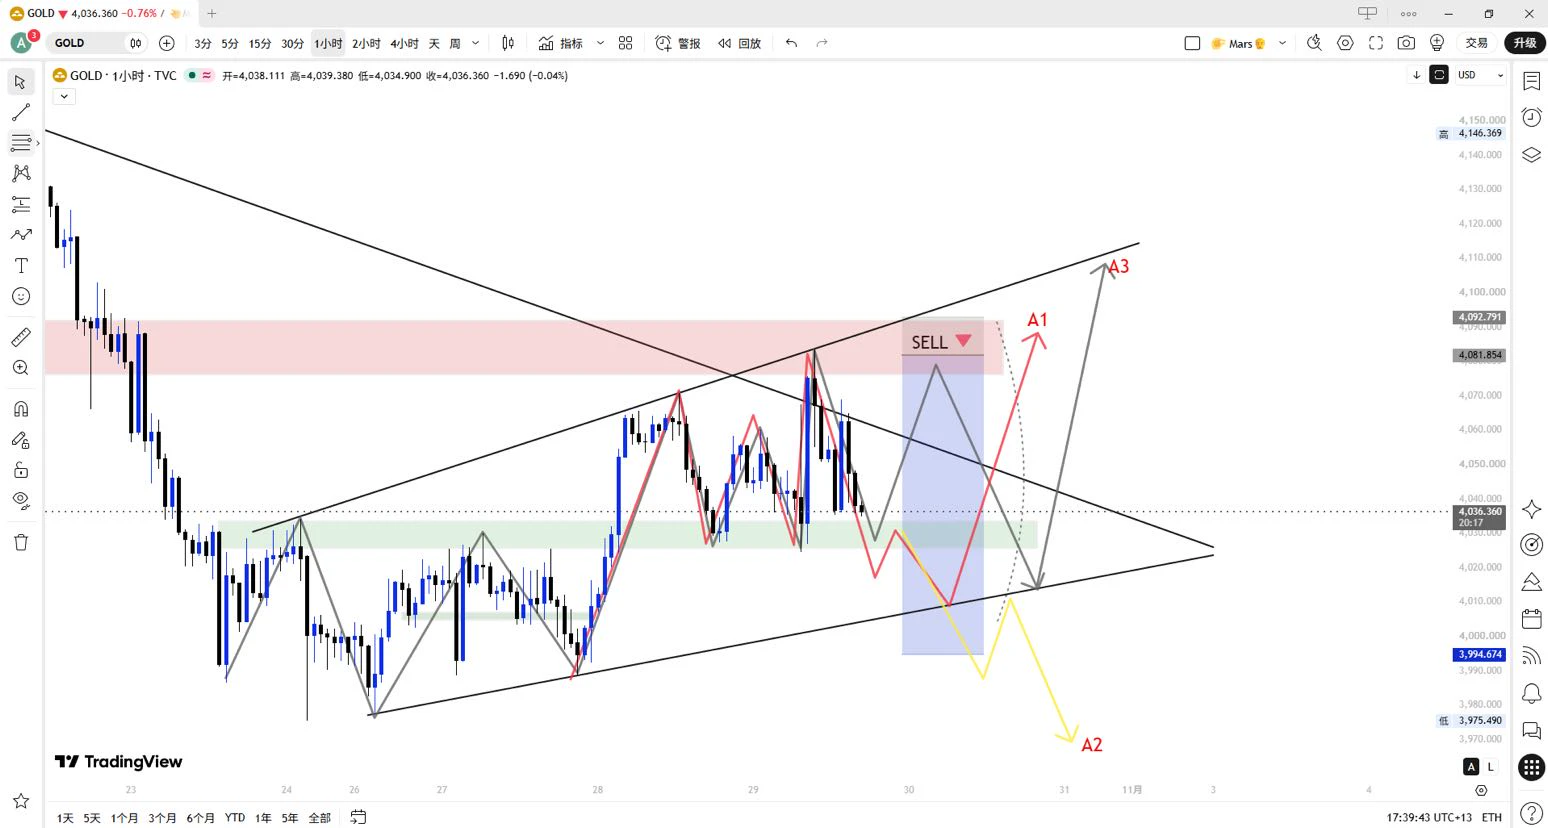
I was eating earlier, and now I'm back to our chart. Let's review it together!
There are only 3 possible scenarios ahead. I'll explain in more detail, so take a careful look.
We still can't enter here. It's a better position than this morning, but the entry would be relatively awkward.
When it reaches our green zone, I want to wait and see how it reacts so we can take effective action on the next trade. If the conditions are met, I'll place a trade here.
Question: Why?
Answer: Because our green reaction zone offers a better risk-reward ratio if it produces a bullish signal after being touched.
XAUUSD-0.59%
  • 4
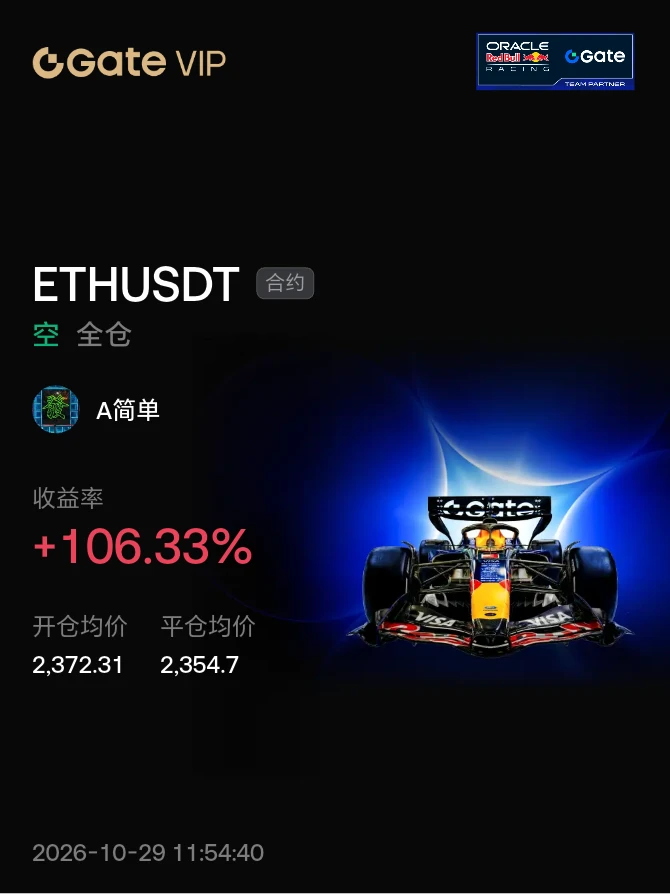
#晒出我的合约收益 Steady as she goes,
Got off a little early,
post-image
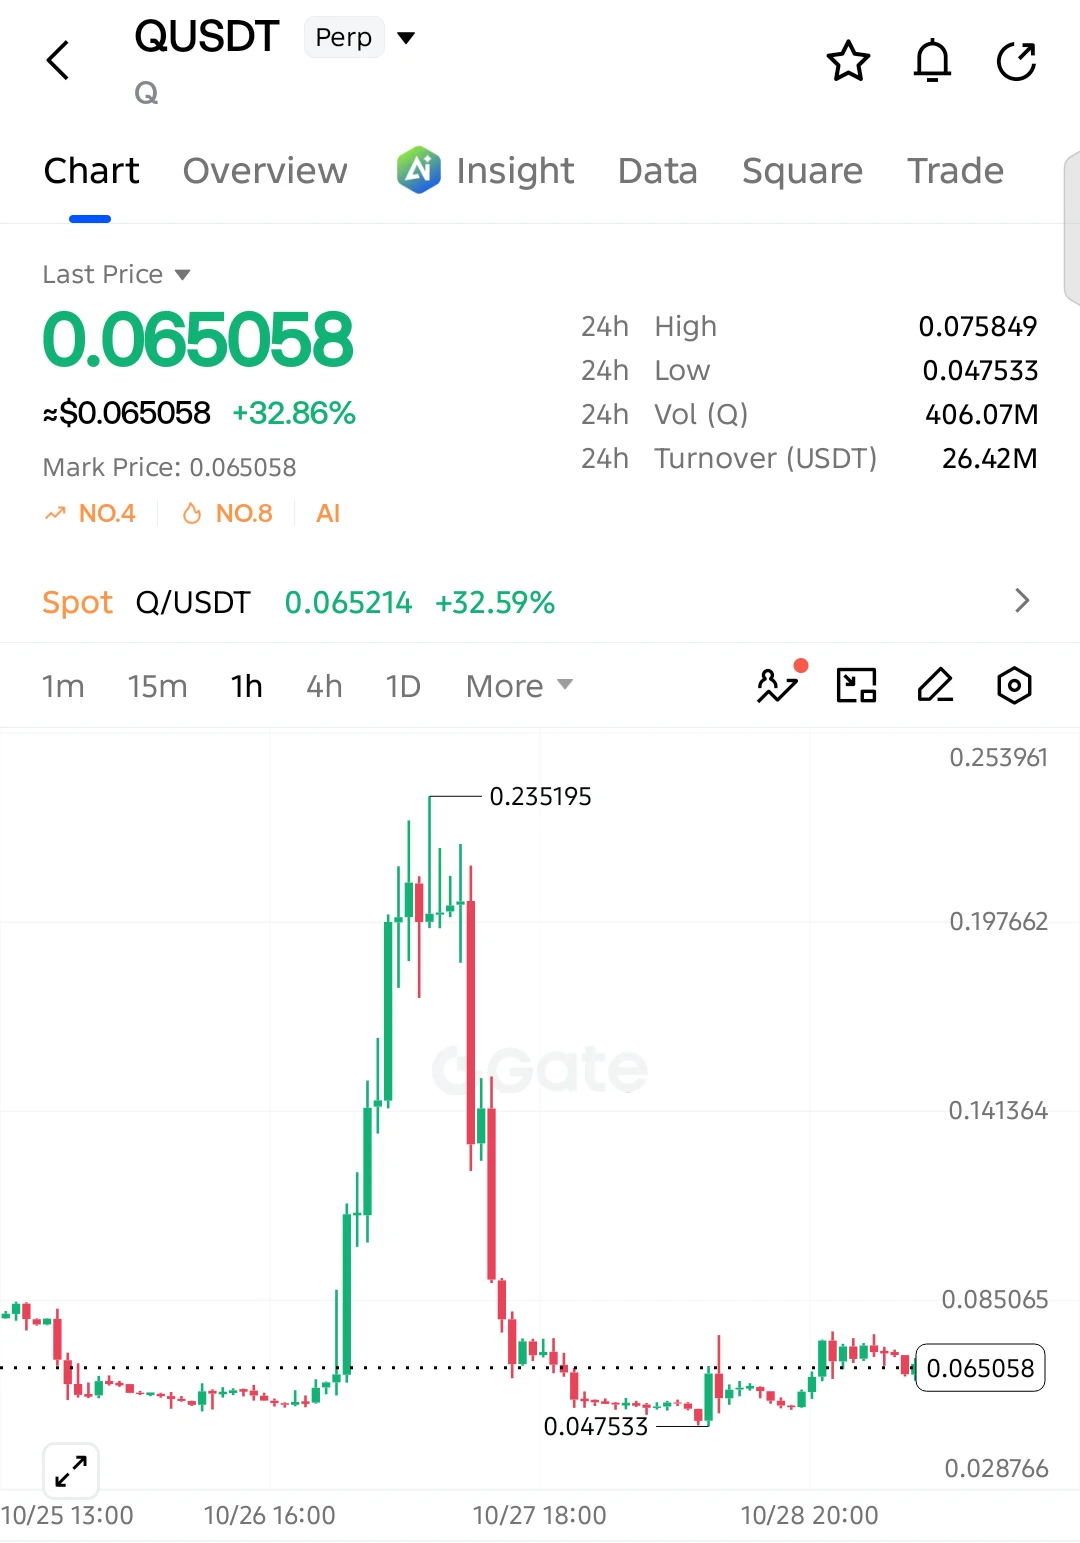
$Q SHORT SETUP — 0.050 NEXT?
$Q is struggling to recover after a massive rejection from 0.235195. The 1H chart shows price consolidating near 0.0650, with buyers failing to establish a strong breakout. A breakdown below 0.0630 could trigger another bearish move.
Entry: 0.0650–0.0670
SL: 0.0725
TP1: 0.0610
TP2: 0.0570
TP3: 0.0520
Final Target: 0.0475
The short setup remains conditional on sellers defending 0.0700 and price breaking below 0.0630. A sustained recovery above 0.0725 would invalidate this bearish outlook.
post-image
Q-28.72%
  • 2
What Is Class Imbalance? Why Can Cryptocurrency Prediction Models Seem Accurate Yet Have No Trading Value?
In cryptocurrency quantitative trading, a model’s accuracy can easily be misleading. If most periods in the test data do not feature a strong rally as defined, a model that always predicts “no rally” may still achieve high accuracy, yet fail to identify genuine trading opportunities. This is the problem of class imbalance.
First, what is class imbalance?
Class imbalance occurs when the numbers of samples in different classes in a dataset vary greatly. For example, only 100 out of 1,000 sa
post-image
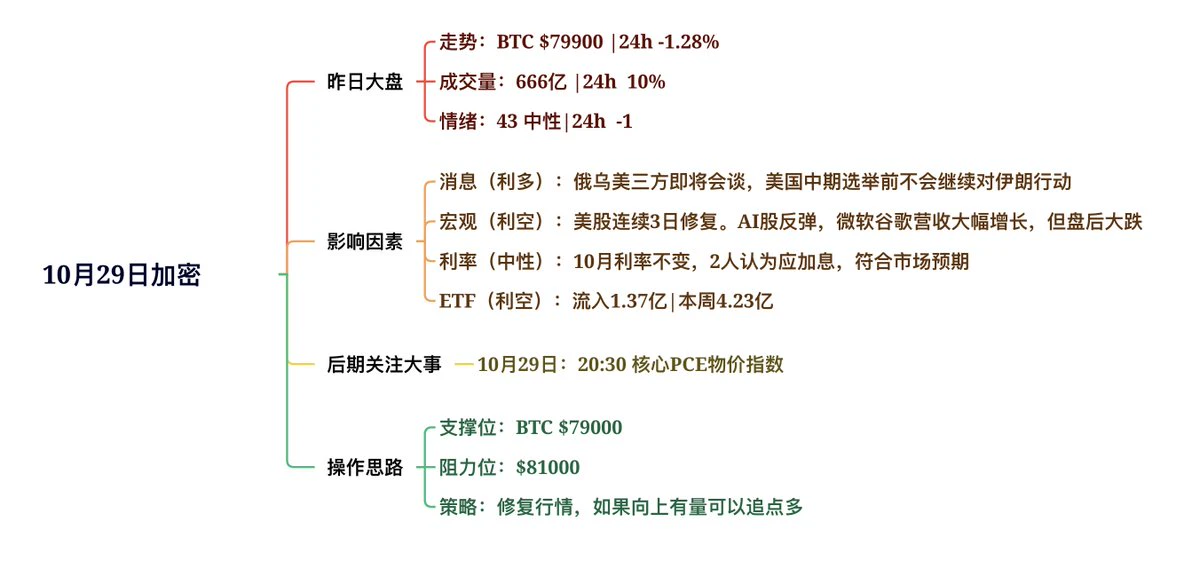
📌10/29 trading: The market is recovering. Gradually buy back in, and add to positions if volume picks up
The Fed held rates steady, as expected. Warsh’s remarks showed he is extremely reluctant to raise rates. With the rate-hike uncertainty behind us, 2-year and 10-year Treasury yields fell in tandem, and U.S. stocks rebounded
But after hours, despite Google and Microsoft reporting sharply higher revenue, their share prices fell. U.S. stocks are worried again about excessive capital spending. I think this is a matter of perspective between institutional and retail investors; AI spending won’t
post-image
MSFT+0.17%
BTC-0.67%
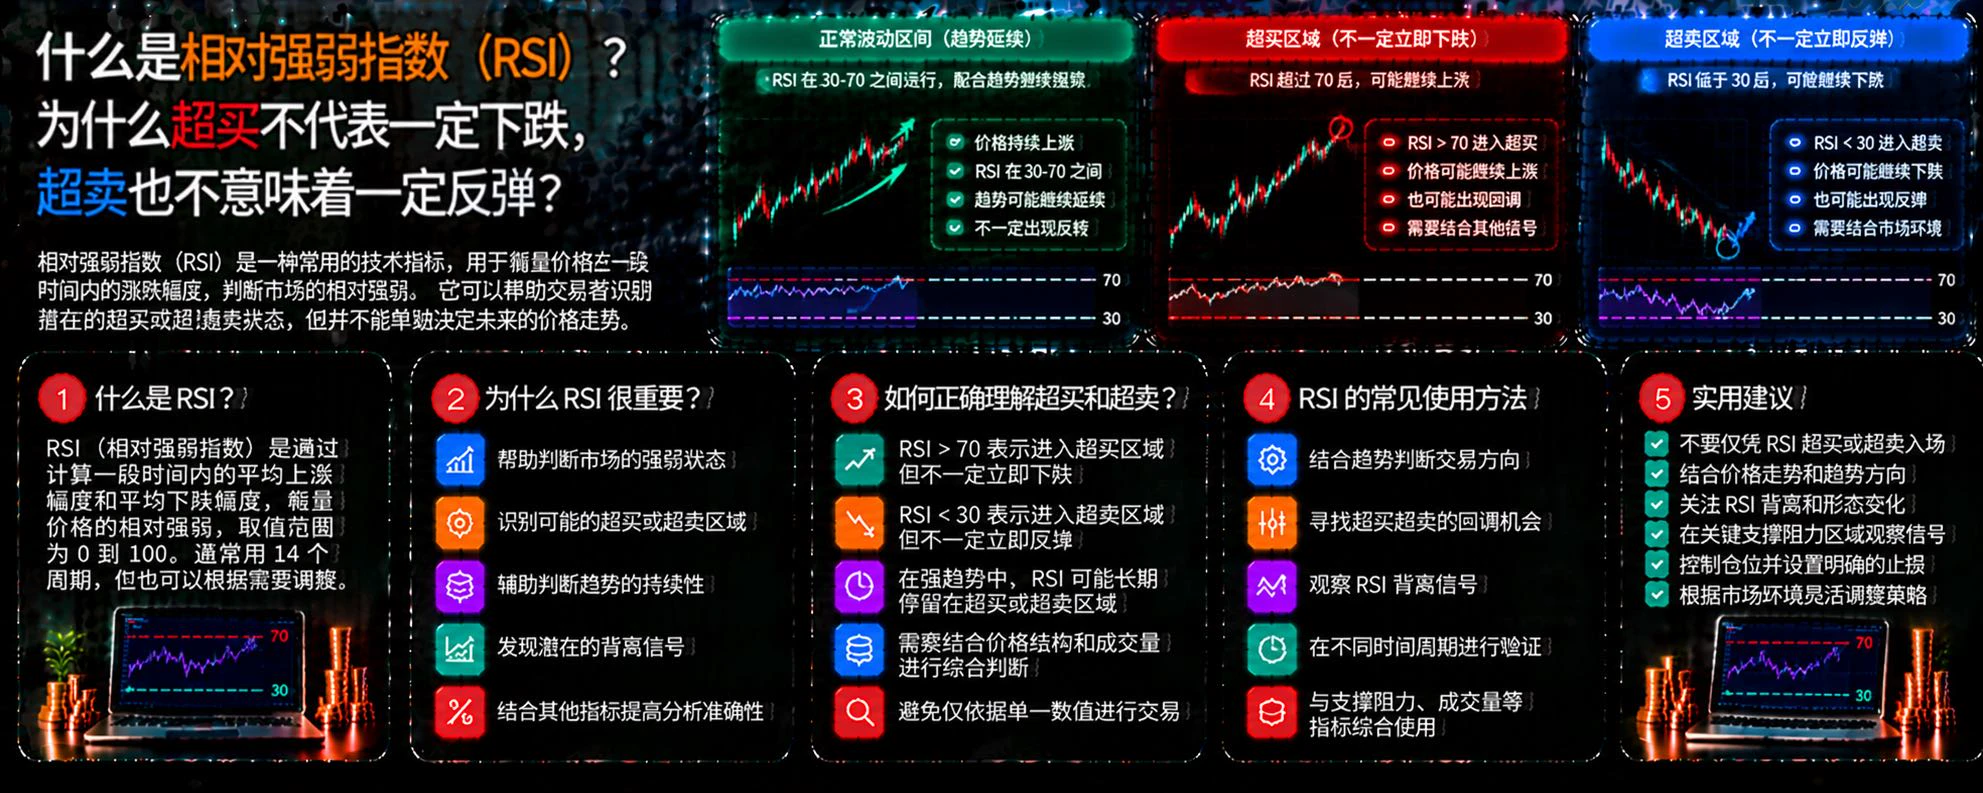
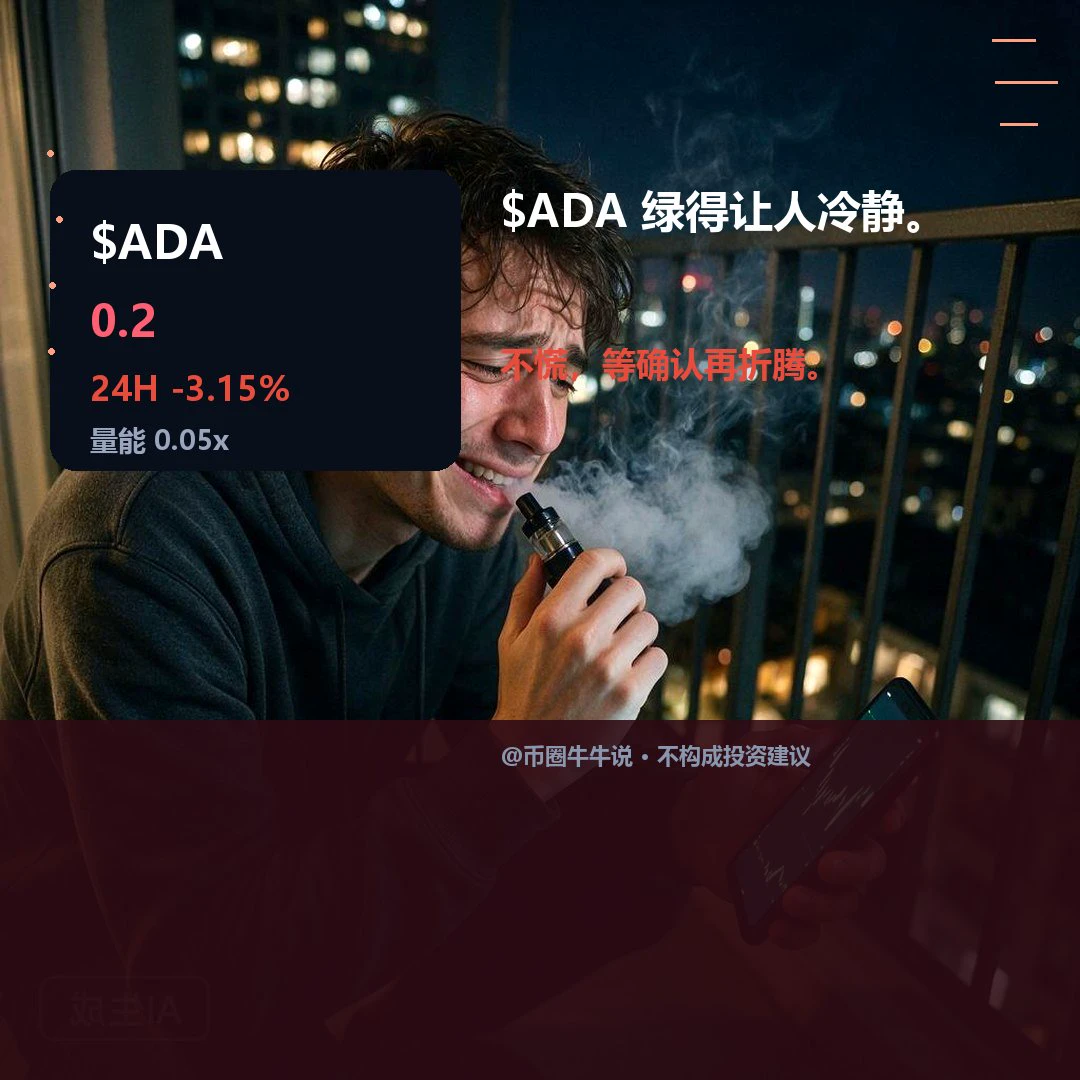
$ADA Currently at 0.1998, down 3.15% over 24H (0.1956–0.2101). The 1H and 4H structures are both weak, with RSI at 41/38 and volume at just 0.05x the moving average. Watch whether price can hold above resistance at 0.2101; a break below support at 0.1956 could accelerate a move lower. Monitor for a recovery in volume—the current low-volume rebound needs confirmation from a pickup in volume. Market volatility is high; for observation only.
post-image
ADA-1.48%
#FedKeepsRatesSteady #ShareWeekly
The Federal Reserve has decided to keep interest rates unchanged, maintaining the target range for the federal funds rate at 3.75 percent to 4 percent. This decision came from the Federal Open Market Committee in a 10 to 2 vote on October 28, 2026. The two dissenting votes came from officials who preferred a quarter-point increase, reflecting ongoing concerns about inflation that remains elevated above the central bank’s 2 percent goal. The statement accompanying the decision noted that economic activity is expanding at a strong pace, with resilient domestic
  • 1
  • 1
📉10.29 Midday Market Outlook📉
比特币观点:
$BTC It went around in circles and ended up right where it started—what gives? Look at the two upward rebounds marked by the red arrows above: both tried to break through the 82000 resistance, but neither succeeded. Once BTC broke above 82000 and started trading there, its hourly chart reversed.
The second rebound also peaked below the first. Both rebounds failed to break through the 82000 resistance, so a spike followed by a pullback is normal.
The hourly chart has also formed a double top after breaking below the 80137 support and the triangle con
BTC-0.65%
The airdrop has been announced. Is it still time to buy?
The group chat suddenly lights up: “Hold this coin to claim the airdrop!”
Just as you’re about to buy, pause and check the “snapshot time” in the announcement.
A snapshot is like taking a group photo: whoever is there when the shutter clicks gets recorded. Show up after the photo is taken, and you won’t automatically appear in it.
If the event is based on yesterday’s holdings, buying today usually won’t make up for yesterday’s eligibility. Some events also look at your average balance over a period of time, rather than how much you held
post-image
Load More

Join 40 M users in our growing community

⚡️ Join 40 M users in the crypto craze discussion

💬 Engage with your favorite top creators

👍 See what interests you

Trending Topics

FedKeepsRatesSteady

39.04k Views1.77k Discussing

The Fed will announce its rate decision on October 28 at 18:00 (UTC), followed by a press conference at 18:30 (UTC). Markets widely expect rates to remain unchanged, with attention turning to future policy signals. Could this decision break crypto out of its trading range? What signals are you watching?

Gate24HNetInflowsRankTop2

261 Views864 Discussing

GoogleCloudSurges103%ButStockFalls

462 Views510 Discussing

View More