Square
Following
Hot
News
Profile
Share your thoughts
placeholder
Article
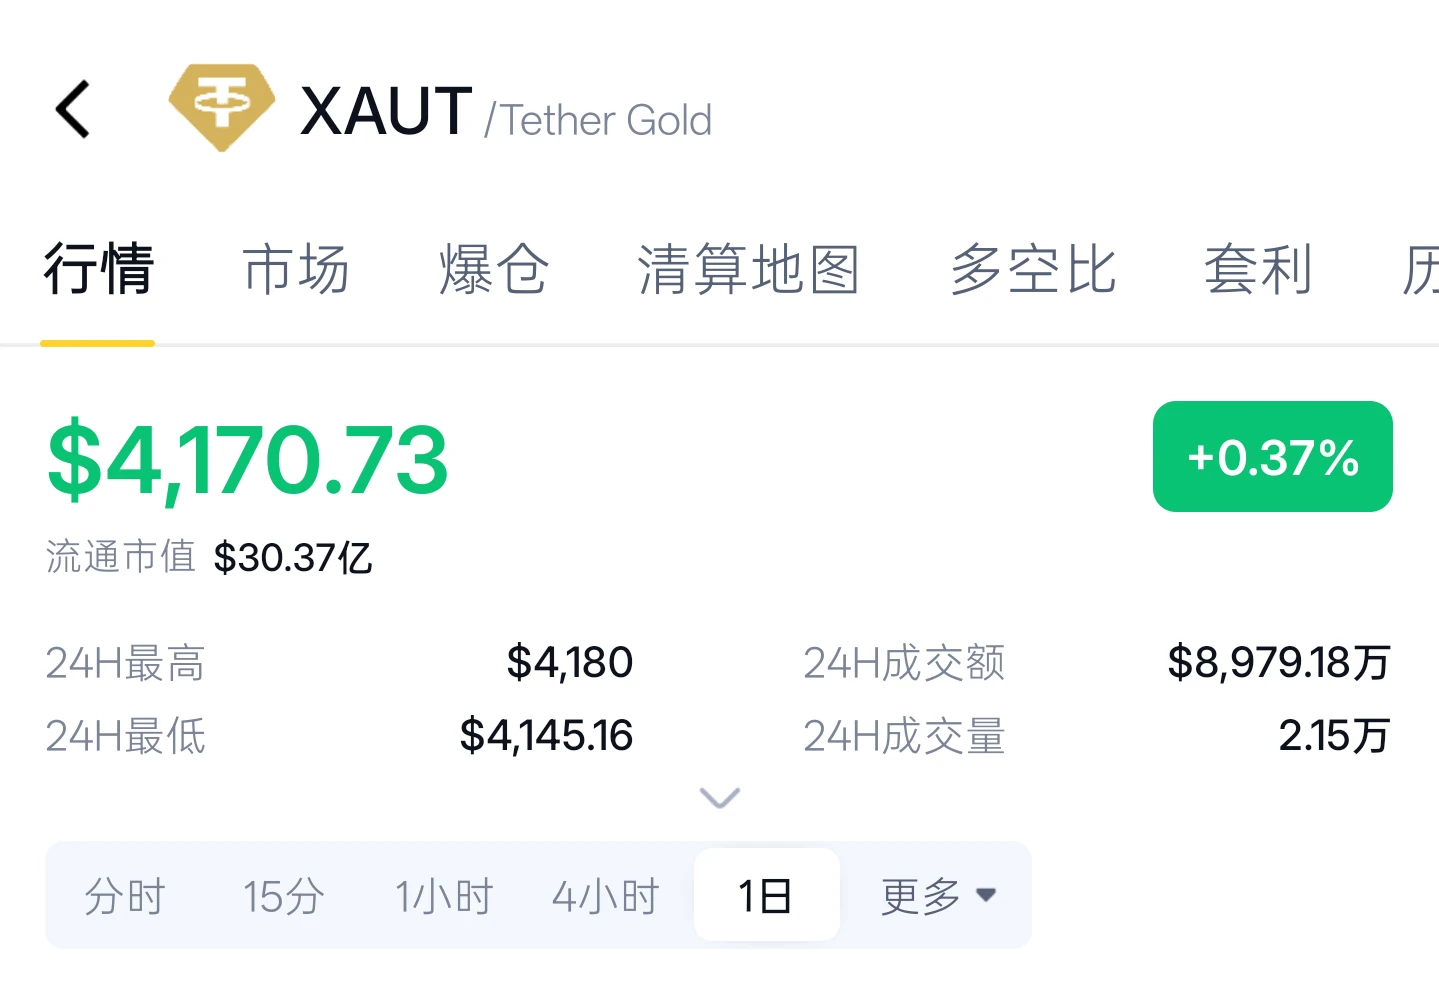
Weak Rebound, Shorts Remain in Control! The 4,200 Level Holds Firm as Resistance, with 4,150 in Sight
Gold was rejected after climbing to 4,216 last Friday and pulling back. It continued to trade weakly and drift lower during today's Asian session, with a rebound capped near 4,203. It touched key support at 4,176 before consolidating slightly, and is currently trading near 4,185. Overall, the market shows a weak pattern of “rejected at highs and gradually moving lower.” Bears are in control of the battle between bulls and bears, with the 4,190–4,210 range serving as strong near-term resistance
post-image
XAU+0.44%
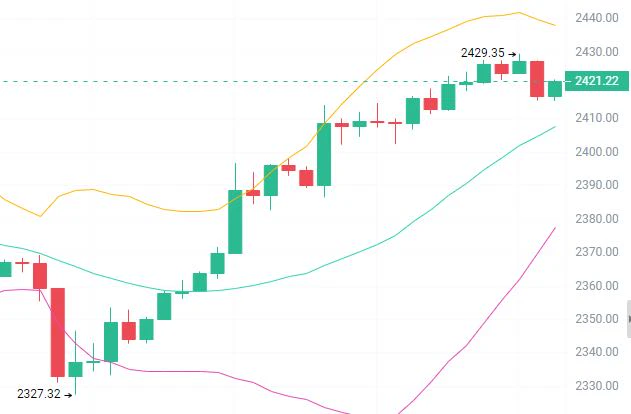
Early-morning ETH outlook
Plan:
Short around 2430-2450
First target: 2410-2390
Second target: 2350-2300
Use a stop-loss
ETH came under pressure and pulled back after rising close to its previous high, leaving a clear upper wick. The MACD histogram’s red bars are starting to shorten, and the RSI has turned down from a high level, indicating that bullish momentum has clearly weakened. ETH’s gains in this move have been relatively weak, with heavy selling pressure overhead. I won’t blindly try to call the top or chase shorts. The strategy is to wait for a rebound near the upper band, then take a
post-image
ETH+0.27%
Trenches
CNPY
C
bade
b
CNPY
0xc6...ddd2
Market Cap
$.
Change
.
24h Vol
$.
Holders
.
TSI
T
bade
b
TSI
0xa8...1c1e
Market Cap
$.
Change
.
24h Vol
$.
Holders
.
AGT
A
bade
b
AGT
0x5d...e274
Market Cap
$.
Change
.
24h Vol
$.
Holders
.
BOOMER
B
bade
b
BOOMER
0x5a...5c00
Market Cap
$.
Change
.
24h Vol
$.
Holders
.
PIERRE
P
bade
b
PIERRE
D3S6...pump
Market Cap
$.
Change
.
24h Vol
$.
Holders
.
#每周来晒 #WCTCS9 #山寨币反弹势头消退
Altcoins still have a chance to rebound, but this looks more like a rotation-driven recovery than the start of a new broad-based rally.
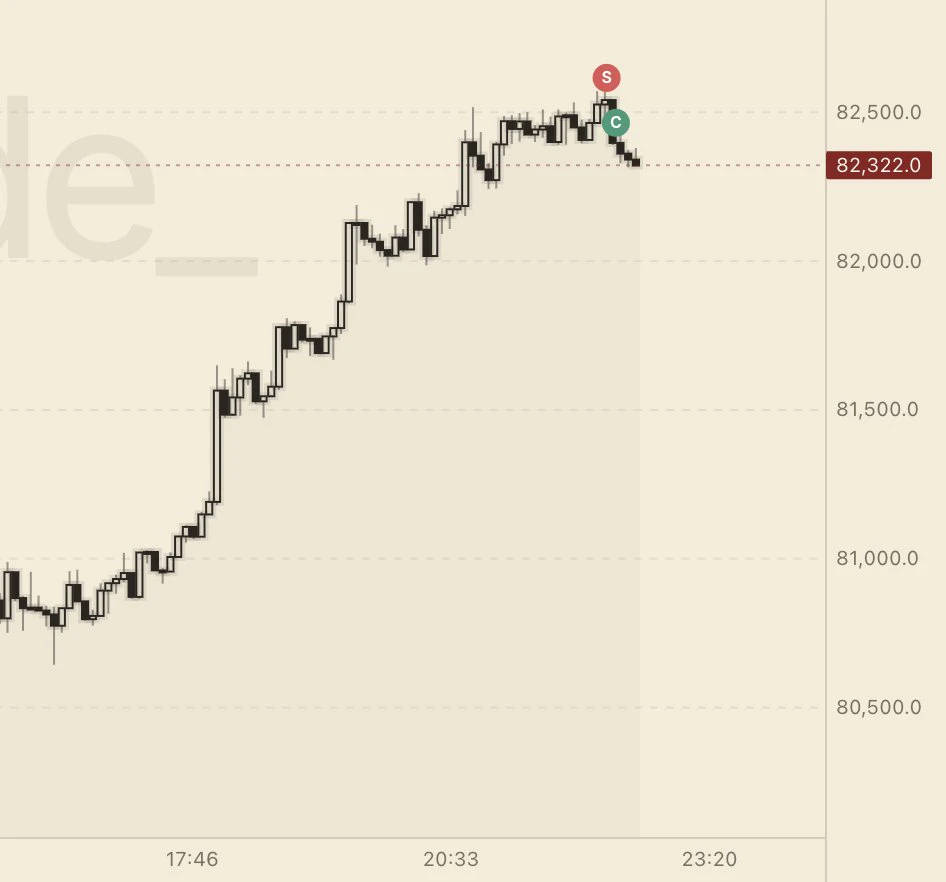
As of October 19, BTC was around $82,611, up on the day; ETH was consolidating near $2,400. Only after BTC holds its recent lows will altcoins have room to rotate.
Why the rebound is not yet confirmed
· ETF funds are still flowing out: As of October 16, BTC spot ETFs saw net outflows of about $228 million for the week, while ETH spot ETFs saw about $320 million in outflows.
· ETH's relative strength is average: When BTC strengthen
post-image
ThisIsTranslateContent:
#山寨币反弹势头消退 Altcoins still have a chance to rebound, but it looks more like a rotation-driven recovery and is difficult to view as the start of a new broad-based rally for now.
As of October 19, BTC was around $82,611, up intraday; ETH was consolidating near $2,400. Only after BTC holds its recent lows will altcoins have room to rotate higher.
Why the rebound is not yet confirmed
· ETF flows are still negative: For the week ended October 16, BTC spot ETFs saw net outflows of about $228 million, while ETH spot ETFs saw about $320 million.
· ETH's relative strength is mediocre: ETH has struggled to keep pace when BTC strengthens, indicating that capital favors Bitcoin and risk appetite has yet to broaden significantly.
· The market is divided: ETH/BTC tested a rebound after approaching support, but whether it can continue will depend on trading volume and follow-through in capital flows.
Watch these three signals next
1. Whether BTC can hold above $82k and go on to break through $83.5k–$84k.
2. Whether ETH can consistently outperform BTC, with the ETH/BTC exchange rate starting to rise.
3. Spot ETFs turning to sustained net inflows, alongside a pickup in market trading volume. Only if all three signals align might altcoins move from short-term rotation to a broad-based rally.
The more accurate assessment for now is that a rebound is possible, but its staying power remains unproven; when BTC weakens, altcoins usually face greater pullback pressure.#WCTCS9
repost-content-media
BTC-0.96%
ETH-1.64%
#美国9月PPI大超预期
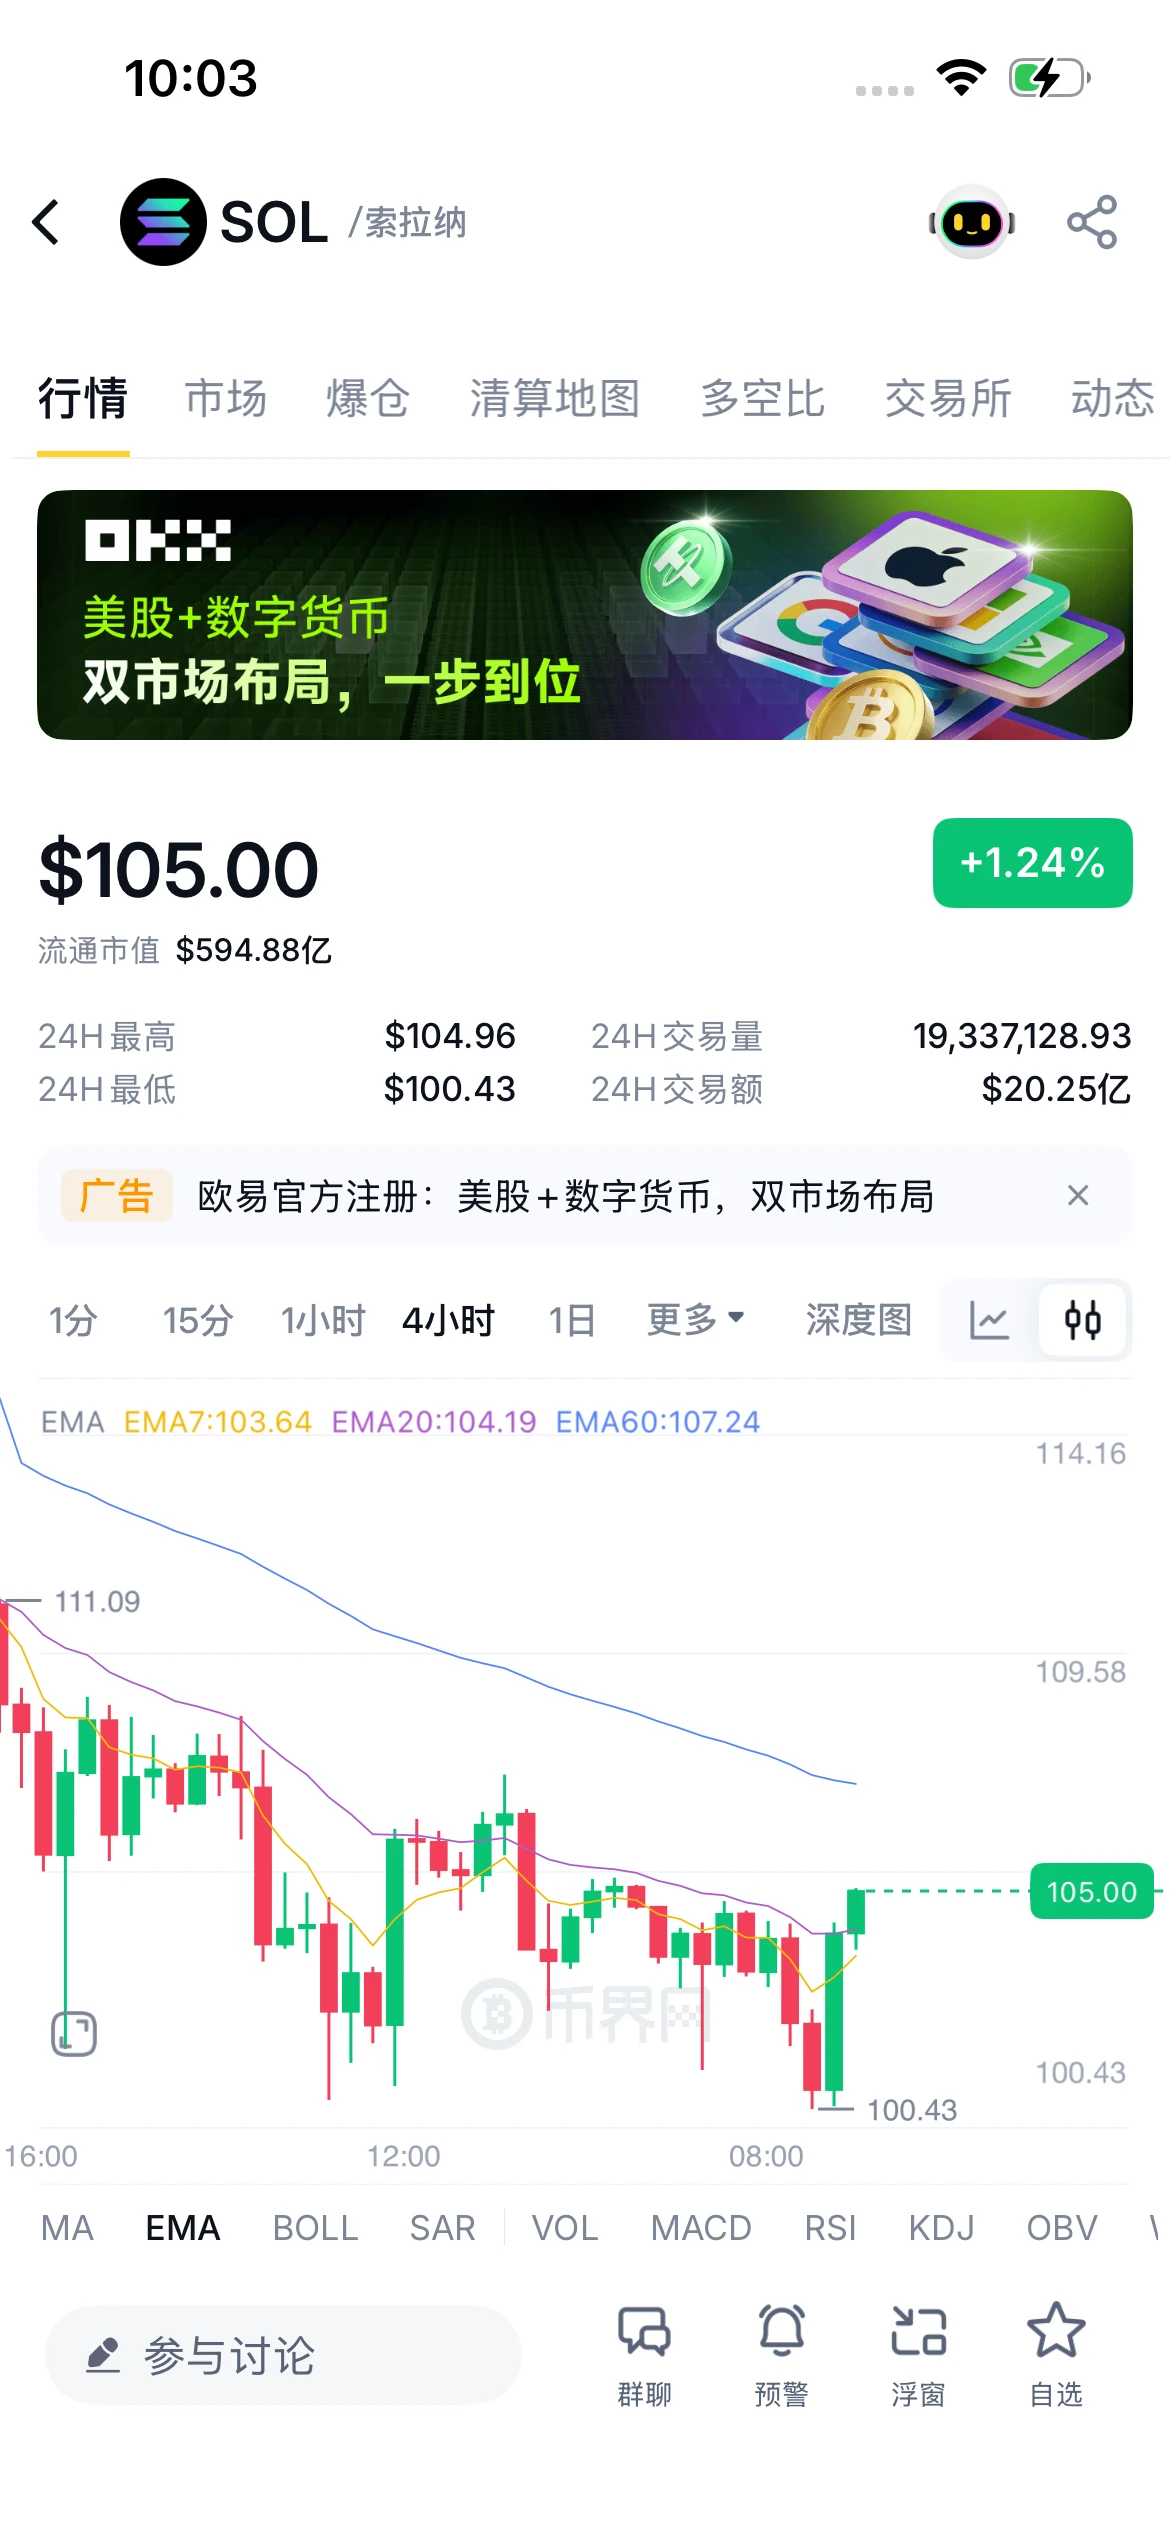
My SOL short at 117.23 is deeply in profit at the current price of 105.00; 107.24 will determine direction.
Market: On the 4H chart, SOL pulled back from 117.23, bounced after bottoming at 100.43, and is now at 105.00 (up 1.24% in 24h). It has moved above EMA7 (103.64), with EMA20 (104.19) close by and EMA60 (107.24) trending down. This is a weak rebound after the drop from 111 to 100; the bearish bias remains until price gets above EMA60.
P&L calculation: 117.23 - 105.00 = a 12.23-point price difference, with unrealized profit continuing to grow.
Key levels: Support at 100.43/10
post-image
SOL+1.32%
fk I think I might've just fumbled a generational trade
post-image
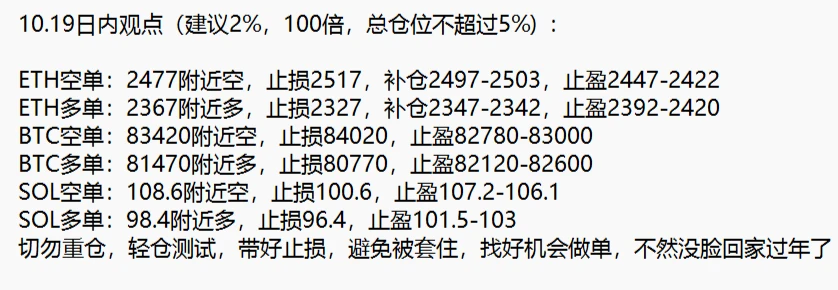
10.19 Intraday Strategy
(Recommended: 2%, 100x, total position no more than 5%):
post-image
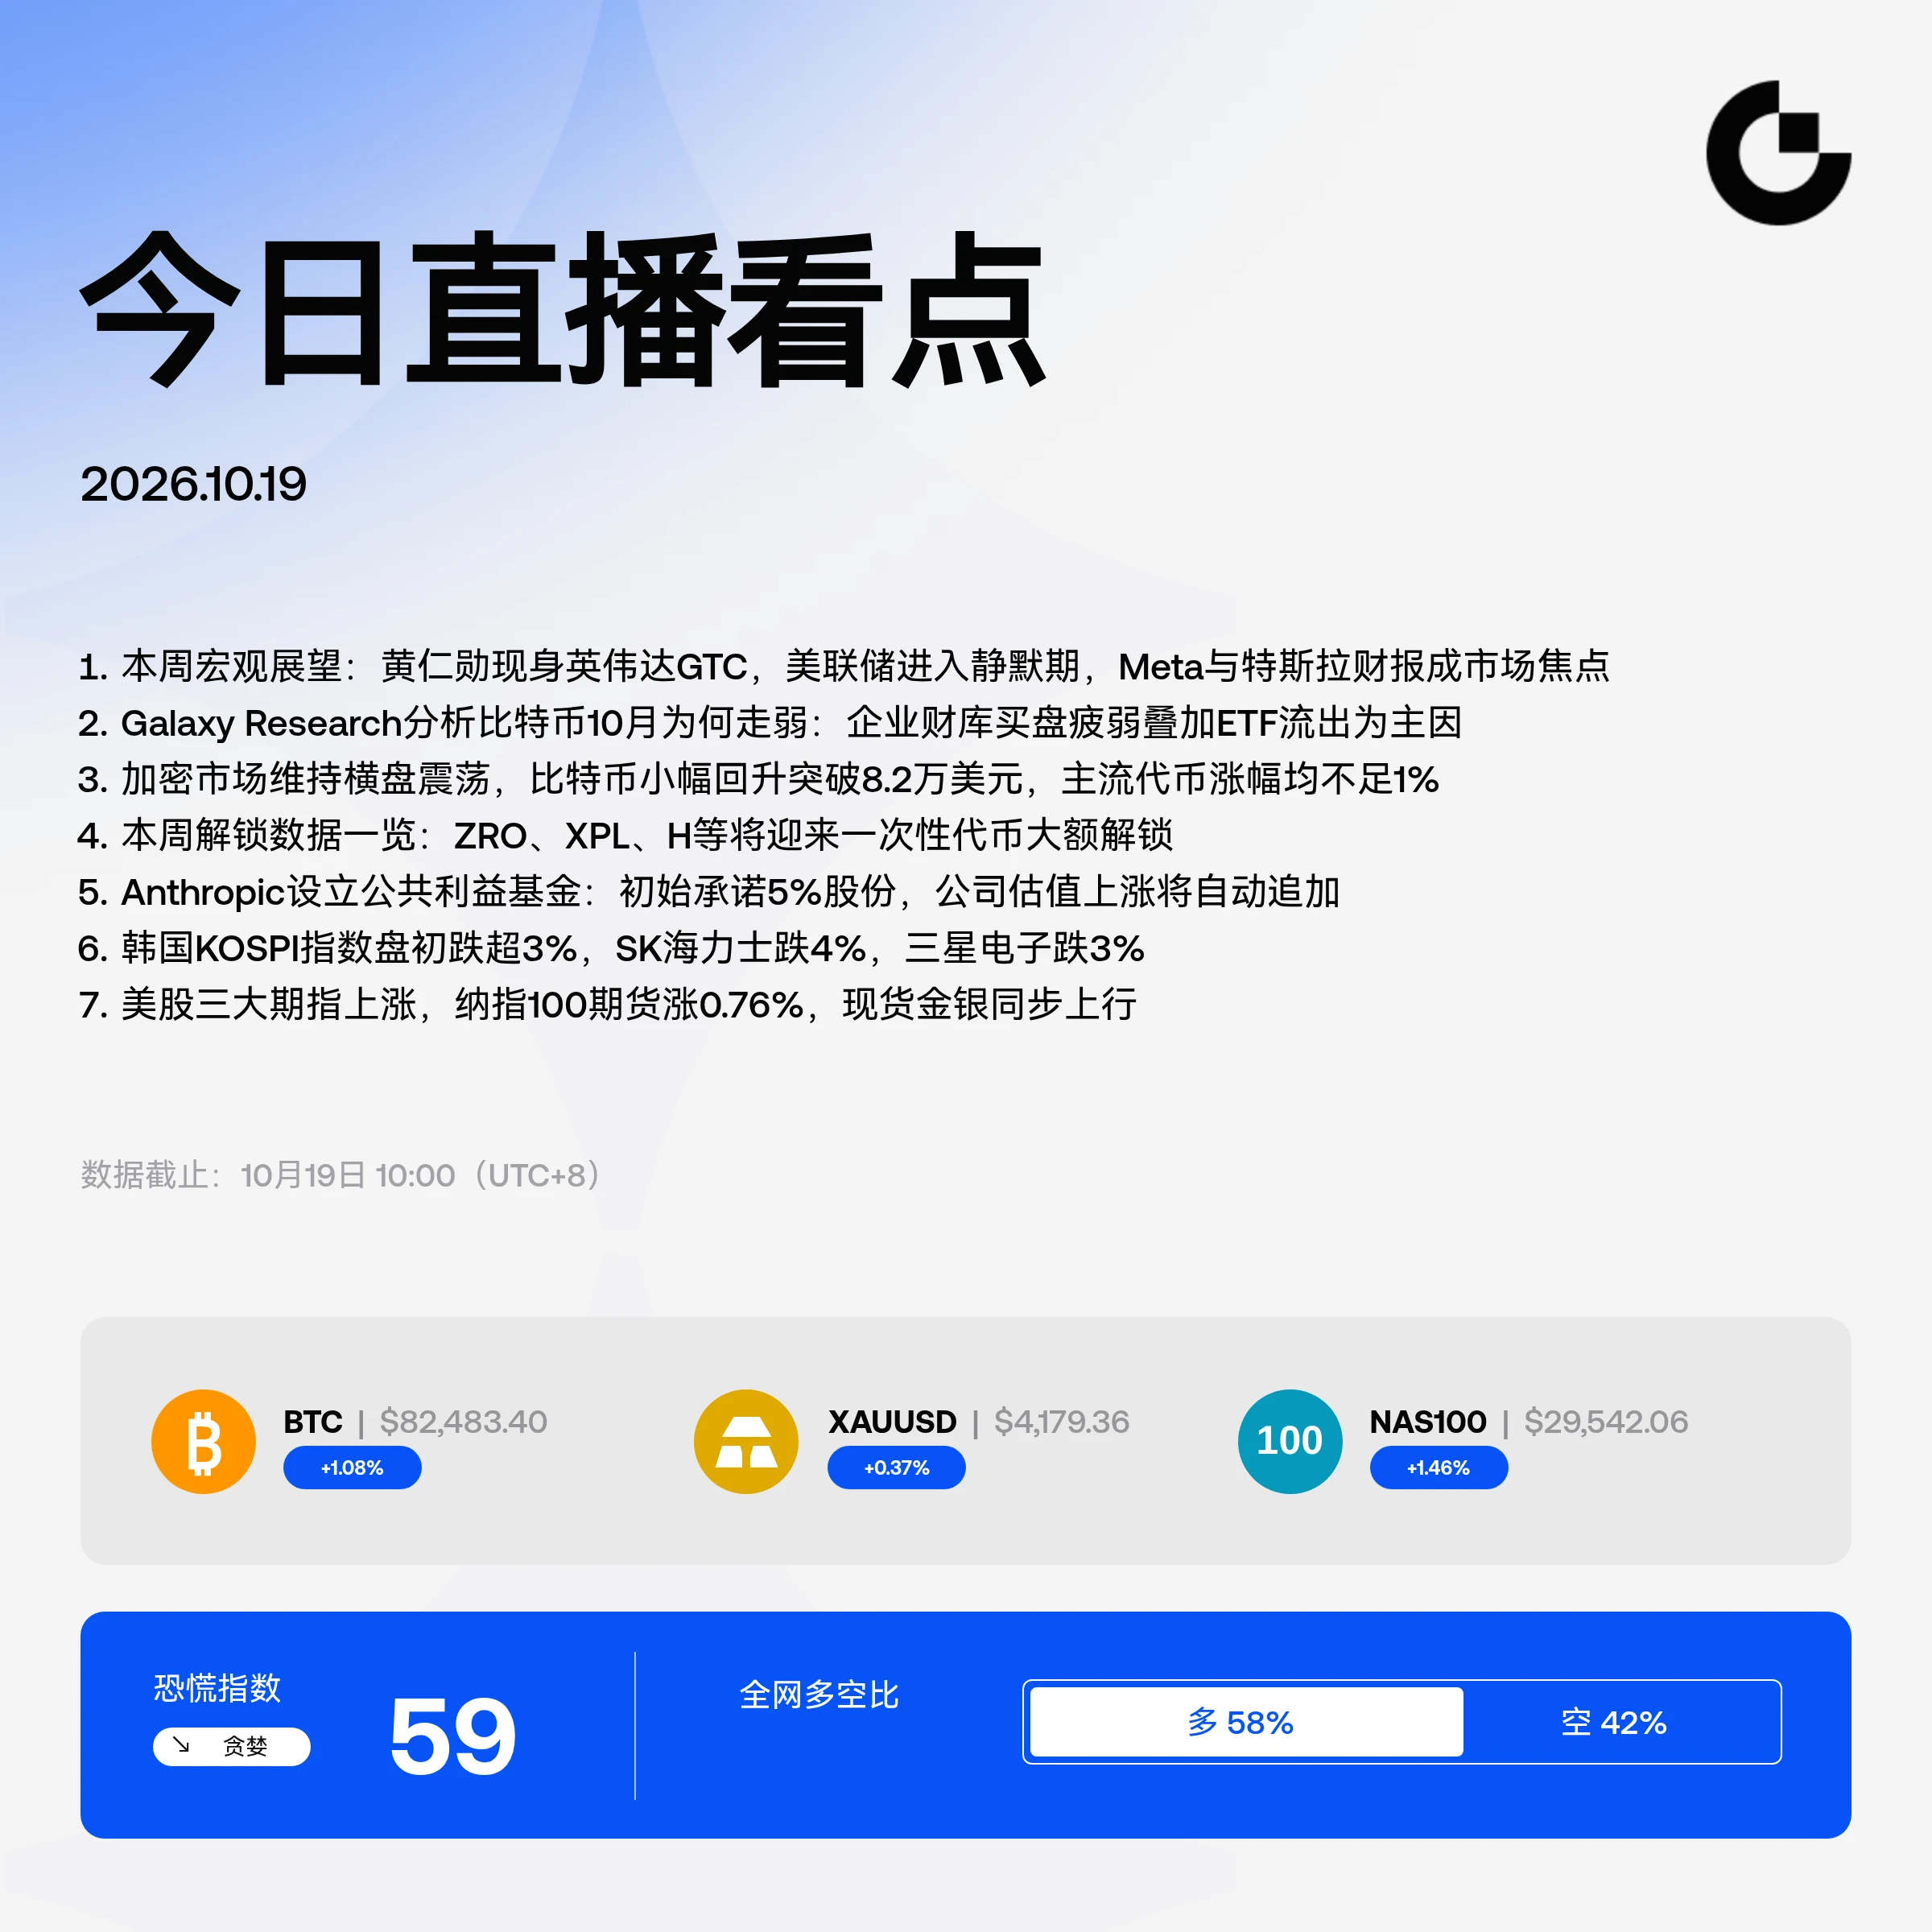
The big 💊 is coming: 7 tokens worth over $100 million will unlock this week
LayerZero (ZRO) will unlock approximately 23.28 million tokens at 7 p.m. on October 20, about 3.83% of its circulating supply, worth approximately $43.3 million;
Kaito (KAITO) will unlock approximately 17.6 million tokens at 8 p.m. on October 20, about 3.69% of its circulating supply, worth approximately $5 million;
SOON (SOON) will unlock approximately 20.24 million tokens at 4:30 p.m. on October 23, about 3.50% of its circulating supply, worth approximately $6.3 million;
SoSoValue (SOSO) will unlock approximately 23
post-image
ZRO+0.38%
XPL-0.31%
H+1.21%
  • 1
Waking around a cliff while listening to stories from the best traders in the world in “Market Wizards” book.
Incredible morning and very grateful I can call this my life.
Biggest takeaway from the book so far:
Everyone has to find the style of trading / investing that fits your personality.
For me I am way better fundamental analyst than I am a technical perps trader.
  • 1
#TeslaRoadsterSparksMemeCoinSurge
#TeslaRoadsterMemeRally Tesla’s Rocket-Powered Roadster Ignites Crypto Speculation: Can FTR Lead the Next Meme-Coin Wave?
One headline. Three market forces. A new test for speculative crypto.
Tesla’s October 15 Roadster demonstration has brought together futuristic automotive technology, viral internet culture and fast-moving meme-coin speculation. The prototype’s rocket-style thrusters and dramatic airborne maneuvers captured global attention, while traders began looking for potential spillover into Tesla-themed tokens and the broader altcoin market.
But the
Falcon_Official
#TeslaRoadsterSparksMemeCoinSurge
#TeslaRoadsterMemeRally Tesla’s Rocket-Powered Roadster Ignites Crypto Speculation: Can FTR Lead the Next Meme-Coin Wave?
One headline. Three market forces. A new test for speculative crypto.
Tesla’s October 15 Roadster demonstration has brought together futuristic automotive technology, viral internet culture and fast-moving meme-coin speculation. The prototype’s rocket-style thrusters and dramatic airborne maneuvers captured global attention, while traders began looking for potential spillover into Tesla-themed tokens and the broader altcoin market.
But the opportunity is not simply about buying whatever trends next. The real edge comes from distinguishing a verified catalyst, measurable trading activity and sustainable market demand.
THE ROADSTER STORY: WHAT ACTUALLY HAPPENED?
Tesla unveiled its next-generation Roadster prototype at a SpaceX facility in Texas, demonstrating aerial maneuvers using a system involving SpaceX-developed thrusters. The vehicle performed a dramatic midair movement and landed, creating the kind of visual event that can spread rapidly across social media.
Production is planned for 2028, meaning the demonstration does not represent a mass-market vehicle currently available to buyers. The rocket-equipped configuration also faces practical and regulatory limitations.
There is no verified evidence that the demonstration ended with the car being destroyed. The viral narrative should therefore be separated from unsupported claims about a crash or failed experiment.
The event matters to crypto because recognizable brands and extraordinary demonstrations can create attention faster than fundamentals can change.
FTR: A VIRAL CATALYST MEETS ON-CHAIN TRADING
Flying Tesla Roadster (FTR) became one of the tokens associated with the story. On October 16, market reports described a sharp speculative surge, with some versions of FTR recording dramatic percentage gains.
However, FTR is not a single, unambiguous asset. Multiple tokens using similar names or tickers appeared across different blockchain networks, with materially different prices, liquidity and trading histories.
That distinction is crucial. One Solana-based FTR listing showed approximately $244,100 in 24-hour volume and $459,300 in liquidity in a market snapshot, while other similarly named tokens had much smaller liquidity pools. These figures relate to a specific listing and should not be combined into one market valuation.
A rapidly rising token price is not sufficient evidence of sustainable demand. Liquidity depth, holder concentration, contract identity and the ability to exit a position can matter more than a headline percentage gain.
BTC, TSLAX AND MEME: IS THE RALLY SPREADING?
Bitcoin remains an important reference point for crypto risk appetite. If BTC stabilizes and broader market participation improves, traders may become more willing to explore speculative altcoins. Yet meme tokens can diverge sharply from Bitcoin, particularly when their prices depend on individual viral events.
TSLAX also requires careful identification. A Tesla-themed ticker should not automatically be treated as Tesla stock, an officially endorsed cryptocurrency or a token backed by company shares. Its precise contract, issuer and underlying structure must be verified before drawing conclusions about its performance.
Likewise, a reported move of nearly 10% in MEME needs to be checked against the exact asset and trading venue. A ticker alone does not establish which token is moving or whether the rally is supported by meaningful liquidity.
THREE SIGNALS THAT MATTER MORE THAN HYPE
Volume quality: Is trading activity sustained across multiple sessions, or does it disappear after the initial headline?
Liquidity and concentration: Can traders enter and exit without substantial slippage, and is ownership concentrated among a small number of wallets?
Market confirmation: Is Bitcoin stabilizing while participation broadens across established altcoins, or is activity confined to a handful of newly launched tokens?
These indicators help separate a wider sentiment recovery from isolated, short-lived speculation.
THE OPPORTUNITY — AND THE RISK
The bullish scenario is straightforward: the Roadster story remains visible, trading activity expands, and improving crypto sentiment supports further speculative participation.
The opposing scenario is equally important. Attention fades, early buyers take profits, and thin liquidity magnifies the downside. Newly launched meme tokens can lose value rapidly, even when their underlying internet narrative remains popular.
No price target or guaranteed breakout can be justified by the Roadster demonstration alone.
FINAL TAKEAWAY
Tesla has supplied a powerful headline, but the crypto market still has to prove that attention can become lasting participation. FTR demonstrates how quickly a recognizable story can generate speculative activity, while BTC, TSLAX and MEME each require independent verification.
The strongest approach is to verify the exact asset, examine its liquidity and trading history, and distinguish genuine market recovery from a temporary social-media frenzy.
In a market driven by narratives, attention creates the first move. Liquidity, participation and risk management determine what happens next. @Gate_Square
TSLA-2.17%
TSLAX+2.30%
BTC+0.95%
MEME-1.54%
SOL+1.33%
  • 2
🌐 ONEA NETWORK—Value should not stop at borders.
The internet has made the world more closely connected than ever before.
Creators can reach global audiences, remote workers can serve overseas clients, and small businesses have the opportunity to connect with consumers in different countries.
However, cross-border exchanges of value may still involve multiple platforms, different payment methods and currencies, and complex processes.
The digital economy is going global, but the infrastructure supporting it still has room to become more interconnected.
🔗 Making global opportunities easier to
post-image
  • 2
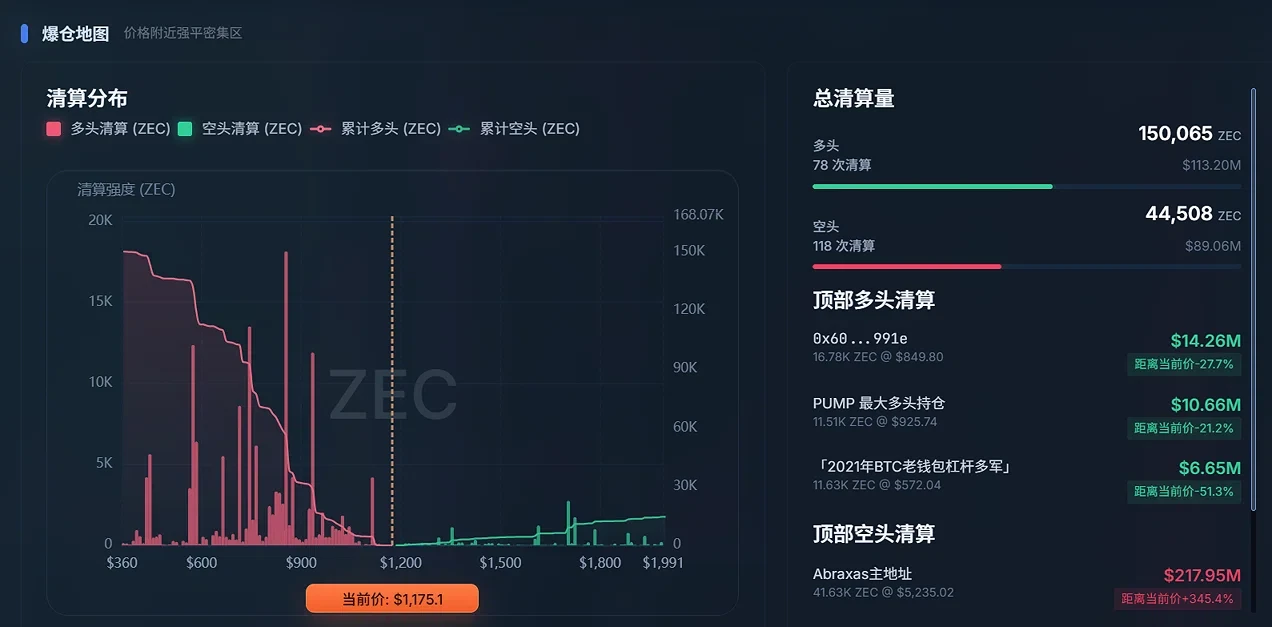
Longs have been brutally liquidated; the time to short at highs has arrived! Suggested direction: Short. Entry: Aggressive: around 1180 at the current price; conservative: wait for a rebound to 1220 before entering. Targets: 1100, then 1050 if support breaks. Rationale: Negative news: The NU7 proposal to freeze Sprout spending has sparked panic selling. Market under pressure: Moving averages are strong resistance on the 4-hour chart, indicators are overbought, and 1180-1220 above is a dense liquidation zone. Data confirms: The liquidation map shows very little short liquidation volume above, w
post-image
$SKHYNIX A sharp V-shaped rebound after a 4% plunge! The short squeeze battle for SK Hynix is on—retail traders, don't catch a falling knife!
Markets are always born in despair, but low-volume rebounds are often traps set by big players to lure buyers in.
Market news: South Korea's KOSPI plunged in early trading, with SK Hynix down 4% and Samsung down 3%; however, U.S. semiconductor stocks recovered overnight, and Nasdaq futures rose nearly 1%, as bulls and bears engaged in fierce contention.
On the 1-hour chart, SKHYNIX staged a V-shaped rebound after bottoming at 853; the MACD formed a golde
SKHYNIX+5.74%
MU-5.66%
NVDA-1.42%
new update
live-cover
LIVE1,729
Starlink | Recent Market Update | October 9–October 19
Since October 9, BTC has yet to establish a clear one-way trend and has continued to fluctuate within a range overall.
BTC has moved up and down by two to three thousand points, while ETH has also fluctuated by around 150 points. It may seem like there are opportunities every day, but in reality the market keeps swinging back and forth: chasing rallies can easily lead to pullbacks, while chasing declines can just as easily run into a rebound.
BTC is currently around 82,400, with the previous low near 79,700. Even after rebounding, it has n
BTC+0.95%
ETH+0.27%
$XAUT First win secured for the new partner
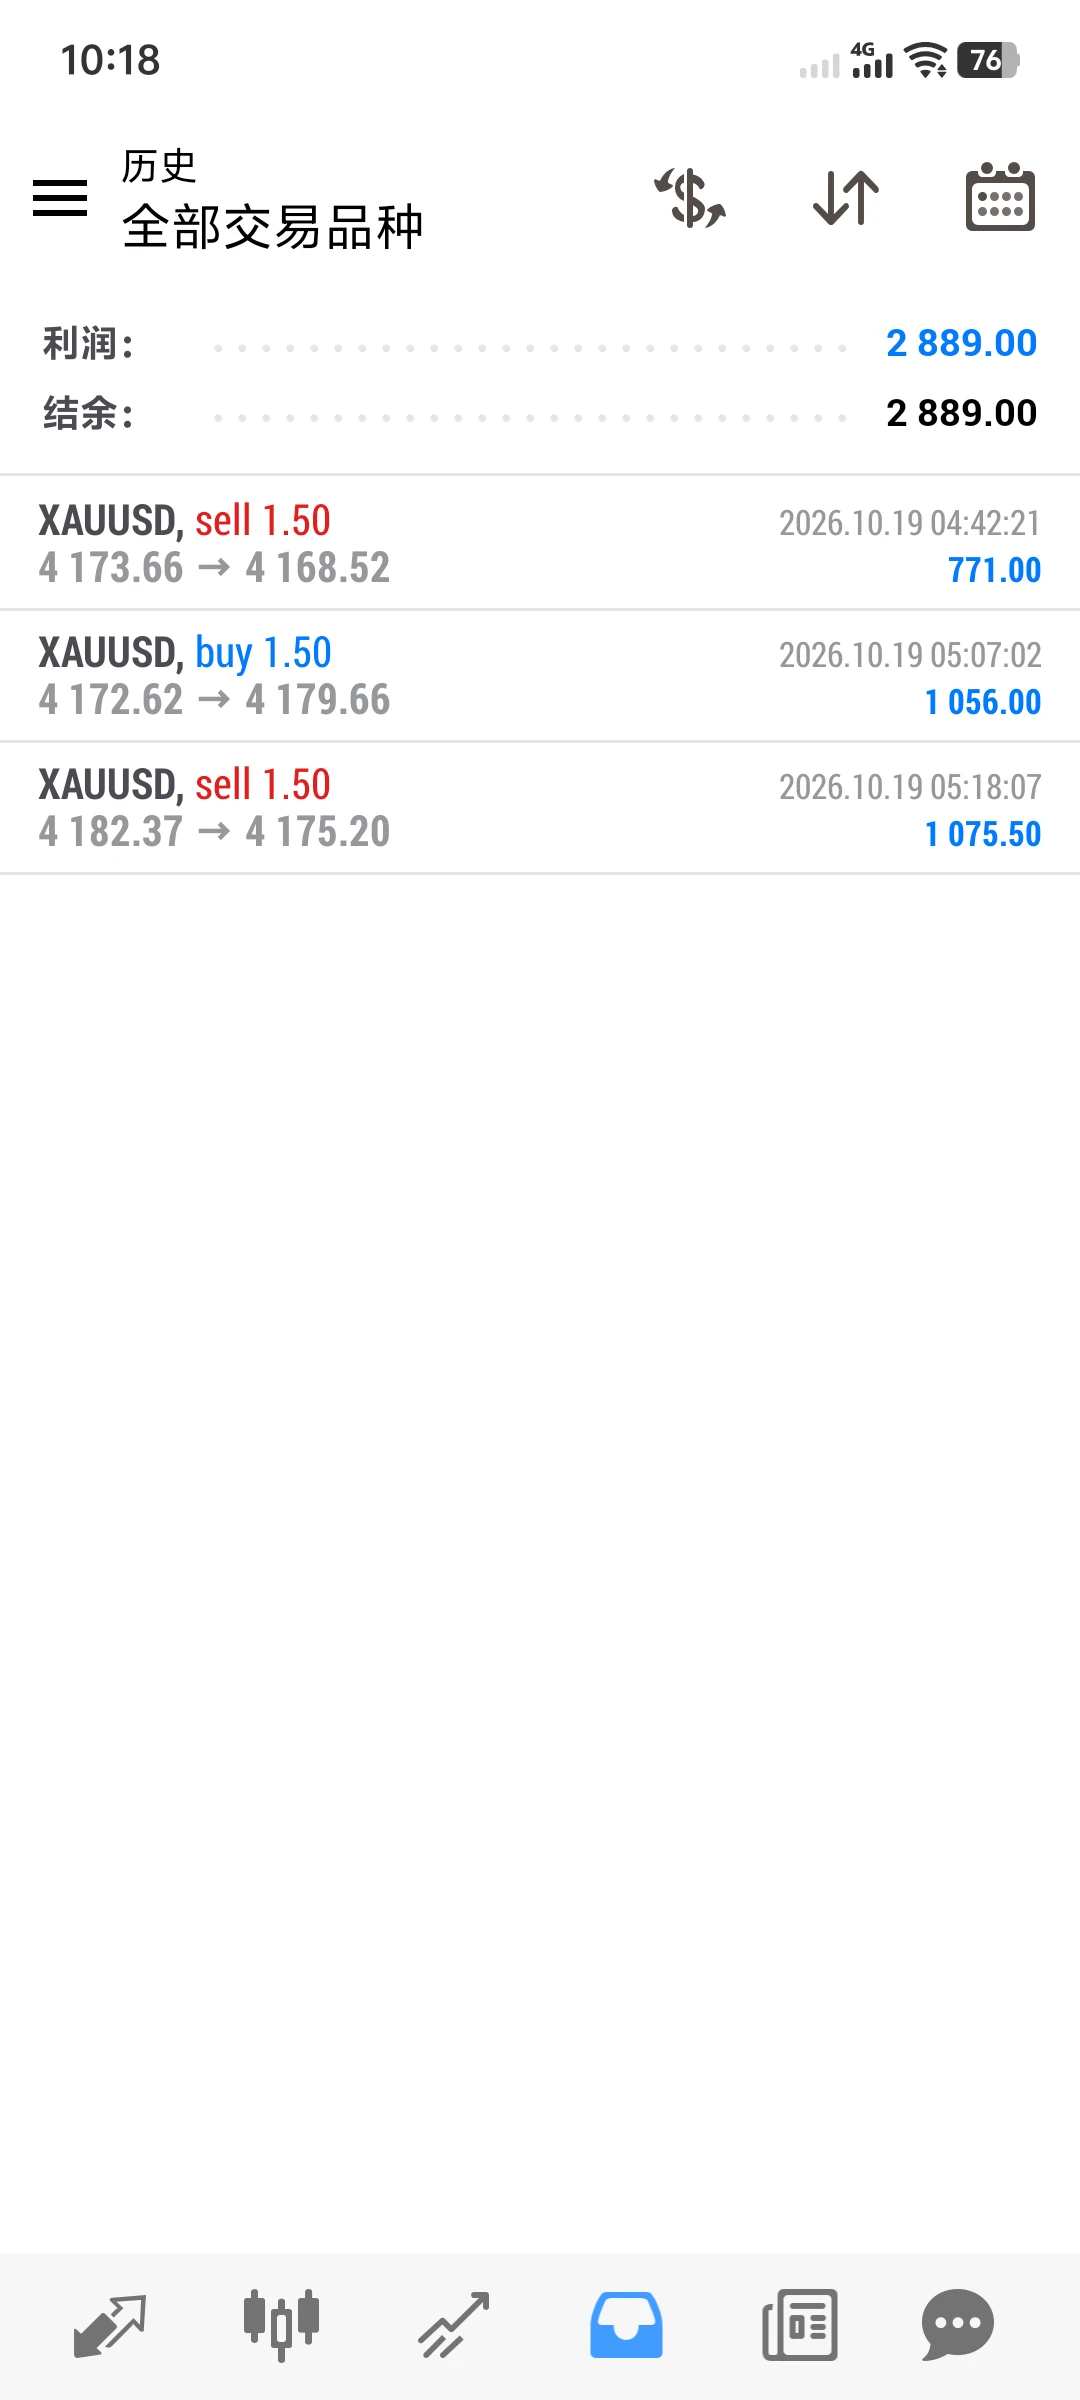
4169➡️4178, bought the pullback low and took $1,900 in profit. Stay calm, be patient, and keep moving forward!
XAUT+0.39%
Three consecutive intraday wins for gold
Shorted at 4182, exited at 4175, 7 points, 1075🔪$XAUT
post-image
XAUT+0.39%
🔥 Get a first look at market opportunities for the new week!
Gate Live hosts trade live every day, share trading insights, and help you track market movements in real time!
📈 How can you gauge the market direction?
🚀 Which sectors are gaining momentum?
👀 Which key signals are worth watching?
Tune in to Gate Live and find the answers in the livestream 👉 https://www.gate.com/live
GateLiveChinese
🔥 Get a first look at market opportunities for the new week!
Gate Live hosts trade live every day, share trading insights, and help you track market movements in real time!
📈 How can you gauge the market direction?
🚀 Which sectors are gaining momentum?
👀 Which key signals are worth watching?
Tune in to Gate Live and find the answers in the livestream 👉 https://www.gate.com/live
repost-content-media
#美股存储板块跌幅扩大 The Nature of the U.S. Tech Pullback Is Shifting: From Valuation Repricing to Credit-Chain Repricing
Many people are still viewing U.S. stocks through the old “AI pullback = buying opportunity” playbook. But if you only watch the Nasdaq and the Philadelphia Semiconductor Index, you may miss the most important change:
July was “AI valuation/positioning repricing”; October is a triple hit from “the AI credit chain + high interest rates + geopolitics/oil prices.” The latter is closer to a “credit-side preview” of the bursting of the 2000 internet bubble, but we’re not yet in a full-bl
Falcon_Official
#美股存储板块跌幅扩大 The Nature of the U.S. Tech Pullback Is Shifting: From Valuation Repricing to Credit-Chain Repricing
Many people are still viewing U.S. stocks through the old “AI pullback = buying opportunity” playbook. But if you only watch the Nasdaq and the Philadelphia Semiconductor Index, you may miss the most important change:
July was “AI valuation/positioning repricing”; October is a triple hit from “the AI credit chain + high interest rates + geopolitics/oil prices.” The latter is closer to a “credit-side preview” of the bursting of the 2000 internet bubble, but we’re not yet in a full-blown bear market.
I. July pullback: Expensive, crowded, but no blowup!
Trigger: Google/Meta/Tesla raised CAPEX forecasts, FCF turned negative, and the market asked, “When will AI spending pay off?”
QQQ fell from a June high of ~$748.65 to a July 29 low of $661.14, a peak-to-trough decline of 11.7%; QQQ fell 6.5% for the full month of July, and SOXX fell 21%.
The 10-year Treasury yield was at 4.6–4.75%; the VIX spiked to 20.66 on a weekly basis (+24%), but the broad VIX did not stay above 22. VXN reached 26, but there was no panic spike.
The S&P edged down, while equal-weight stocks rose; money rotated within equities (tech → Dow/healthcare/consumer). Bonds didn’t rally, and yields rose → this wasn’t a flight to safety, but “semiconductors are too crowded, trim them first.”
Outcome: The 200-day moving average at $645 held, and stocks recovered after August. This was a correction that could be bought.
II. October pullback: From “valuation” to “who can’t repay their loans?”
The logic behind this tech pullback since October is more like:
Borrow at a 15% cost to build compute capacity → rental income can’t cover interest → credit cracks appear first → semiconductor order expectations get cut → quite a few sell-side firms are using the 2000 internet bubble as a reference (the Nasdaq crashed, while long-bond yields fell from 6.5% to the mid-4% range).
Market action: It’s not a broad selloff; “highly leveraged growth + AI infrastructure” are being singled out for punishment. From 10/14–10/16, the Dow rose 0.67% for the week, XLV/energy were strong, the SPX fell ~1.95% for the week, and the Nasdaq fell 4.48% for the week (its worst since June); the Philadelphia Semiconductor Index (SOX) fell for 8 straight days (the longest streak since 2008);
Among individual stocks: CRWV fell 25% for the week, CDS breached 1000bp, and its 5-year default probability was priced at 60%+.
The 10-year Treasury yield fell from 5.3% to 5.07–5.19%, but this was a safe-haven decline as stocks fell and money fled into Treasuries, not a central-bank rescue; the VIX broke above 22, Brent crude topped 110, and tensions in the Middle East and Russia-Ukraine escalated.
Investor sentiment: the CNN Fear & Greed Index fell to 18, but it’s not yet at the extreme “2–4” levels seen in 2018/2020—meaning the market is shifting from “uncomfortably expensive” to “a little worried about credit,” but this is not a COVID-style liquidity collapse.
III. How have similar “credit-side + tech selloff” pullbacks played out historically?
The 2000 internet bubble burst: The Nasdaq was cut in half, then cut in half again from its peak, while the S&P lagged; valuations were hit first, then earnings, then credit, and bonds ultimately entered a bull market. The difference today: major tech issuers aren’t pure concepts; their cash flows/cloud revenues are real. So this isn’t a repeat of 2000, but “the 2000 credit playbook + the 2022 interest-rate playbook.”
The 2022 rate-driven growth selloff: The 10-year Treasury yield surged from 1.5% to 4.3%, QQQ fell 35% from its peak, and SPY fell 25%; the core issue was the “discount rate,” not credit defaults. The 10-year Treasury yield is now above 5%; megacaps are hurting, but banks/consumer/healthcare haven’t collapsed.
2018 Q4 deleveraging: The VIX spiked to 35, QQQ fell about 20% for the quarter, and stocks made a V-shaped recovery after the Fed turned dovish; the Fed isn’t as hawkish now, but inflation + oil prices mean it can’t turn dovish freely.
March 2020 liquidity black hole: The VIX hit 80, and stocks, bonds, and gold all fell together, with the Fed providing a backstop; there’s no COVID-style liquidity freeze now, and CRWV is an individual credit event, not a market-wide counterparty crisis.
Historical rules of thumb
“VIX above 20 + 10-year Treasury yield rising + tech leading declines” → usually the middle of a pullback, not the bottom.
“VIX plateauing at high levels + 10-year Treasury yield starting to fall + semiconductors no longer making new lows” → only then is it a signal to add to QQQ.
Until credit events (CDS widening, high-yield bond spreads widening) stabilize, every QQQ rebound is prone to being sold.
Historical timing reference: the July pullback took 3–5 weeks to recover; with an October-style “credit + rates + geopolitics” combination, a bottom usually isn’t in until the VIX returns to 16–18, CRWV bonds stop falling, and SOXX posts a high-volume candle without making a new low. This often takes 3–8 weeks; if credit spreads widen to Oracle/major tech bonds, it can drag on for a quarter.
IV. The counterintuitive point during earnings season: stock prices are falling, but earnings haven’t collapsed. In the first week of the new 26Q3 earnings season, about 9% of large S&P 500 companies had reported earnings. Stock prices are falling, but earnings haven’t collapsed—the declines reflect “discount rates + credit expectations,” not “current results.”
Companies that have reported: earnings up 29% year over year, revenue up 12.6%;
26Q1 earnings up 28.6%, 26Q2 up 50.4% → the strongest earnings cycle since 2021Q2;
Market pricing for full-year 2026: earnings up 32.8%, revenue up 12.7%;
Q3/Q4 earnings expectations: +29% / +28.6%;
The S&P’s forward P/E is 19.0: below the 10-year average of 19.1 and the 5-year average of 19.8.
This isn’t an “earnings collapse”; the market is getting ahead of three fears:
① AI CAPEX returns in 2027 will fall short of expectations;
② 10-year Treasury yields at 5%+ will discount long-duration assets;
③ AI credit-chain players like CoreWeave will blow up first.
So this is neither 2000 (earnings fraud/disappearance) nor 2022 (earnings downgrades + interest-rate battering). It’s “earnings are very strong, but valuation logic is being repriced for credit risk.”
V. Why is the week of October 19–23 a turning point?
This isn’t an ordinary earnings week. It’s a week to “use real-economy cash flows to rescue tech valuations.”
1) Wednesday’s two pillars: META + TSLA
What to watch for in META:
Will CAPEX be revised higher again, how are advertising/AI monetization progressing, and what is happening with free cash flow?
If it says “we’re continuing to invest more in AI, but ROI is clear” → it eases July-style spending concerns;
If it says “returns are slower than expected” → QQQ could sell off again.
What to watch for in TSLA:
It’s not just a car company; it’s a high-beta proxy for “AI / robotics / energy storage.”
Deliveries, gross margin, FSD, and what it says about Optimus matter more than sales volume.
A weak TSLA → high-beta tech sentiment could collapse again.
2) Industrial / defense / payments: proof that “the non-AI parts of the economy are holding up”
GE, RTX, NOC, LMT, MMM, UNP, CAT names (URI), AXP, COF:
Industrial orders = the temperature of the real economy;
Credit cards (AXP/COF) = consumer resilience and delinquencies;
Defense (RTX/NOC/LMT) = a geopolitical premium, but with budget constraints.
If they hold up, investors will be more willing to stay in SPY / XLI / XLV rather than go back to catch the falling knife in QQQ.
3) Macro anchors
Tuesday: housing starts / existing-home sales → has housing frozen under 5%+ rates?
Thursday: initial jobless claims + leading indicators → are there cracks in employment?
Friday: manufacturing / services PMI → soft landing or a second downturn in manufacturing?
These data will determine whether the 10-year Treasury yield holds 5.0% or surges to 5.3%–5.5%, and will directly determine the discount rates for SPY / QQQ.#WCTCS9
  • 1
**__$ETH __****__ LONG SETUP __****__🔥__**
**__SETUP__** **__INVALID IF 4H CANDLE CLOSE BELOW TRENDLINE __**‼️------------**__$ETH__****__ LONG SETUP __****__🔥__**
**__SETUP__** **__INVALID IF THE 4H CANDLE CLOSES BELOW THE TRENDLINE __**‼️--------------------------------$KOGE $GT $BAT #bitcoin
ETH+0.29%
GT-0.89%
BAT-3.42%
BTC+0.95%
CFTC unveils a new crypto regulatory proposal! Platforms can voluntarily submit to unified federal o
live-cover
LIVE1,996
Load More

Join 40 M users in our growing community

⚡️ Join 40 M users in the crypto craze discussion

💬 Engage with your favorite top creators

👍 See what interests you

Trending Topics

StakeLaunchPoolToShare2.8M$DNA

36.47k Views651 Discussing

Gate LaunchPool’s DNA debut campaign is now live with a total reward pool of 2.8M $DNA. Stake $BTC, $ETH, or $DNA to participate, with rewards distributed hourly. If you’re looking for a simple way to join a new-token opportunity. [👉 Join Now](https://www.gate.com/launchpool/554)

GateWCTCS9GlobalTradingCompetition

37.93k Views6.86k Discussing

BitcoinTops$82K

6 Views2.22k Discussing

View More