Trade
Trading Type
Spot
Trade crypto freely
Alpha
Points
Get promising tokens in streamlined on-chain trading
Pre-Market
Trade new tokens before they are officially listed
Margin
Magnify your profit with leverage
Convert & Block Trading
0 Fees
Trade any size with no fees and no slippage
Leveraged Tokens
Get exposure to leveraged positions simply
Futures
Futures
Points
Hundreds of contracts settled in USDT or BTC
Options
HOT
Trade European-style vanilla options
Unified Account
Maximize your capital efficiency
Demo Trading
Futures Kickoff
Get prepared for your futures trading
Futures Events
Participate in events to win generous rewards
Demo Trading
Use virtual funds to experience risk-free trading
Earn
Launch
CandyDrop
Collect candies to earn airdrops
Launchpool
Quick staking, earn potential new tokens
HODLer Airdrop
Hold GT and get massive airdrops for free
Launchpad
Be early to the next big token project
Alpha Points
New
Trade on-chain assets and enjoy airdrop rewards!
Futures Points
New
Earn futures points and claim airdrop rewards
Investment
Simple Earn
Earn interests with idle tokens
Auto-Invest
Auto-invest on a regular basis
Dual Investment
Buy low and sell high to take profits from price fluctuations
Soft Staking
Earn rewards with flexible staking
Crypto Loan
0 Fees
Pledge one crypto to borrow another
Lending Center
One-Stop Lending Hub
VIP Wealth Hub
New
Customized wealth management empowers your assets growth
Private Wealth Management
Customized asset management to grow your digital assets
Quant Fund
Top asset management team helps you profit without hassle
Staking
Stake cryptos to earn in PoS products
BTC Staking
HOT
Stake BTC and earn 10% APR
GUSD Minting
New
Use USDT/USDC to mint GUSD for treasury-level yields
More


Max_JunGe
No content yet
Max_JunGe
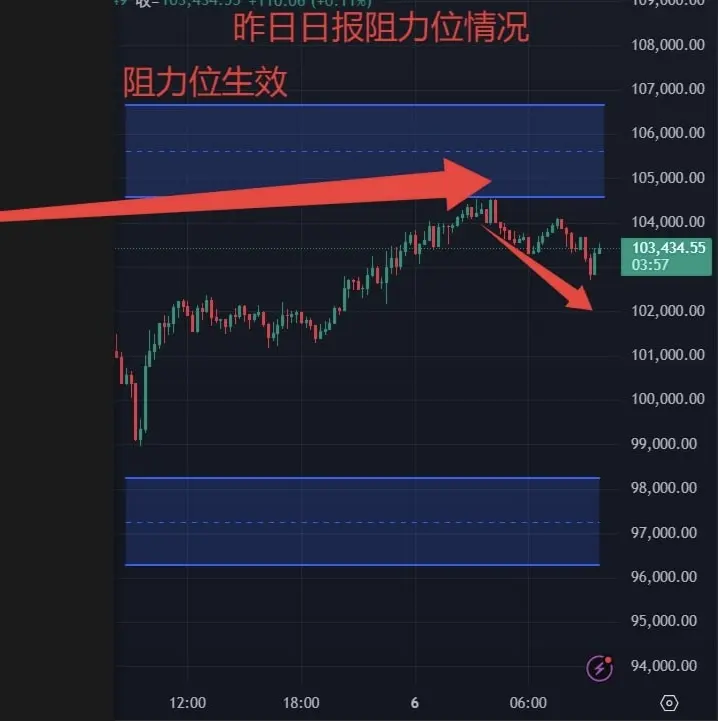
#BTC Market Analysis for 11.6
Resistance range for Bitcoin within the day: 105950-107300
The daily support range for the pancake is 101700-100400
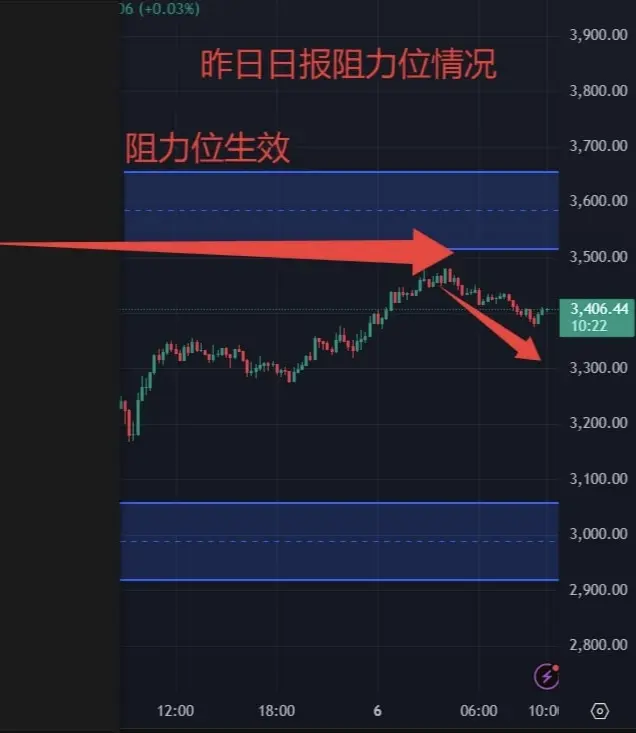
Auntie's daily resistance range 3545-3615
Auntie Tai's intraday support range 3300-3230
Market Analysis
The BTC daily chart shows that after a recent price fluctuation at a high level, it has retreated, forming a long upper shadow and a bearish candle, indicating heavy selling pressure above. The hourly chart presents a continuous slight downward trend, with gradually lowering lows, suggesting that bears are dominant in the short term. The M
View OriginalResistance range for Bitcoin within the day: 105950-107300
The daily support range for the pancake is 101700-100400
Auntie's daily resistance range 3545-3615
Auntie Tai's intraday support range 3300-3230
Market Analysis
The BTC daily chart shows that after a recent price fluctuation at a high level, it has retreated, forming a long upper shadow and a bearish candle, indicating heavy selling pressure above. The hourly chart presents a continuous slight downward trend, with gradually lowering lows, suggesting that bears are dominant in the short term. The M
- Reward
- like
- Comment
- Repost
- Share
Latest BTC news 🔥
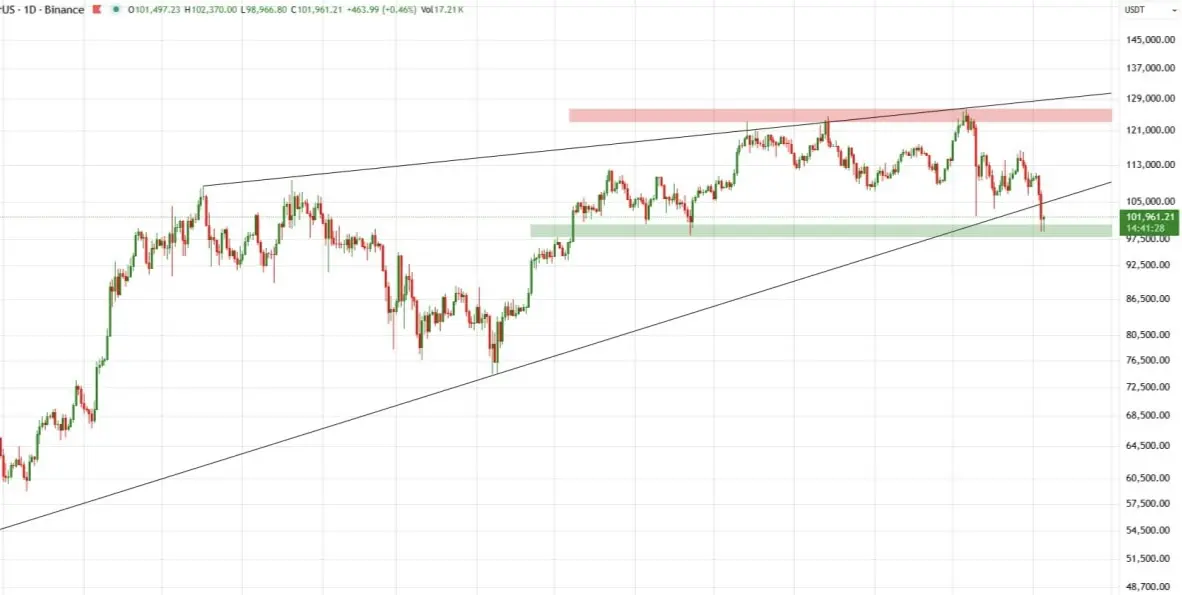
Bitcoin is currently testing the lower boundary of an ascending wedge pattern, having previously broken below the trendline support. This breakdown suggests potential weakness, particularly if the price remains below this level.
If the bulls fail to hold this green support area, the price may further decline to $90,000.
However, if the price rebounds strongly and closes above the wedge support level, the bearish pattern will be invalidated, and it may attempt to target the range of 110,000 to 115,000 again.
$BTC
BTC-2.62%
- Reward
- like
- Comment
- Repost
- Share
#BTC #ETH 1.5 Market Analysis
Bitcoin intraday resistance range 104650-106650
Bitcoin intraday support range 98250-96300
Auntie Tai's resistance zone 3513-3655
Aunt's intraday support range 3056-2915
Market Analysis
The daily chart for BTC shows a continuous decline, forming a large bearish candle, with the price quickly falling from 106584.3 to 99000, indicating a clear bearish trend. Recent hourly fluctuations have been intense, with multiple K-lines showing long upper shadows and significant bearish candles, indicating strong selling pressure. The MACD on the hourly chart is below
View OriginalBitcoin intraday resistance range 104650-106650
Bitcoin intraday support range 98250-96300
Auntie Tai's resistance zone 3513-3655
Aunt's intraday support range 3056-2915
Market Analysis
The daily chart for BTC shows a continuous decline, forming a large bearish candle, with the price quickly falling from 106584.3 to 99000, indicating a clear bearish trend. Recent hourly fluctuations have been intense, with multiple K-lines showing long upper shadows and significant bearish candles, indicating strong selling pressure. The MACD on the hourly chart is below

- Reward
- like
- Comment
- Repost
- Share
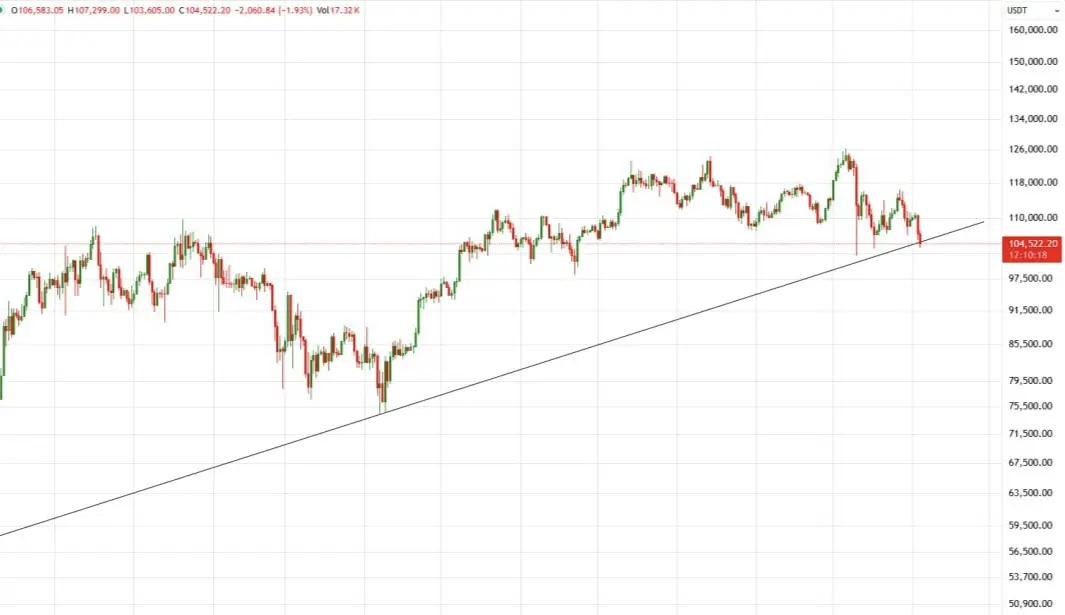
#BTC BTC market analysis on the evening of November 4th
Bitcoin is currently testing its long-term uptrend support line, which has remained strong since the end of 2023. The price has slightly weakened, hovering above this key level, indicating that the next few daily candles are crucial.
If the price strongly rebounds from the trend line, it may trigger a bullish market and is expected to continue rising to previous highs, thus confirming that the upward trend remains valid. However, if the price clearly breaks below the trend line with increased trading volume, it may indicate potential bea
BTC-2.62%
- Reward
- like
- Comment
- Repost
- Share
#ETH ETH Evening Analysis on November 4
Ethereum is currently testing the key demand area indicated on the chart. The price has seen a slight rebound in this area, suggesting that bulls are defending the support level. However, the overall momentum remains bearish, and the market continues to form a pattern of decreasing highs and lows.
If the support level holds, it may rebound to the previous resistance level in the short term. Conversely, if it clearly breaks below that level, it will trigger further downward continuation, confirming the market's bearish strength.
$ETH
ETH-3.93%
- Reward
- like
- Comment
- Repost
- Share
#BTC
After a significant correction, Bitcoin is currently trading close to a key support level, which is around the 105,000 area. The price continues to form lower highs below the descending trend line, indicating persistent selling pressure and a lack of bullish momentum when attempting to push the price higher.
A rebound from this support level may bring a short-term relief rally, but bulls need to break through the descending trend line to reverse the trend. If this support level fails and the price falls below this range with significant trading volume, a further downward trend may occur,
BTC-2.62%
- Reward
- like
- Comment
- Repost
- Share
#ETH:
ETH is short for Air Force ATM. Friend, when you need it today.
If it's about money, just do it directly, at any time and at any price.
Empty, it won't let you down, with no reaction on the monthly and weekly charts.
Damn, the current worst mainstream coin, no exceptions.
If you have money, don't go to Beijing, Shanghai, or Guangzhou; if you're in trouble, you'll definitely rely on Ethereum.
#ETH
$ETH
ETH-3.93%

- Reward
- 3
- Comment
- Repost
- Share
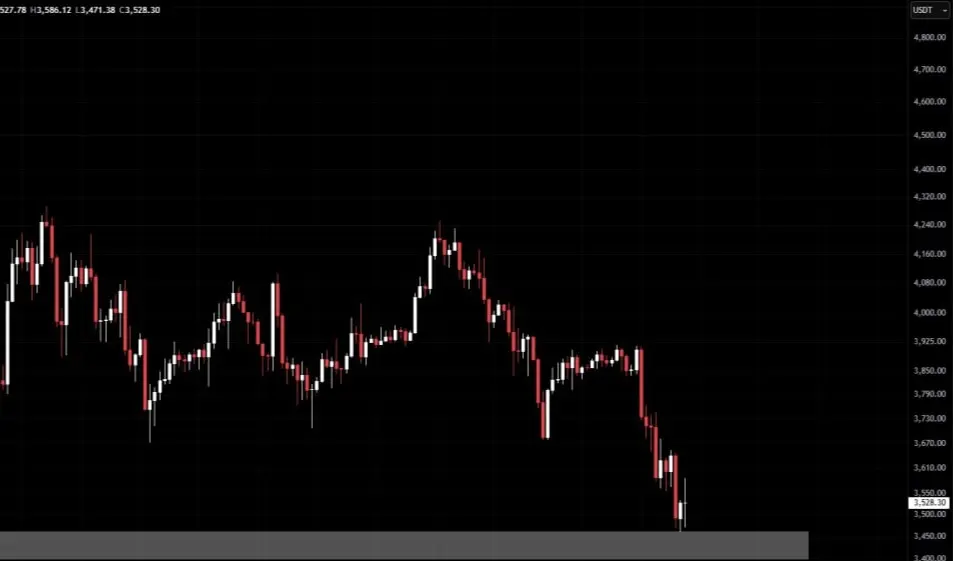
#ETH 1.4 ETH recently experienced a big dump on the 3rd, rebounding after hitting a low around 3558. It is currently in a consolidation and recovery phase, with the current K-line showing a small bullish candle. However, it has not yet broken through the previous high resistance level of 3649. The MACD: DIF and DEA are both negative, and DIF is slightly rising, indicating that the bearish momentum is weakening, but the bulls have not completely taken over. The current RSI14 is 40.72, approaching the neutral zone, showing that market sentiment is relatively stable, with no obvious overbought or
ETH-3.93%

- Reward
- 1
- Comment
- Repost
- Share
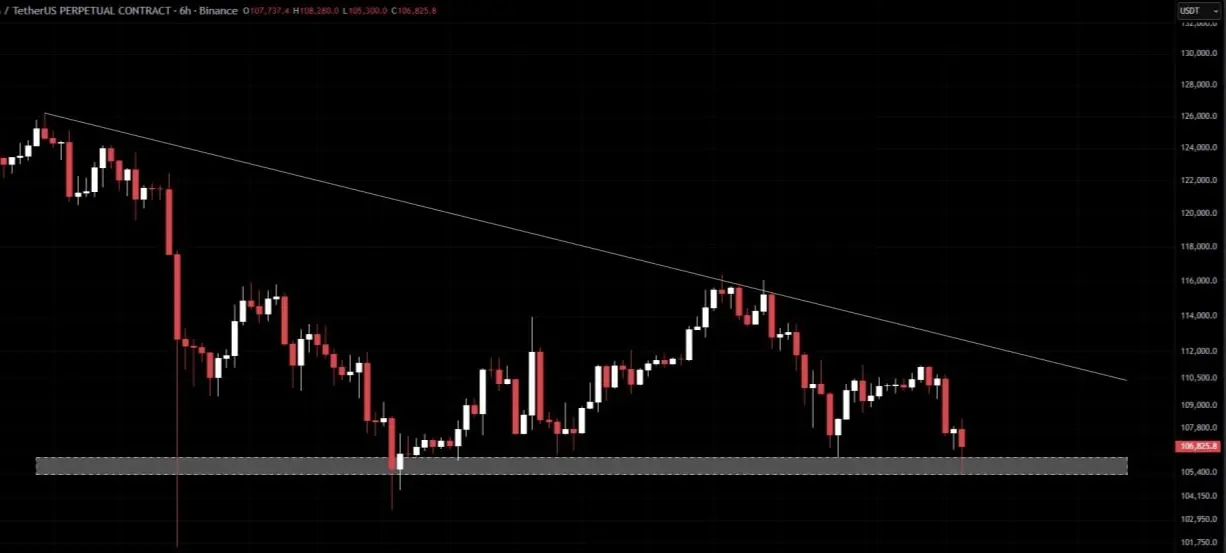
Daily Market Analysis for BTC and ETH on November 4th
BTC intraday resistance range 108600-109900
The intraday support range for BTC is 104500-103200.
Auntie Tai daily resistance range 3738-3823
Aunt's daily support range 3466-3381
Market Analysis
The daily chart for BTC shows a large bearish candle on the 3rd, with the price rapidly dropping from a high of 110750 to 106583, forming a clear plunge pattern. On the 4th, there was a small bullish candle rebound, but the momentum was weak. On the hourly chart, recent candlesticks exhibit a fluctuating trend, with a volatility range between 105
View OriginalBTC intraday resistance range 108600-109900
The intraday support range for BTC is 104500-103200.
Auntie Tai daily resistance range 3738-3823
Aunt's daily support range 3466-3381
Market Analysis
The daily chart for BTC shows a large bearish candle on the 3rd, with the price rapidly dropping from a high of 110750 to 106583, forming a clear plunge pattern. On the 4th, there was a small bullish candle rebound, but the momentum was weak. On the hourly chart, recent candlesticks exhibit a fluctuating trend, with a volatility range between 105
- Reward
- 1
- Comment
- Repost
- Share
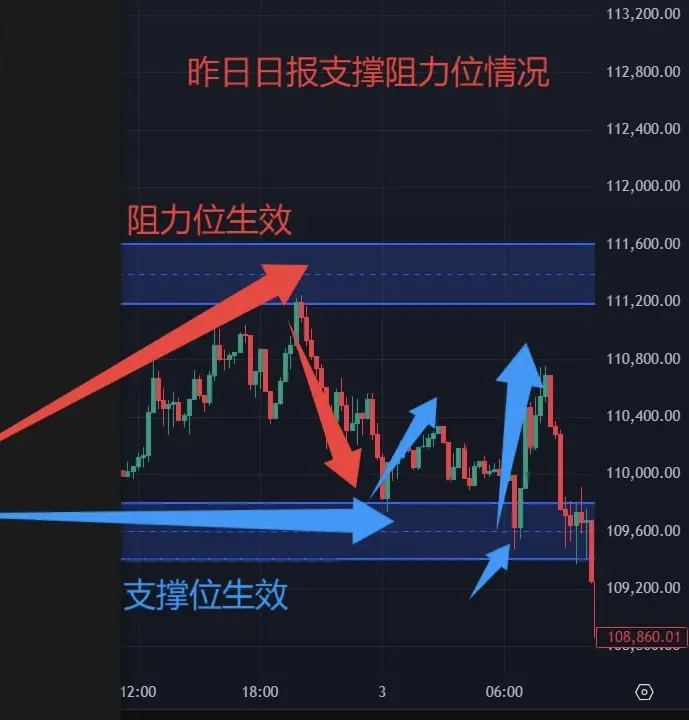
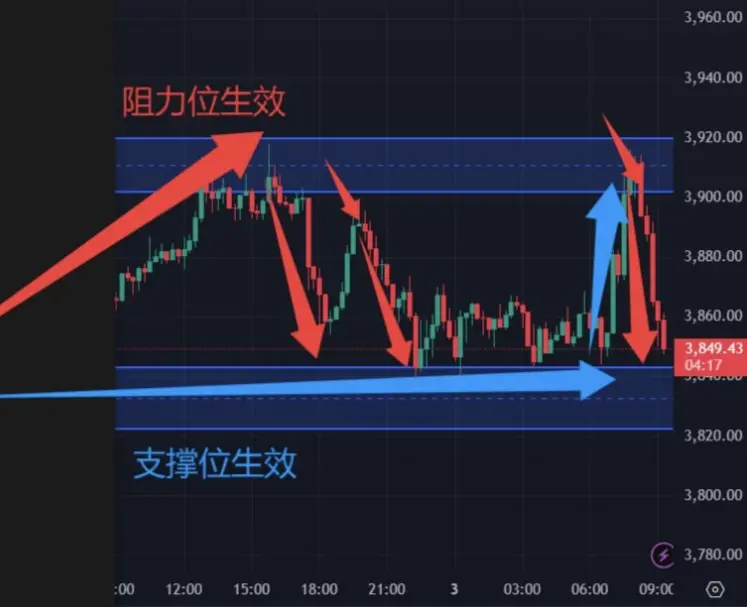
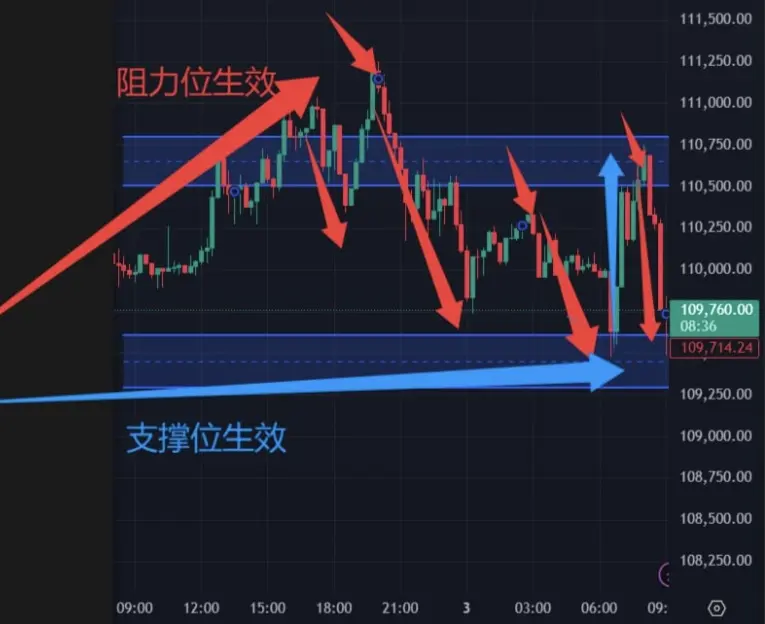
Market analysis of BTC and ETH on November 3rd.
The intraday resistance range for BTC is 111180-111600
The daily support range for BTC is 109800-109400
Auntie Tai resistance zone 3935-3954
Aunt's daily support range 3874-3855
The daily chart for BTC shows that the recent price is generally in a downward trend, with the closing price on the 3rd significantly retreating compared to the previous day, forming a bearish candle with a long upper shadow, indicating heavy selling pressure above. The hourly K-line shows a slight rebound after continuous declines, but the rebound strength is limited
View OriginalThe intraday resistance range for BTC is 111180-111600
The daily support range for BTC is 109800-109400
Auntie Tai resistance zone 3935-3954
Aunt's daily support range 3874-3855
The daily chart for BTC shows that the recent price is generally in a downward trend, with the closing price on the 3rd significantly retreating compared to the previous day, forming a bearish candle with a long upper shadow, indicating heavy selling pressure above. The hourly K-line shows a slight rebound after continuous declines, but the rebound strength is limited
- Reward
- 1
- Comment
- Repost
- Share
BTC.ETH market advice for October 31:
BTC intraday resistance range 110300-111550
The daily support range for BTC is 106250-104950
Aunt's daily resistance zone 3905-3968
Auntie's daily support range 3700-3636
Market Analysis
The daily chart for BTC shows that the recent price has pulled back from a high, forming a series of bearish candles before showing signs of a rebound, currently closing with a bullish candle. Overall, it presents a short-term stabilization state after a downward fluctuation. On the hourly chart, support is formed near 109000, and the current candlestick is gradual
View OriginalBTC intraday resistance range 110300-111550
The daily support range for BTC is 106250-104950
Aunt's daily resistance zone 3905-3968
Auntie's daily support range 3700-3636
Market Analysis
The daily chart for BTC shows that the recent price has pulled back from a high, forming a series of bearish candles before showing signs of a rebound, currently closing with a bullish candle. Overall, it presents a short-term stabilization state after a downward fluctuation. On the hourly chart, support is formed near 109000, and the current candlestick is gradual

- Reward
- like
- Comment
- Repost
- Share