
Square
Following
Hot
News
Notifications
Profile
Share your thoughts
placeholder
Article
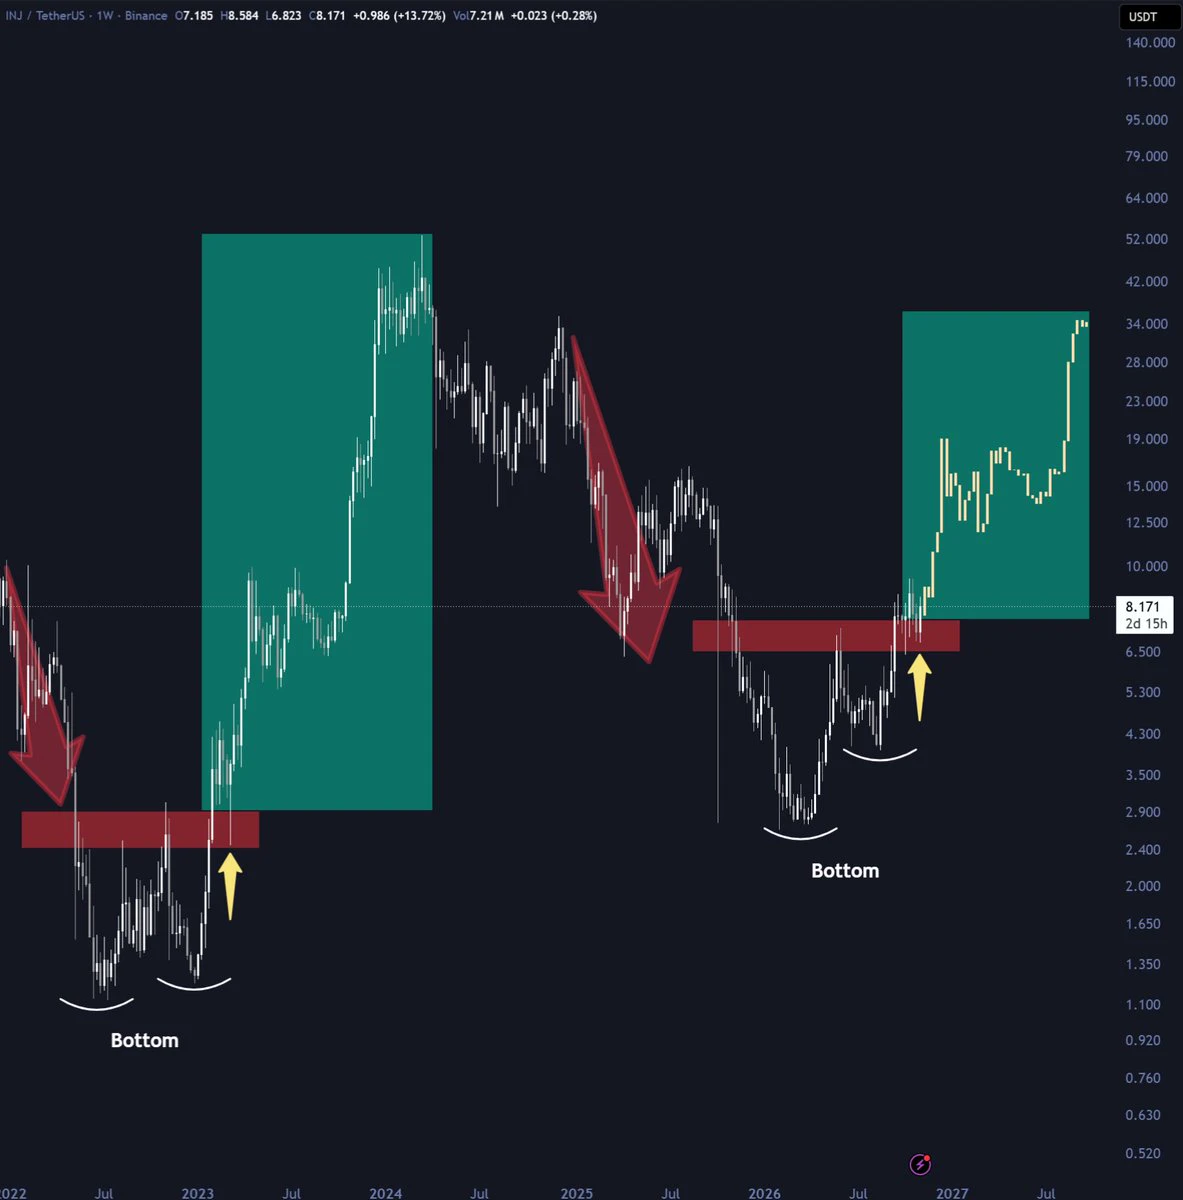
$INJ looks really good here
Holding above $8 despite the broader market correction
Imagine the pump once the markets' bloodbath stops
post-image
INJ-1.67%
What is leveraged trading? Why can leverage improve capital efficiency while also amplifying losses and liquidation risk?
In the cryptocurrency market, leveraged trading allows traders to use a relatively small amount of margin to open larger positions. But leverage is not a free multiplier for capital; it also amplifies the impact of price movements on account equity. Without risk management, even a modest adverse market move can cause serious losses.
First, what is leverage?
Leverage uses margin to establish trading exposure greater than the amount of margin contributed. For example, using 1
post-image
Trenches
BTC
B
bade
b
BTC
C5xp...pump
Market Cap
$.
Change
.
24h Vol
$.
Holders
.
ZIG
Z
bade
b
ZIG
0x8c...1145
Market Cap
$.
Change
.
24h Vol
$.
Holders
.
GM
G
bade
b
GM
0x13...7777
Market Cap
$.
Change
.
24h Vol
$.
Holders
.
STONK
S
bade
b
STONK
6GmA...UNgx
Market Cap
$.
Change
.
24h Vol
$.
Holders
.
Diamond
D
bade
b
Diamond
5VCE...pump
Market Cap
$.
Change
.
24h Vol
$.
Holders
.
Good morning, CT
Blessed Friday 🤍🏖️
post-image
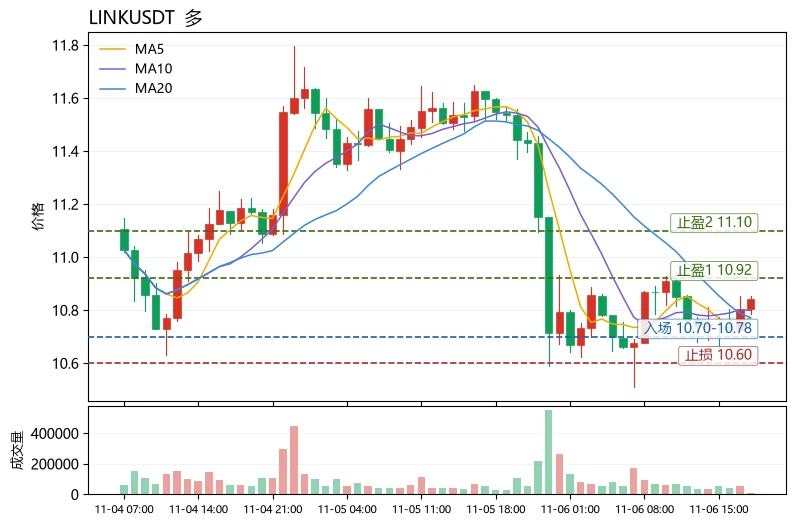
The most unusual detail in today's market action is not the decline, but the structure: $LINK fell 6.01% in 24 hours, yet its price remains near the almost overlapping MA5 (10.7716) and MA20 (10.7722), with just 0.0006 between the two moving averages. Despite the sharp drop, the price has not moved away from the mid-term moving averages, indicating a “price pullback, trend intact” compression rather than a trend breakdown. This pattern is a good way to explain a reusable chart-reading method: use the distance between moving averages to judge whether a trend is healthy. In a healthy pullback,
post-image
LINK-0.18%
UNI+3.05%
Nonfarm payrolls at 9:30 tonight,
U.S. stocks at 10 p.m. Friday,
Time to make a choice again 🫣
post-image
BTC UPDATES
live-cover
LIVE1,896
Yesterday, I warned you that the market might take a big hit… and today, all I’m seeing is green P&L. 😃Yesterday, I told you the market action didn’t look right. My analysis showed that prices might keep falling, so I specifically reminded everyone not to rush into buying the dip. And look… the market plunged, our short trades on $BTC , $SOL , and $ETH performed beautifully, and I successfully closed all three trades, locking in some pretty nice profits. Just three trades earned $12,383! 🤝But honestly, what makes me even happier is opening the comments and seeing your P&L. Some of you made
post-image
SOL-0.77%
If fund security were an exam, would Gate be willing to show its report card?

Crypto platforms are like students, users are like teachers, and proof of fund security is a report card worth paying attention to.
Through its proof-of-fund-security mechanism, Gate lets users review the platform’s reserves and related verification information.
What does this mean?
For example, if a teacher simply says they got a perfect score, people might be skeptical; but providing the test paper and score records makes the claim more credible and useful for reference.
Of course, fund security can’t be judged by
NVDA-9.33%
  • 44
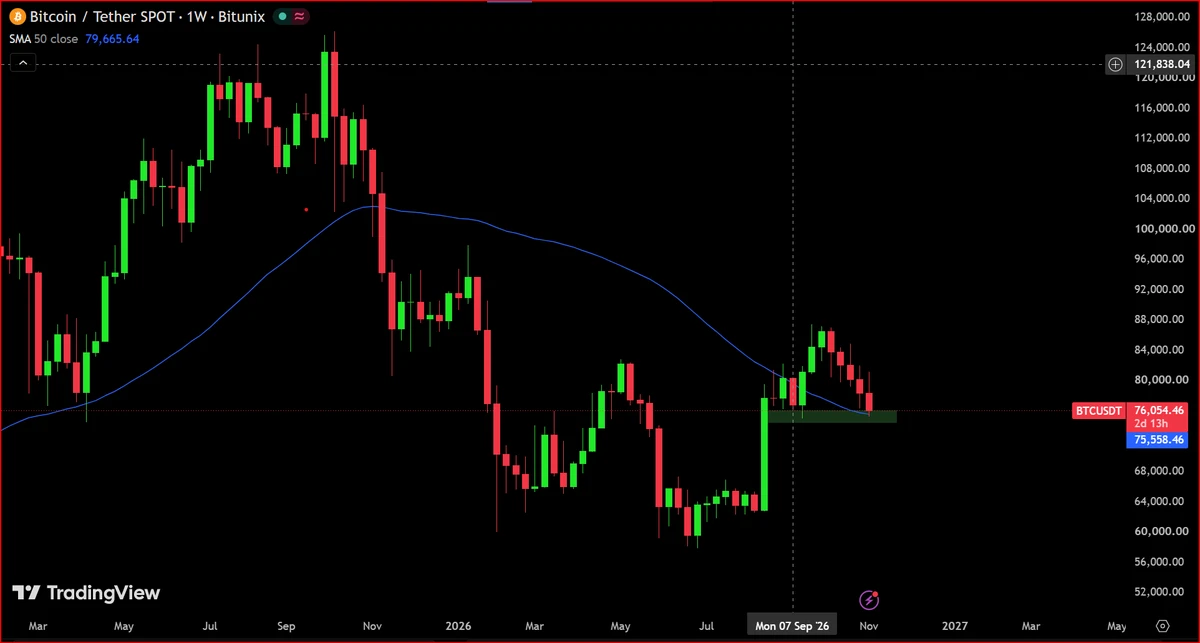
Make or break zone.
If Bitcoin loses this support here, we're genuinely f*cked.
post-image
BTC-0.67%
ALPHA
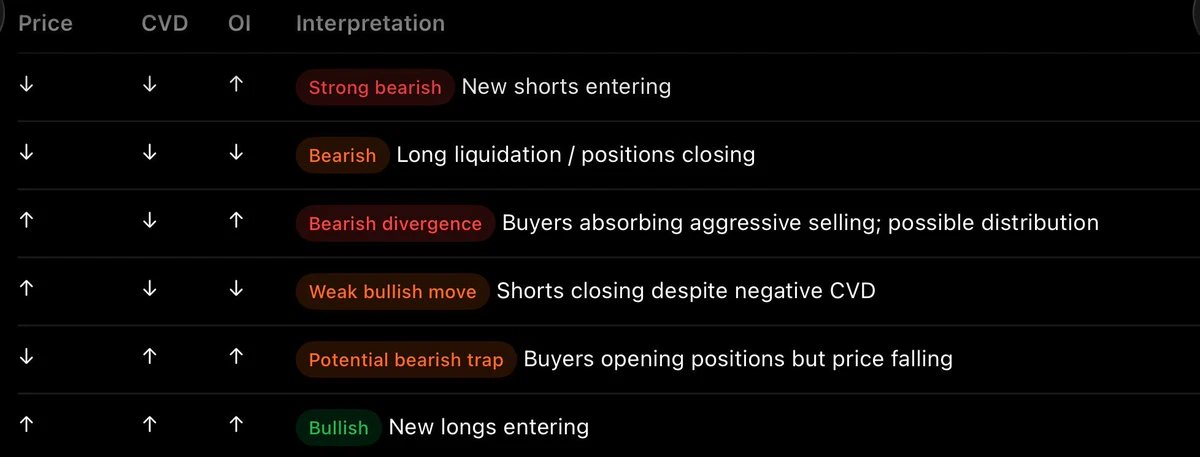
Price + CVD + Open Interest (OI) together can reveal whether a move is driven by aggressive buyers, aggressive sellers, new positions, or position closures.
#bitcoin
Save this
post-image
BTC-0.65%
Where Does a Sense of Security in Crypto Come From? Gate Has Provided an Answer Worth Noting!

Dating requires a sense of security, driving requires a seat belt, and entering crypto requires even more attention to fund safety.
For users of digital asset trading platforms in particular, one of their biggest concerns is whether the platform provides sufficiently transparent asset information.
Gate's proof of reserves gives users a reference for understanding the platform's reserves.
Through the relevant verification mechanisms, users can monitor the asset data published by the platform rather th
NVDA-9.33%
  • 36
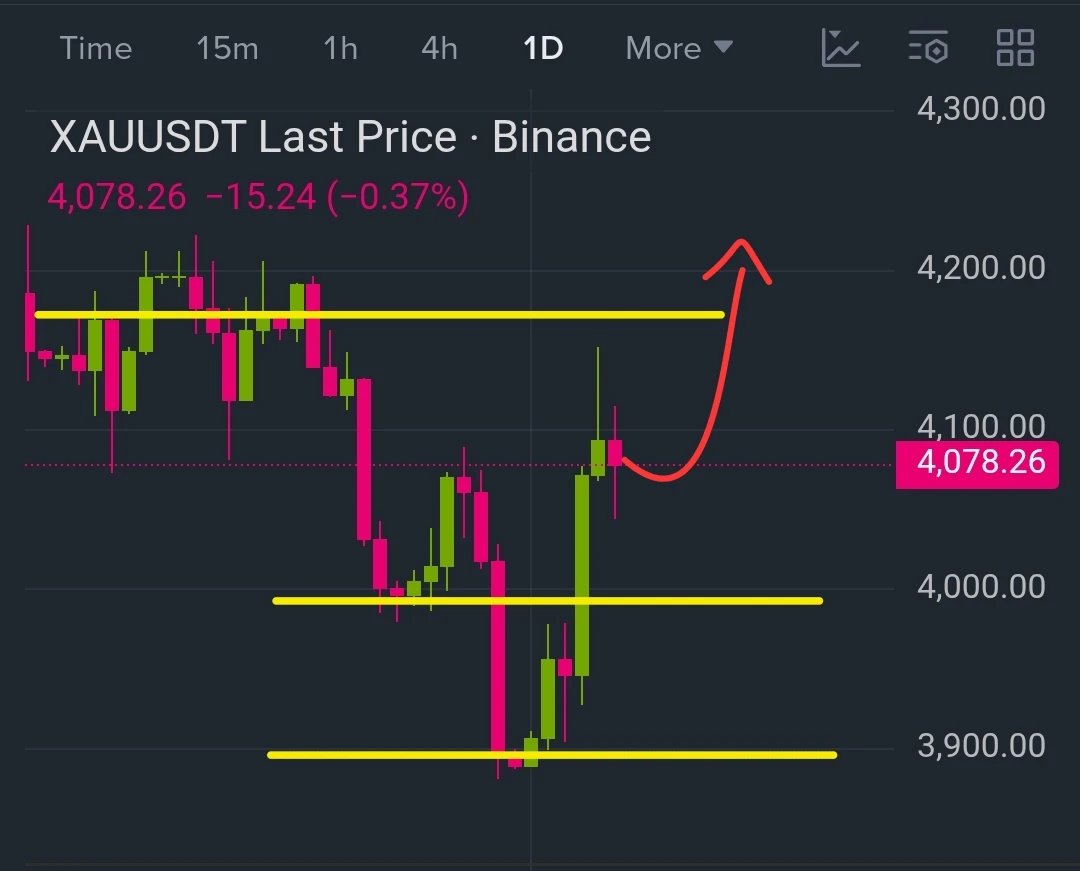
🔥 GOLD IS RECLAIMING $4,000 - $4,200 NEXT?

$XAU LONG ‌

TP1: $4,150 TP2: $4,180 TP3: $4,220

SL: $3,980

Gold swept liquidity near $3,900, reclaimed the major $4,000 support and delivered a strong bullish recovery. Now the key resistance is $4,170. A clean breakout could open the way toward $4,200+. 🚀
post-image
XAU+0.38%
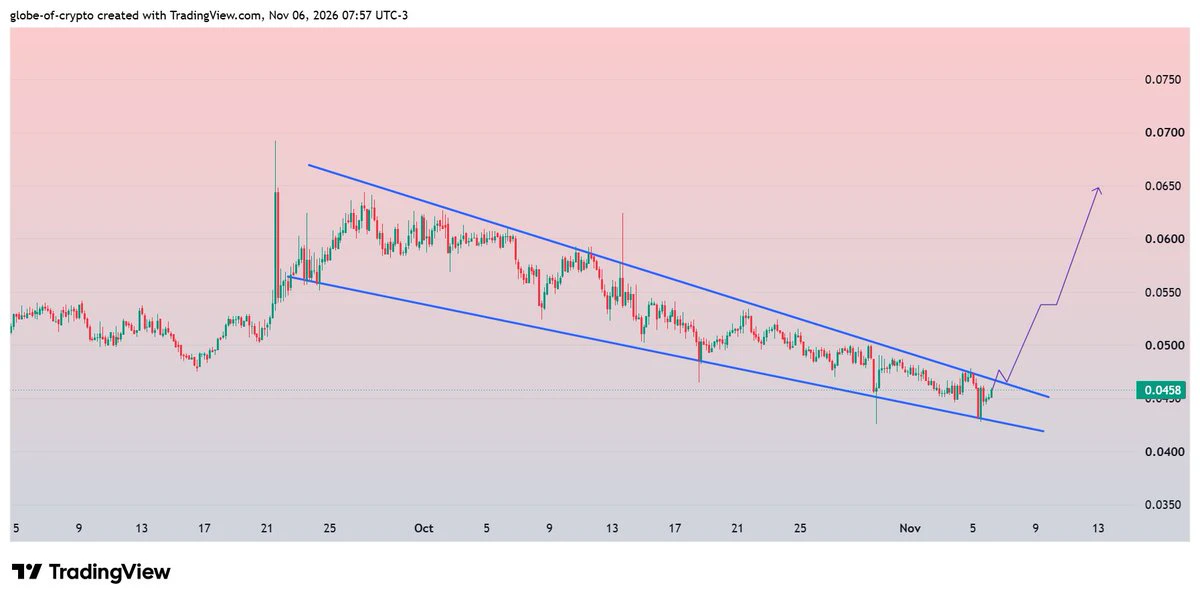
$TKO #TKO
Looking positive for breakout of the Falling Wedge on 4H Chart.
Successful breakout could lead 40-45% rise during coming sessions✍️
post-image
TKO+0.32%
  • 2
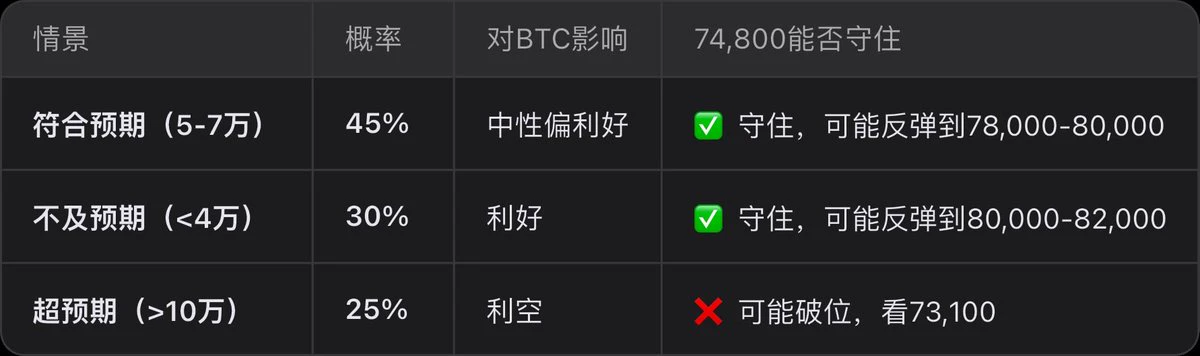
As nonfarm payrolls and CPI approach, how will macro data affect BTC’s direction?
post-image
BTC-0.67%
The guys in the group still have some tricks up their sleeves. Even in this market, he’s managed to make a few grand playing the primary market. I asked him for his wallet address so I can copy his trades.
The secondary market’s been tough lately, so I’ll have to rely on the group for primary-market picks. 😭
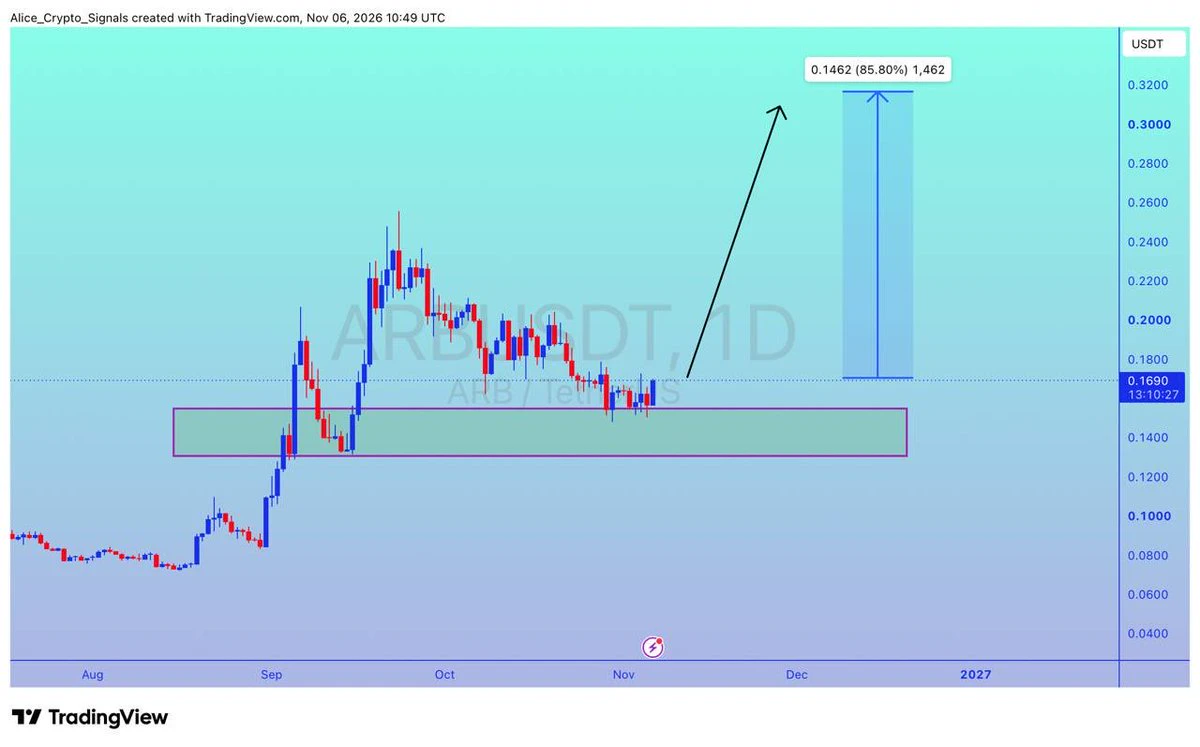
$ARB
UPDATE
#ARB is getting a good bounce here. We can see 80%+ gain here ✍🏻
#ARBUSDT #ARBBTC #Btc #Bitcoin #NFTs
post-image
ARB+1.17%
BTC-0.67%
Tesla fell about 10% on Thursday, with its share price around $346, down 29% from its record high in December 2025. At first glance, that looks like a steep drop, but a look through the income statement reveals an uncomfortable fact: the stock has fallen less than profits.

Operating profit fell from a peak of $13.7 billion in 2022 to $8.9 billion in 2023, $7.1 billion in 2024, and $4.4 billion in 2025. Over the past four quarters, it totaled just about $3.5 billion—roughly a quarter of its 2022 peak. Operating margin contracted from 17% to 4.6% in 2025, then fell further to 2.6% in Q3 this ye
post-image
TSLA-10.84%
  • 3
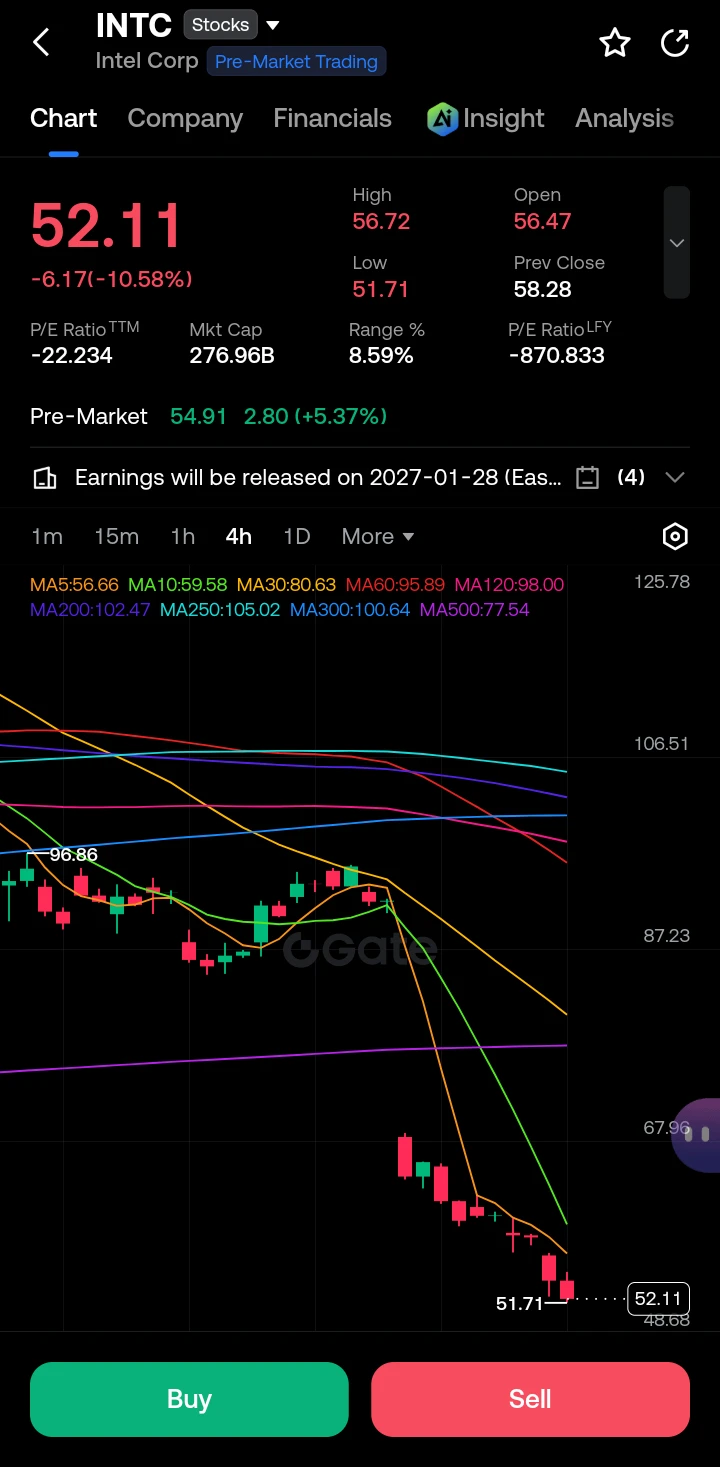
$INTC ‌
INTC is currently trading at 52.11, reflecting a massive -10.58% drop, with an intraday low of 51.71. Despite the severe breakdown, the stock is showing a pre-market bounce to 54.91 (+5.37%), indicating high volatility and aggressive dip-buying after the panic selling.

· Resistance: 55.66 (MA5) and psychological 56.50 (previous open).
· Support: 51.71 (Current swing low) and 48.68 (next structural support).
· Pivot: 52.11 (Current daily close).

The 4-hour chart displays a catastrophic collapse, with price aggressively detaching from all major moving averages (MA10 at 59.58, MA30 at
post-image
INTC-10.58%
  • 8
📡 Signal Card | Synced as soon as it came in
Source: Victorious channel Target: $BTC Long entry: 82477.8 Target: 83099.5 Stop loss: 82062
Speaking of, I just shared a Victorious $BTC trade earlier today, and here comes another one. That's a pretty high attendance rate 👀
Same old disclaimer: I just repost the original; I don't guarantee anything. Whether to follow and how much to allocate is up to you. Keep an eye on your stop loss, and don't let your plan wander off.
Personal record shared for informational purposes only; not investment advice. #Must-read for beginners: everything you need
BTC-0.65%
Load More

Join 40 M users in our growing community

⚡️ Join 40 M users in the crypto craze discussion

💬 Engage with your favorite top creators

👍 See what interests you

Trending Topics

USStocksFaceHistoricSelloff

6.57k Views3.71k Discussing

U.S. stocks suffered a sharp selloff on Thursday, with the Nasdaq closing down more than 5% and the Philadelphia Semiconductor Index falling over 12%. AI and chip stocks including $NVDA and $AMD were hit especially hard. Markets are reassessing AI valuations, data-center spending and future returns. Is this just short-term deleveraging, or the start of a deeper correction in the AI trade? Which sectors are you watching next?

GateLaunchesPoSECProofOfSecurity

16.18k Views607 Discussing

USNonfarmPayrolls

14.21k Views4.09k Discussing
View More