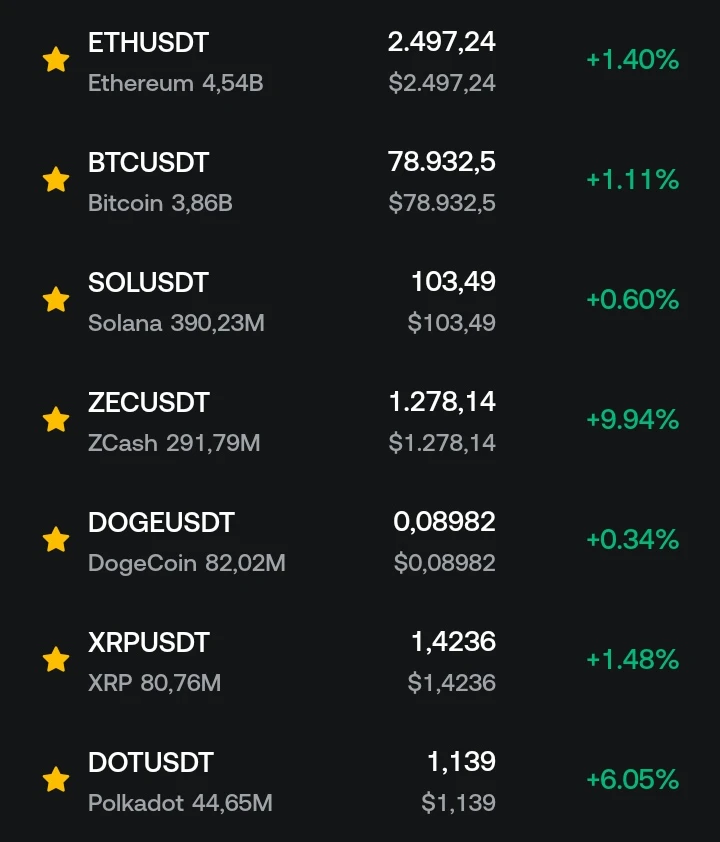
Recovering from a trading downturn requires the courage to pause and reorganize your strategy and mindset. Stop Trading Temporarily: Immediately step away from the screen (charts). Taking a break is crucial to let your emotions settle and prevent revenge trading from further depleting your remaining capital. Review Your Trading Journal: Honestly recheck your transaction records. Identify the main cause of the losses, whether it was violating risk management rules, overtrading, not using a stop loss, or being driven by emotions (FOMO). Improve Risk Management: Never risk capital you cannot a
Can Trading Make Money? Yes, trading can make money, but it is not a shortcut to getting rich.
Trading is the buying and selling of financial assets—such as stocks, forex, or crypto—with the aim of profiting from market price differences. Success in trading depends heavily on technical analysis, strict risk management, and emotional control. However, this high profit potential is directly proportional to the risk. Extremely rapid price fluctuations can trigger major losses in a short time without a well-developed strategy. In short, trading has indeed been proven to make money for discipli
do you know what causes your finances to fall apart?. one of them is opening positions carelessly. and when you think trading makes money very easily, that is the beginning of your downfall. remember, don't be greedy, and if you make a profit, withdraw it immediately if possible for your needs; sharing also makes the path to success easier 🤗🤗 $BTC $GT $ETH $SOL $XRP
If you ask, *how can I always make a profit and never incur losses?* I cannot answer either, because Crypto trading is about hurting one another. When you are asleep and have an open position, your position can be liquidated by someone who is always staring at the chart. 😂 $BTC $ETH $GT $SOL $XRP
Why does my phone screen go completely black and the app stop every time I open Gate? 😴 Gate seems heavier than all the apps on my phone. 😢 $BTC $GT $ETH
Long Term doesn't care whether the price will go up or down today; Futures traders are even crazier, as there is always an opportunity when the Price rises/falls 😂😂. Futures traders are crazy people 😂😂 $BTC $GT $ETH $SOL
Do you know what makes you hurt so much? That's right. When you're in profit, you think the price will keep making you money, so you don't close part or all of your position. When the price falls and you start losing money, you will definitely think, •I should have closed my position, I shouldn't have been greedy•. And you keep holding your position until all your assets are gone. Accepting defeat and exercising self-control are very important ✔️ $BTC $ETH $GT
After coming home from work after a rather exhausting day, I opened my phone screen. The entire market was green, but my assets had not increased and instead remained stagnant. When I checked, it turned out I had bought the wrong coin. Ugh, this made my mind even more confused 😖. It seems I should not FOMO into coins that are currently hyped/FOMOed, as some rise by up to 100% in a day while others drop by up to -99%; some also have no movement in a day. It would be better to look for coins with large trading volumes, as their liquidity is more assured 🥳 $BTC $ETH $SOL
Losing money or experiencing a major financial loss can indeed feel extremely heavy and frightening. Anxiety, regret, and mental pressure often come all at once. However, it is important to remember that no matter how large the loss, it is not the end of everything. Money Is a Tool, Not Your Worth Financial loss is merely a decrease in the numbers in your account or assets, not a decrease in your worth as a person. Your experience, skills, character, and resilience have not disappeared along with that money. They are all still within you and can be used again to rebuild what once collapsed.
MARKET ANALYSIS - ADA Timeframe 15 Minutes (TF15m) Market Condition: Experiencing a decline (short-term downtrend) after a sharp surge to a peak of 0.2319. Indicator Position: The price is around 0.2193. The EMA 20 (0.2192), EMA 50 (0.2196), and EMA 200 (0.2197) lines are close together and slightly above/parallel to the price. This indicates a narrow consolidation or sideways phase after selling pressure. Support & Resistance: The nearest support is in the 0.2172–0.2147 area, while the nearest resistance is at 0.2226–0.2280. Timeframe 1 Hour (TF1h) Market Condition: The medium-term trend rema
MARKET ANALYSIS - SOL TimeFrame 15 minutes (Short Term) Condition: The trend is attempting to rebound after touching a low of 101.64. EMA Indicator: The current price (104.22) has successfully broken above EMA20 (103.67), EMA50 (103.52), and EMA200 (103.74). This indicates short-term bullish momentum. Key Levels: The nearest resistance is at the previous high of 104.79, while the nearest support is in the 103.50–103.70 range (EMA clustering area). 4-Hour Timeframe (Medium Term) Condition: The main trend is still tending toward consolidation/sideways movement above a strong bullish structu
MARKET ANALYSIS - SOPH Trend & Indicator Analysis 5-Minute Timeframe: A sharp decline (dump) is visible from the peak at 0.012449, breaking below the EMA 20 (green) and EMA 50 (blue) lines. The price is currently around 0.009142 and approaching the EMA 200 (red/purple) line at 0.008602, which serves as strong short-term support. 15-Minute Timeframe: The previous main trend was very bullish (rising sharply from the 0.005671 area), but it is currently undergoing a deep correction. The price has just broken below the EMA 50 line (0.009127). The candle structure indicates fairly strong selling
MARKET ANALYSIS - UNI Timeframe 1 Hour (1H) Technically, the movement is in a consolidation or healthy correction phase after touching a peak of 7,483. The current price (6,999) is slightly below the EMA 20 (7,052), but remains firmly above the EMA 50 (6,942) and well above the EMA 200 (6,164). Nearest support: 6,942 (EMA 50) and 6,295. Nearest resistance: 7,052 (EMA 20) and 7,483. Condition: The short-term trend tends to move sideways, with buying pressure easing slightly. Timeframe 1 Day (1H / Daily) The main trend shows a very strong bullish structure. The price successfully broke out o
MARKET ALERT - ETH 5-minute and 15-minute timeframe analysis. (7 September 2026) 5-Minute Timeframe (TF 5m) Trend: Very strong Bearish Reversal following a fakeout/pump. Price Action: The price briefly surged sharply (pump), reaching a peak at 2,510.99, but was immediately rejected and experienced a drastic dump with a very large red candle (long bearish candle). EMA Indicator: The price has broken below all EMA lines (EMA 20, 50, and 200), which are clustered around 2,495 - 2,496. This signals sudden selling pressure that has invalidated the short-term uptrend. 15-Minute Timeframe (TF 1
MARKET ALERT - BTC 5-Minute Timeframe Analysis (5m) Trend: A short-term recovery (rebound) occurred after touching a low of 78,947.3. EMA: The price is above EMA 20 (79,410.3) and EMA 50 (79,418.2), which have crossed upward, signaling a local bullish crossover. However, EMA 200 (79,613.2) is still sloping downward well above the price, acting as strong resistance. Potential Move: The price may consolidate upward to test the EMA 200 resistance area around 79,600–79,650. 15-Minute Timeframe Analysis (15m) Trend: The main trend remains predominantly bearish (a downtrend pattern and lower lows fr
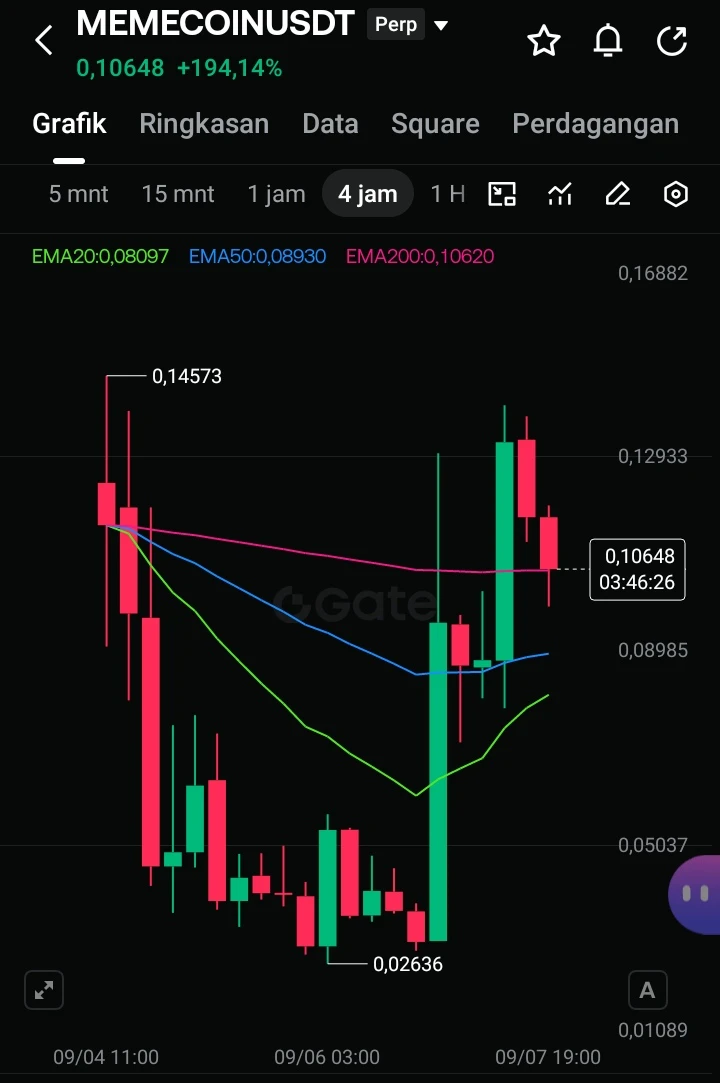
MARKET TALK - MEMECOIN Relies on sudden hype, social media sentiment, and sensitive indicators such as RSI and VWAP. Price movements are highly aggressive with high volatility. Opportunities: Highly suitable for scalping. Takes advantage of volume spikes when breaking out of brief consolidation patterns. Risks: Vulnerable to fakeouts (false signals), sudden reversals (brief rug pulls), and high slippage. 4-Hour Timeframe (4H): Swing Trading & Main Trend Analysis: Reads a more stable trend structure using Moving Averages (MA 20/50) and Support/Demand areas. Filters out noise or random