



Share your thoughts
placeholder
Article
$CELR Signal】Long + negative funding rate short squeeze pullback
$CELR 1H wick to 0.003704 quickly recovered, with the current price at 0.003868 near the upper boundary of the entry range.
🎯Direction: Long
⚡Entry/Limit order: 0.00385640 - 0.00386800
🛑Stop-loss: 0.00382932
🚀Target 1: 0.00392602
🚀Target 2: 0.00395503
🛡️Trade management:
- Execution strategy: Reduce the position by 50% after reaching Target 1, and move the stop-loss up to the breakeven level. If the price falls back to the entry level, exit automatically to protect the principal.
4H RSI 79.95 is high, while the MACD red bar
post-image
CELR+52.73%
BTC-0.42%
ETH-0.92%
SOL-1.73%
BTC Update
live-cover
LIVE1,752
$PIPPIN When prices are low, build a position in batches to reduce investment risk. The AI futures grid bot strategy splits funds into multiple portions and buys and sells in layers at different price levels. Compared with investing all at once, it can effectively diversify risk and is especially suitable for volatile cryptocurrencies and other emerging assets. Friendly reminder: Adjust the margin appropriately.#MSTR领涨纳指100 #BTC重回80K .
PIPPIN-1.99%
At the End of DOGE’s Sideways Trading, I’m Watching the Funding Rate
DOGE has been grinding between $0.08 and $0.09 for a long time. On the daily chart, the 7-day, 25-day, and 50-day moving averages have all converged into a single horizontal line. This compression will not last too long.
I don’t look at DOGE’s candlesticks; I look at two data points: the funding rate and open interest.
The funding rate is currently only +0.0100%, which is very low. This shows that leveraged longs are not overly aggressive, and no one is willing to pay a high premium to go long. The Fear and Greed Index is at
DOGE-3.71%
Japanese stocks are attracting fresh attention as several key sectors show stronger momentum, with real estate, power and semiconductor-related names becoming important areas to watch.
The latest market activity shows that sector rotation remains a major theme in Japanese equities. Semiconductor and AI-related stocks have been particularly active, while power and other infrastructure-linked companies are also attracting market interest. Recent trading in Japan saw the Nikkei 225 rise 1.38% on September 18, with major semiconductor and AI-linked companies helping drive the move.
The semiconduct
JPN2250.00%
$BTW Catch this demon coin! Go long! Look at the data: BTW whales’ long positions have already made over $50 million. If they really wanted to dump the market, it would have plunged straight down already. With such a huge long position, the market makers can’t fully exit, so they can only repeatedly lure in shorts and liquidate them. Don’t get tricked into shorting—go long with the trend. Remember to take profit after an upward spike and wick; shorts can easily get buried.⬇️⬇️⬇️
post-image
BTW+25.51%
Guys, go long immediately! $SAGA , use 10x leverage for a straddle in the futures wallet…🚀🔥
Entry zone: $0.0312–$0.0324 Take-profit 1: $0.0340 Take-profit 2: $0.0365 Take-profit 3: $0.0395 Take-profit 4: $0.0440 Take-profit 5: $0.0500 Stop-loss: $0.02420 Click below to place the trade immediately…👇Trading logic: $0.0312–$0.0324 is the key entry zone set for this long position. As long as the price stays above $0.0312, the bullish structure remains valid. If a clean breakout occurs above $0.0340, it may open the way toward $0.0365 and $0.0395. If momentum is strong above $0.0395, the move ma
post-image
SAGA+47.71%
The 10-year U.S. Treasury yield has risen to a high of 5.01%, continuing to weigh on risk asset valuations, while the crypto market remains under overall pressure; the SEC’s innovative exemption for tokenized stocks has sparked divisions, bearish for BTC, while ETH lacks independent positive catalysts; whale-related data shows no clear buying support. Technically, short-term rebound potential is limited, and the risk of chasing higher prices is relatively high. A rebound into the 2610~2660 range is suitable for shorting; monitor changes in Treasury yields and regulatory news. For market analys
post-image
BTC-0.42%
ETH-0.92%
#StandardCharteredSeesARBAt10By2030
Standard Chartered has put Arbitrum’s $ARB back in the spotlight with a highly ambitious long-term outlook, initiating coverage with an end-2030 price target of $10.
The bank’s published path is $0.50 by the end of 2026, $1.50 in 2027, $3.50 in 2028, $6.50 in 2029 and $10 by the end of 2030. The report was based on ARB trading around $0.13–$0.14 at the time, meaning the 2030 target represented roughly a 70-fold increase from that reference level. These are Standard Chartered’s projections, not guaranteed outcomes.
What makes the report particularly interest
$CELR Signal】Long + negative funding rate support, snipe the 1H pullback
$CELR 4H RSI 79.95, 1H RSI 52.41, price pulls back to 0.00385640-0.00386800.
Funding Rate -1.1435%, short position costs continue to accumulate; order book Bid/Ask 1.48, with active bids below.
4H MACD bullish histogram is contracting, while the 1H MACD bearish histogram is expanding, cooling short-term upward momentum. The 1H Bollinger middle band is 0.0041 and the lower band is 0.0031; the current price is near the rebound zone.
OI Stable, with negative funding and bids absorbing supply, so short-squeeze conditions rem
post-image
CELR+52.73%
BTC-0.42%
ETH-0.92%
SOL-1.73%
I had already finished complaining to my friends about this week's market, but now I have to take it back—kind of awkward. A few days ago in the afternoon, $FOLKS retested and held, buying strengthened, and I said not to rush into long positions: as long as it kept forming a bottom without breaking down, continue holding.

First, let's look at the results: entered at 1.975, reached 1.998, return +61%. It really dragged at first, but once it finally moved, it was truly rewarding.

Panic comes from having no plan; losses come from overthinking.

Hold as long as the trend remains intact; get
post-image
FOLKS-3.33%
DOGE-3.71%
BNB-0.38%
$LAPTOP ended up in the trash heap again.
post-image
LAPTOP-9.60%
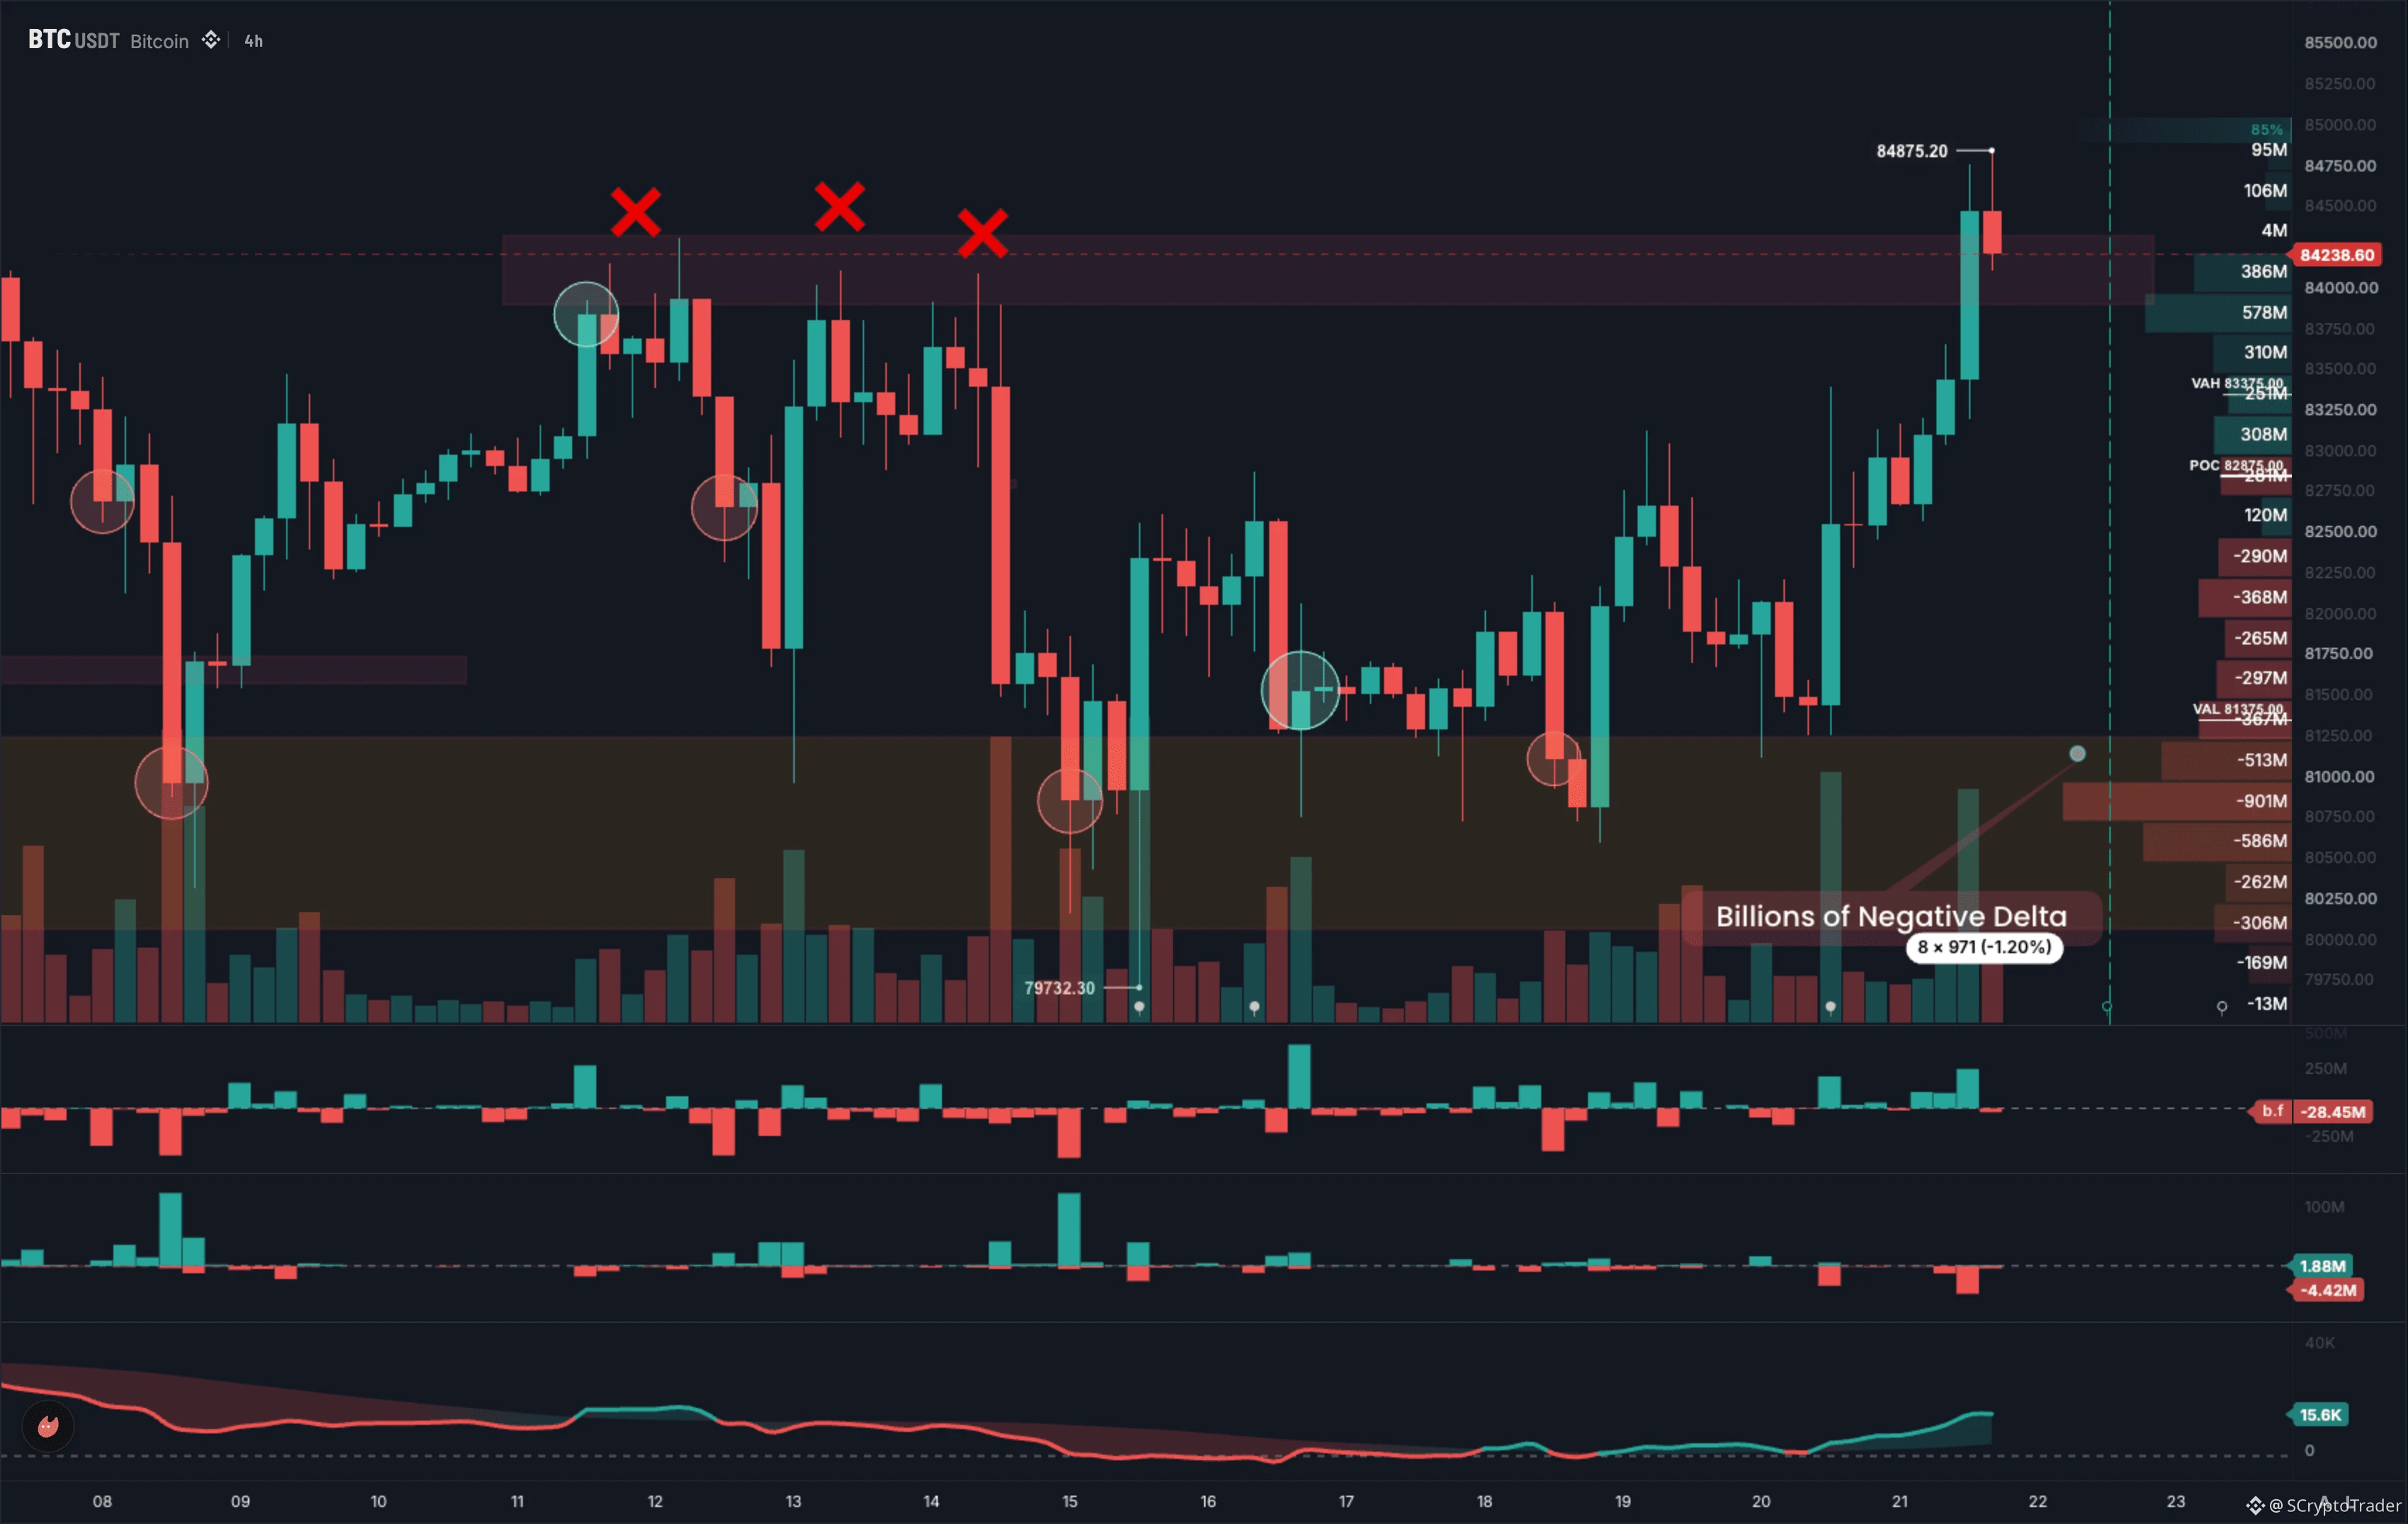
Will MM grab 75,000 first or will Bitcoin break the 82,000 resistance?
post-image
BTC-0.42%
If you longed hyperliquid:native and shorted aster-2:native a year ago you would be up >500% while paying $0 in funding.
Only thing that beats that is buying something like $100 strike HYPE call options a year ago.
Don't sleep on pear trading - ngl also talking to myself here.
post-image
HYPE+0.17%
ASTER-4.02%
48 coins are still falling, and HBAR has taken one spot in CoinGecko's trending searches
Well, 48 coins are still falling, and $HBAR has taken one spot in the trending searches: current price 0.08573, 24h +5.722%, volume ratio 2.864. I’m bullish, but not chasing—I’ll buy the dip directly at the support zone.
Current status: After surging to 0.08999 intraday, it pulled back. 24h trading volume was 27.65 million USDT, and the trending search ranking was driven by volume.
Bullish rationale: First, the daily MACD has formed a golden cross above the zero line, with expanding red bars, while RSI at
post-image
HBAR+4.81%
Analysis in the early hours of September 21$BTC
MACD indicator: DIF remains above DEA, with only a slight contraction in the red bars. This is a brief consolidation during the upward movement, not a bearish crossover or reversal. Bullish momentum has only temporarily slowed, rather than indicating a trend reversal.
Open interest: Open interest stabilized during the pullback, with no sustained large-scale reduction, indicating that major players have not exited on a large scale and that short-term bearish pressure remains limited.
Net capital inflow fell slightly, which is normal profit-taking
post-image
BTC-0.42%
$BONK LONG TRADE
ENTRY: 0.003015
TARGET: 0.00333
STOPLOSS: 0.002935
BONK-2.71%
【$ONE Signal】1H pullback + negative funding rate short squeeze, buy the dip
$ONE 1H pulled back to 0.003634, funding rate -0.3503%, order book bid/ask depth ratio 1.81, depth imbalance 28.82%.
4H RSI 67.71, 1H RSI 49.94 neutral, 4H MACD bullish histogram contracting, 1H bearish histogram expanding, indicators in conflict.
1H Bollinger middle band at 0.0040 acting as resistance, lower band at 0.0034 providing support, 4H EMA20 at 0.0027 far below, open interest stable.
There are bids above the intraday low of 0.003541, shorts continue to pay funding, and the price remains resilient.
🎯Direction
post-image
$FOGO Short 10x | Supply holding strategy, execution only.
FOGO has reached my expected reaction zone, paving the way for a downside short. The risk of my position is clearly defined, avoiding noise caused by emotions. Trading plan: - Entry: 0.00641 – 0.00643- TP1: 0.00635 (R:R 1:0.8)- TP2: 0.00630 (R:R 1:1.3)- TP3: 0.00623 (R:R 1:2.0)- SL: 0.00651Why this setup?- The 4-hour chart still supports a valid short setup: a bearish 1D background, with price reacting at 0.00642 around 0.00641–0.00643.- The 15-minute RSI is 43, indicating neutral momentum; downside continuation may still occur if sel
post-image
FOGO-1.80%
Load More

Join 40 M users in our growing community

⚡️ Join 40 M users in the crypto craze discussion

💬 Engage with your favorite top creators

👍 See what interests you

Trending Topics

MSTRTopsNasdaq100

74.18k Views3.01k Discussing

Strategy (MSTR) has gained about 48% over the past month, making it the best-performing stock in the Nasdaq 100, while Bitcoin rose roughly 12% over the same period. The company holds 845,050 BTC with a cumulative cost basis of about $63.73B. MSTR is not a pure Bitcoin proxy — its price swings can be more extreme. Can this rally last?

Gate Tops 24H Net Inflows Among Exchanges

26.48k Views3.69k Discussing

BTCRetakes80K

57.29k Views60.64k Discussing

View More