
Share your thoughts
placeholder
Article
#ZECPlungesOver13%
Zcash has come under heavy selling pressure, with ZEC plunging more than 13% in a sharp move that has quickly changed the short-term market picture.
A move of this size is significant because ZEC had recently attracted strong attention from traders following its earlier price momentum. When an asset rises rapidly and then experiences a double-digit decline, the market naturally begins questioning whether the previous rally was overheated or whether this is simply a temporary correction.
The first thing to watch now is support.
After a sharp breakdown, traders usually look f
post-image
  • 1
$ZEC It was simply thrown off by the broader market trend, and it will punish every one of you shorting. There has been no withdrawal of funds, the long-short ratio is also normal, and the fundamentals have not run into any problems.
As long as the broader market pulls back, there will be another rebound to 1200. #GateMeme
ZEC-1.66%
Can you bring yourself to chase CL at $96?
Look at the surface first: geopolitics sent prices soaring, CPI is at the ceiling, and crypto knelt first.
Over the past week, CL violently surged from just above 90 to 106, then retreated to around 96.
At the same time, BTC plunged from 82,000 to around 77,000, posting consecutive weekly declines, while ETFs saw nearly $450 million in net outflows over three days.
You think crypto is falling on its own? Wrong. Oil prices were the real invisible market maker this week.
First: oil prices are the true macro amplifier.
A flare-up in the Middle East sends
post-image
BTC+1.00%
CL-1.90%
BZ-1.85%
We absolutely nailed the little CPI!
The afternoon European session did not continue the bullish trend from the morning session; instead, gold prices came under pressure and pulled back to $4,360. However, as the European session has continued, the pullback in gold prices has not been particularly strong. At this point, tonight’s market direction is basically clear: provided the European session does not break today’s low, tonight’s US session will follow the Asian session’s trend and lean bullish.
The CPI data due tonight will also be an important factor in determining whether the Federal Reserve raises interest rates. However,
post-image
XAUUSD+1.55%
CPI didn’t surprise the market. But it changed the Fed debate.
August CPI came in at 0.4% MoM and 3.4% YoY, broadly matching expectations.
At first glance, that sounds neutral.
But the more interesting number was core CPI: 0.3% MoM, slightly above the 0.2% economists had expected. Core inflation is now running at 2.4% YoY.
That matters because the Fed isn’t only looking at whether inflation is falling.
It needs confidence that inflation is moving sustainably toward 2%.
And right now, that confidence looks fragile.
Markets have consequently increased the probability of a September rate hike, wh
BTC+1.00%
ETH+3.43%
  • 4
  • 2
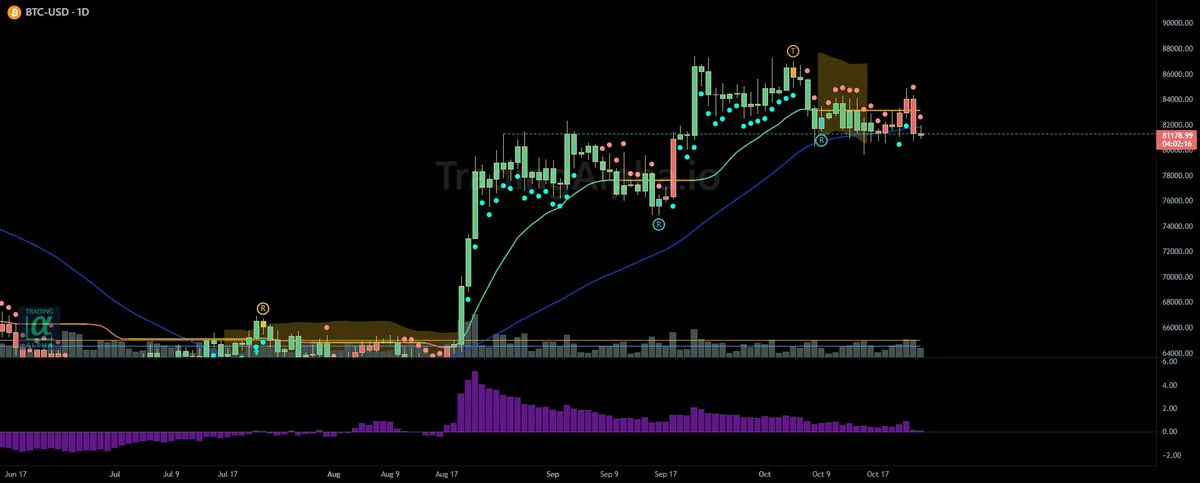
$BTC is starting to look very similar to the previous cycle bottom.
September brought the weakness first. price pushed lower before the real bottom formed, then Q4 became the turning point and the bigger rally followed.
we’re seeing a similar setup again.
This September weakness could be the final shakeout before the Q4 reversal.
and if the same cycle structure plays out, $150K–$170K by 2029 starts looking very interesting.
post-image
BTC+1.00%
  • 1
The CPI data will be released at 8:30!
If this round of data comes in higher than expected, it will indicate that inflation remains sticky, cooling rate-cut expectations, strengthening the U.S. dollar and Treasury yields, while putting downward pressure on gold!
If the data comes in lower than expected, it will mean inflation is continuing to ease, boosting rate-cut expectations, benefiting gold, and potentially driving a short-term rise in gold prices! Both scenarios are possible.
Of course, also watch out for “buy the expectation, sell the fact.” Lao Dong predicts that yesterday’s initial jo
post-image
XAUUSD+1.55%
BTC+1.03%
CPI data came in as expected, the bearish news has been priced in, and large amounts of capital have entered to drive prices higher 🔥
Actually, this rally has a logical basis. First, yesterday’s PPI data warmed up the market and allowed it to digest part of the expectations
If it comes in below expectations, that would be a major positive; if it meets expectations, the bearish news has been priced in; if it exceeds expectations, the market has already digested it in advance, so any decline will be limited. So this rally was actually worth betting on.
U.S. stocks haven’t opened yet, so the maj
post-image
BTC+1.00%
SNDK+0.55%
Everyone is missing the real move in SYMBOL right now.

$BTC /USDT - LONG

Trade Plan:
Entry: 77635 – 77887
SL: 76555
TP1: 78666
TP2: 79269
TP3: 80173

Why this setup?
Why now? The daily trend is bullish and the 4h structure is armed, so momentum is aligning for a push. The 1h ATR of 502.587605 shows enough volatility to fuel a leg up without whipsawing. The 15m RSI at 71.57 confirms strength but not yet exhaustion, meaning room remains for buyers. Entry sits at 77761 with a zone between 77635 and 77887, giving a precise spot to initiate. Targets are 78666 for TP1 and 79269 for TP2, while t
BTC+1.03%
$XAUT CPI direction ⬇️
The reason is simple: gold is facing three headwinds at once—surging oil prices are driving up inflation expectations, U.S. Treasury yields are rising sharply, and the dollar is strengthening in tandem.
post-image
XAUT+0.82%
Drilling your motherlode so hard and deep right now
Let's get some more $drill
$UNI Signal】1H momentum narrowing + lower-band support, long-entry snipe
$UNI 1H MACD histogram 0.0047, RSI 41.09, price closely hugging the lower Bollinger Band at 5.9139. Order book depth imbalance -6.29%, Bid/Ask 0.88, with bid-side depth weaker than ask-side depth. Funding rate 0.0087%, OI stable, short-squeeze conditions have not formed. EMA20 1H 6.0487, EMA50 1H 6.1946, with price running along the floor. This long has a 1.5 risk/reward ratio, with less than 1% stop-loss room; I am watching whether 5.91327 can hold.
🎯Direction: Long
⚡Entry/limit order: 5.96404 - 5.97300
🛑Stop-loss: 5.
post-image
UNI+4.76%
This CPI seems to have echoed what the cited article said: headline CPI is bleeding into core CPI, and it was all propped up by the energy component.
As for risk assets, they spiked and rebounded upon the data release, then returned to the range—this is getting really interesting.
Is this the legendary “bad news is good news once it hits the market”?😆#cpi
post-image
XiuHu_charts
It’s Friday—time to welcome a wonderful weekend!
Bessent set a $6 billion cap for this long-term debt buyback, but it seems the full amount wasn’t purchased. The Treasury actually accepted about $5.19 billion in face value.
The market feels the stance was not decisive enough; operationally, it looks more like some bids were not suitable enough, so the full amount was not accepted. U.S. Treasury yields are still holding at elevated levels.
This operation targeted maturities of 10–20 years, with more operations to come. As for whether the cap will be raised and how much will actually be repurchased, we’ll have to wait for the announcement, because this is not fixed.
CPI will be released tonight, and the market is eagerly awaiting it. It is also the final data release of the week.
Many people are curious: Why does core CPI exclude energy, while the market keeps saying energy is pushing inflation higher? Headline CPI includes energy; the media generally means headline CPI when it says this.
Crude oil is not directly included in core CPI, but it can be transmitted indirectly through costs and push prices higher.
Core CPI excludes crude oil simply to filter out short-term volatility; this does not mean we can ignore the fact that it remains a basic energy cost for society.
So it is fine to focus mainly on core CPI, but we also need to see whether headline CPI is feeding into core CPI.
If I had to assess tonight’s data, I think the odds favor a somewhat bearish outcome.
After all, yesterday’s PPI was relatively high. Although it was not explosive, oil prices breaking above $100 is also right there and cannot be ignored.
Looking more closely:
A core month-on-month reading of 0.3% would be genuinely hawkish,
core at 0.2% with headline CPI pushed higher by energy would be neutral, though sentiment could still remain tense,
and core at 0.1% would provide relatively more room to breathe.
Therefore, even if the released figures are not particularly bearish, the market will most likely still worry for a while—that is a matter of sentiment.
What is more worth watching now is not just the data itself, but how relevant officials respond to reassure the market if CPI really comes in above expectations.
Because Bessent has recently said that oil prices will fall significantly after the Iran-Israel war ends, and even mentioned $40–50!
The fact is that prices first broke through the $100 threshold.
They are verbally trying to suppress oil prices, but prices moved in the opposite direction first. The market will not pretend not to notice this contrast.
To sum up my view: After yesterday’s PPI release, the market raised expectations for a September rate hike. The current situation is that oil prices have broken above $100 and U.S. Treasury yields remain elevated. If core CPI comes in above expectations tonight, September rate-hike expectations will be raised another notch.#8月CPI今晚公布
repost-content-media
  • 1
How long do you have to work to buy an iPhone Duo? 😳
post-image
🚨 FFUSDT SHORT SETUP
📍 Entry: 0.162 – 0.168
🛑 Stop Loss: 0.1746
⚠️ Risk: 1%
🎯 Take Profit Targets:
• TP1: +50%
• TP2: +100%
• TP3: +150%
• TP4: +200%
• TP5: +300%
Manage your risk properly and don't over-leverage. 📊
#FFUSDT #CryptoTrading #gateweekly #TradingSetup #CryptoSignals
post-image
  • 1
$APT Signal】1H/4H Double Bollinger Breakdown, Bearish Momentum Continues
$APT 1H RSI 30.58, 4H 37.15, and the current price of 0.5965 has directly broken below the 1H/4H lower Bollinger Bands. EMA20 and EMA50 are entangled and suppressing price around 0.63, with price completely below the moving average cluster.
Depth imbalance -16.71%, buy/sell ratio 0.71, with sellers continuously placing overhead pressure. The 1H and 4H MACD histograms are both negative and expanding, with downward momentum advancing.
Funding rate 0.01%, OI stable, and no signs of longs reversing have appeared yet.
🎯Direc
post-image
APT-0.64%
BTC+1.00%
ETH+3.43%
SOL+2.04%
$UNI Signal】1H near lower band + funding rate stable, dip-buying opportunity
$UNI 1H near the Bollinger lower band, price 5.973, RSI 41.09. MACD histogram at 0.0047, with bullish momentum contracting. Order book depth -6.29%, Bid/Ask 0.88, with selling pressure still dominant. EMA20/50 are weighing at 6.0487/6.1946, so the rebound will first face the dense moving-average zone. Funding rate 0.0087%, OI stable, leverage not overheated. Enter here, with the stop loss approximately 1% from the current price and a risk/reward ratio of 1.50. Keep wick-catching position size under control; rebound
post-image
UNI+4.76%
BTC+1.00%
ETH+3.43%
SOL+2.04%
Load More

Join 40 M users in our growing community

⚡️ Join 40 M users in the crypto craze discussion

💬 Engage with your favorite top creators

👍 See what interests you

View More