Square
Following
Hot
News
Profile

CryptoGladiator

vip
Active for: 0.3y
Peak Tier 0
No content yet
10
Following
1k
Followers
1.3k
Liked
Market update BTC
live-cover
LIVE66
Market update BTC
live-replay-cover
112 views09-25 04:13
00:21:56
Market update BTC
live-replay-cover
224 views09-25 03:00
00:33:04
Market update BTC and Other Coin
live-replay-cover
282 views09-25 02:08
00:40:44
#CryptoStocksSlipBMNRDownOver4%
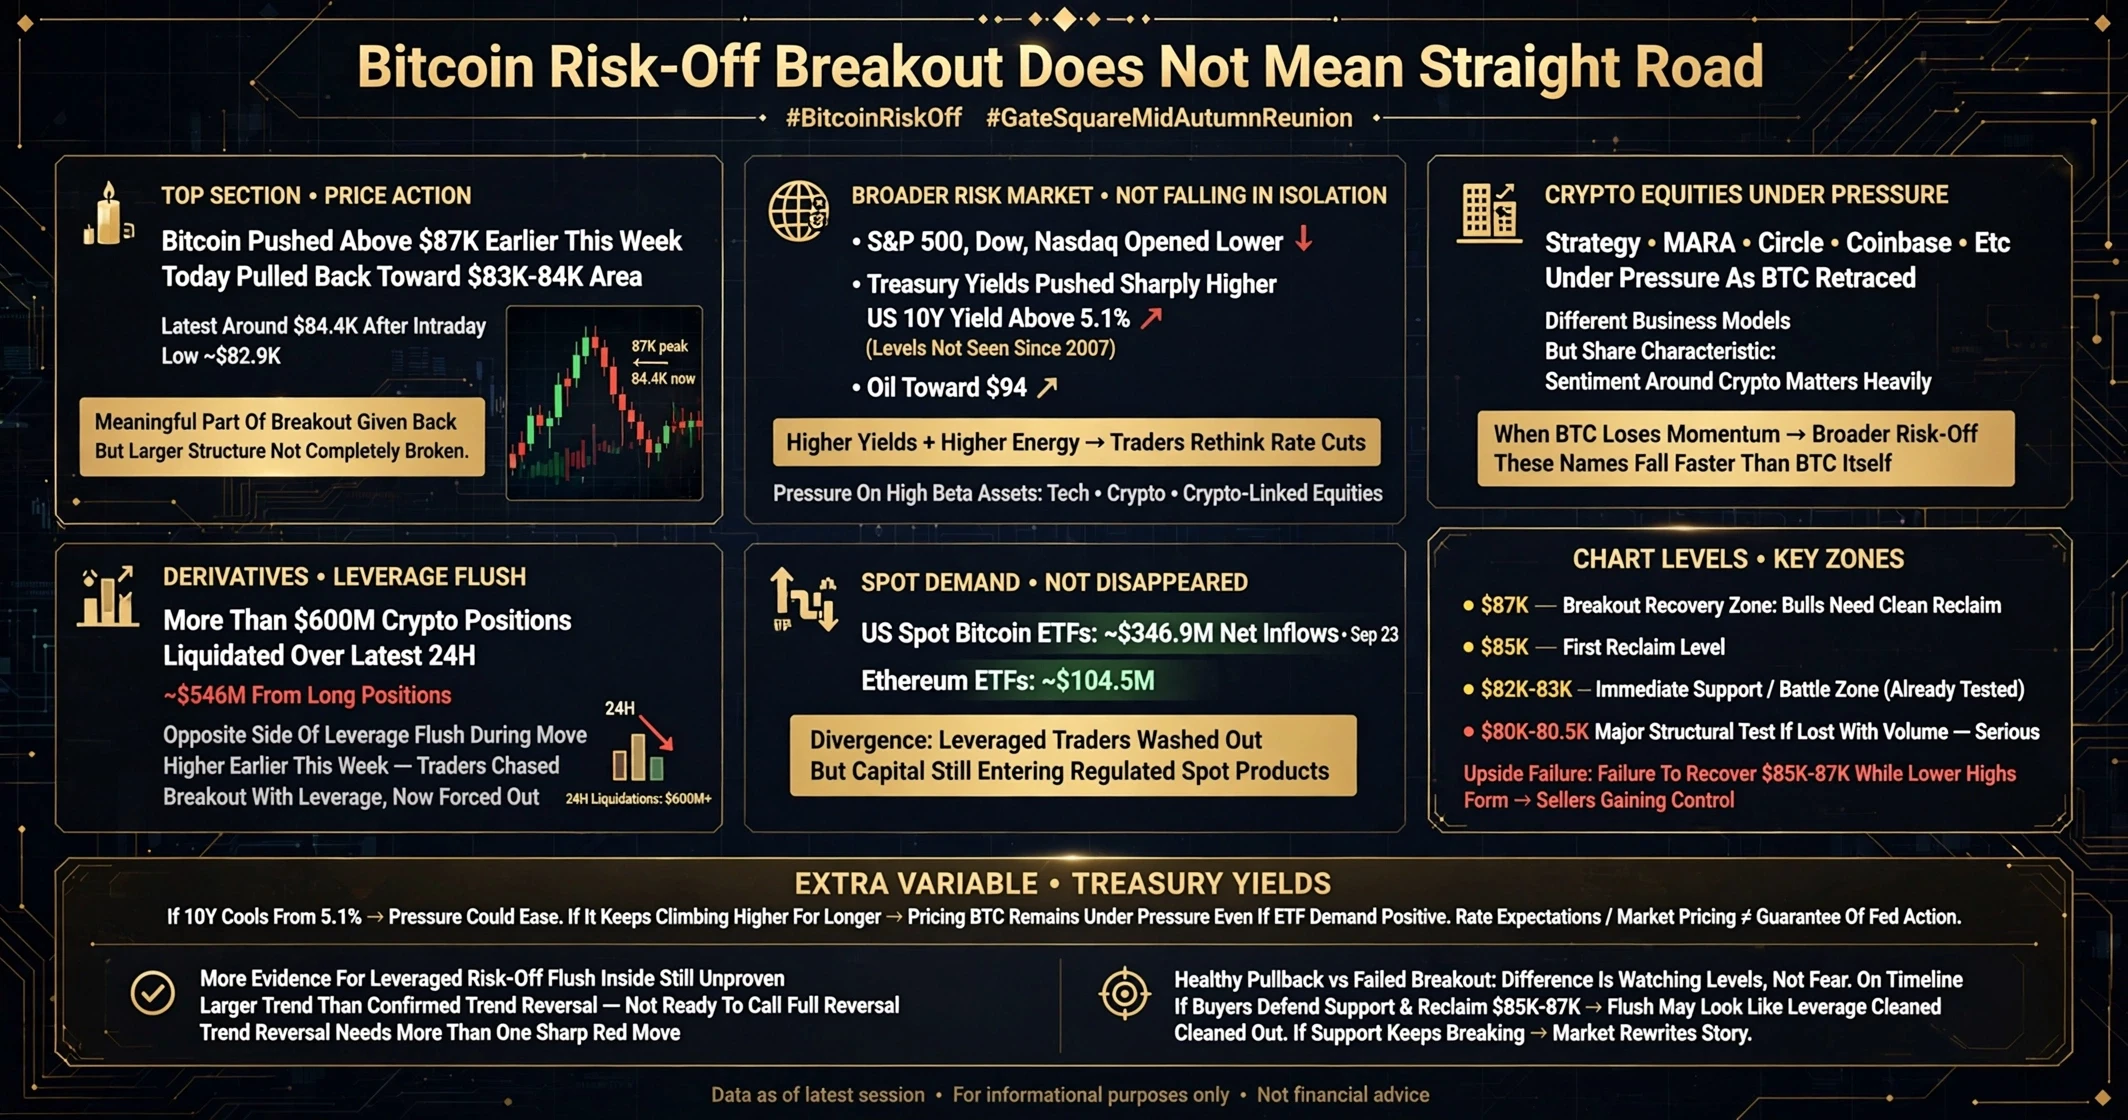
Bitcoin just reminded the market that a breakout does not mean the road suddenly becomes straight.
The latest move looks ugly on the screen, but I think the reason behind it is more important than the red candles themselves.
Bitcoin pushed above $87,000 earlier this week, but today it has pulled back toward the $83,000–$84,000 area. The latest market data puts BTC around $84.4K, after trading as low as roughly $82.9K intraday. That means a meaningful part of the breakout has already been given back, but the larger structure has not yet completely broken.
What m
MrFlower_XingChen
#CryptoStocksSlipBMNRDownOver4%
Bitcoin just reminded the market that a breakout does not mean the road suddenly becomes straight.
The latest move looks ugly on the screen, but I think the reason behind it is more important than the red candles themselves.
Bitcoin pushed above $87,000 earlier this week, but today it has pulled back toward the $83,000–$84,000 area. The latest market data puts BTC around $84.4K, after trading as low as roughly $82.9K intraday. That means a meaningful part of the breakout has already been given back, but the larger structure has not yet completely broken.
What makes today's move more interesting is that Bitcoin is not falling in isolation.
The broader risk market is under pressure too. The S&P 500, Dow and Nasdaq all opened lower, while Treasury yields pushed sharply higher. The U.S. 10-year yield moved above 5.1%, reaching levels not seen since 2007. At the same time, oil moved toward the $94 area. Higher yields and higher energy prices are forcing traders to rethink how quickly interest rates can come down, and that naturally puts pressure on higher-beta assets such as technology stocks, crypto and crypto-linked equities.
That explains why the weakness is spreading into the companies that usually trade as leveraged versions of the crypto market.
Strategy, MARA, Circle, Coinbase and other crypto-related equities have been under pressure as Bitcoin retraced. These companies do not have identical business models, but they share one important characteristic: market sentiment around crypto matters heavily to their valuations. When BTC loses momentum and the broader risk environment turns defensive, these names can fall faster than Bitcoin itself.
The derivatives market makes today's move even more important.
More than $600 million in crypto positions were liquidated over the latest 24-hour period, with approximately $546 million coming from long positions. This is the opposite side of the leverage flush we saw during Bitcoin's move higher earlier in the week. Traders who chased the breakout with leverage are now being forced out as price moves against them.
But here is the part I don't want to ignore:
Spot demand has not completely disappeared.
U.S. spot Bitcoin ETFs recorded around $346.9 million of net inflows on September 23, while Ethereum ETFs attracted roughly $104.5 million. That creates an interesting divergence: leveraged traders are getting washed out, but capital is still entering regulated spot products.
This is why I am not ready to call the current move a full trend reversal.
A trend reversal needs more than one sharp red move.
For me, the first area that matters is $82K–$83K. BTC has already tested that region during today's volatility. If buyers defend it and Bitcoin starts reclaiming $85K, the market can still treat this as a normal retracement after the move toward $87K.
The next important level is $80K–$80.5K.
That is where the situation becomes much more serious.
If BTC loses $80K with strong volume and fails to reclaim it, the argument changes. At that point, the market would be giving back a much larger portion of the breakout, and I would start paying far more attention to whether the previous bullish structure is actually breaking.
On the upside, $85K–$87K is now the area bulls need to recover.
A clean reclaim of $87K would tell me that today's flush did not destroy the breakout. A failure to recover that area while lower highs continue forming would show that sellers are gaining control of the short-term structure.
So my chart is simple right now:
$87K — breakout recovery zone
$85K — first reclaim level
$82K–$83K — immediate support/battle zone
$80K — major structural test
And there is one more variable I would watch closely: Treasury yields.
If the 10-year yield starts cooling from the 5.1% area, some of today's pressure on risk assets could ease. But if yields continue climbing and the market keeps pricing a higher-for-longer rate environment, Bitcoin could remain under pressure even if ETF demand stays positive. Current rate expectations are market pricing, not a guarantee of what the Federal Reserve will actually do.
So, short-term flush or trend reversal?
Right now, I see more evidence for a leveraged risk-off flush inside a still-unproven larger trend than for a confirmed trend reversal.
But I would not become complacent either.
Bitcoin has already shown that $87K is not an easy level to hold. Now the market has to prove that $82K–$83K can become support instead of the beginning of another leg lower.
That's the difference between a healthy pullback and a failed breakout.
The next move matters less than what Bitcoin does around these levels.
If buyers defend support and reclaim $85K–$87K, this flush may eventually look like nothing more than leverage being cleaned out.
If support keeps breaking, the market will have to rewrite the story.
For now, I'm watching the levels — not the fear on the timeline.
#GateSquareMidAutumnReunion
repost-content-media
#GateIdleEarnAddsUSD1UpTo8.16APR
Your USD1 can now earn while sitting in your Gate account — but the 8.16% headline needs a closer look.
Gate added USD1 to Idle Earn on September 23, giving eligible USD1 balances in Spot/Trading and Futures accounts a new automated reward mechanism.
The standard advertised APR is 6.8%, while eligible futures traders can receive a 1.2× boost, taking the maximum advertised rate to 8.16%.
But there is an important detail here: 6.8% does not mean 6.8% is paid entirely in USD1.
The current structure is:
1.5% APR in USD1 + 5.3% bonus APR in WLFI
So when comparing t
MrFlower_XingChen
#GateIdleEarnAddsUSD1UpTo8.16APR
Your USD1 can now earn while sitting in your Gate account — but the 8.16% headline needs a closer look.
Gate added USD1 to Idle Earn on September 23, giving eligible USD1 balances in Spot/Trading and Futures accounts a new automated reward mechanism.
The standard advertised APR is 6.8%, while eligible futures traders can receive a 1.2× boost, taking the maximum advertised rate to 8.16%.
But there is an important detail here: 6.8% does not mean 6.8% is paid entirely in USD1.
The current structure is:
1.5% APR in USD1 + 5.3% bonus APR in WLFI
So when comparing this with other yield products, I would look at the reward composition, not just the headline percentage.
The 8.16% rate also isn't available automatically.
To unlock the 1.2× boost, you need at least 150,000 USD1 in futures trading volume over the previous 30 days. The boosted rate applies to eligible USD1 holdings up to 500,000 USD1. Any eligible balance above that limit remains under the standard rate.
That gives us four numbers worth remembering:
6.8% — standard APR
8.16% — maximum boosted APR
150,000 USD1 — required 30-day futures volume
500,000 USD1 — maximum balance eligible for the boost
There is another point traders shouldn't overlook: the APR is dynamic.
Gate says the displayed rate can change based on the remaining monthly reward pool and the total eligible USD1 balance. So 8.16% should be viewed as the maximum advertised scenario, not a permanently fixed return.
The product also doesn't work like a traditional fixed-term lockup. Eligible USD1 remains in the relevant account, with Gate using a daily average-balance snapshot for calculation and distributing rewards on a T+1 basis.
Borrowed USD1 doesn't qualify, and Gate also says the existing USD1 holding-yield program will end soon, with the exact transition date to be announced separately.
So for me, the interesting part isn't simply “USD1 now offers up to 8.16%.”
It is the structure behind it:
idle balance + daily snapshot + futures activity + dynamic APR + automated rewards.
If you're tracking this program, don't watch only the headline APR. Watch the live APR, remaining reward pool, eligible USD1 balance and your actual reward composition over time.
That will tell us much more about the real economics of Idle Earn than the 8.16% headline alone.
repost-content-media
USD1-0.03%
WLFI+2.65%
#BTCShortTermPullback
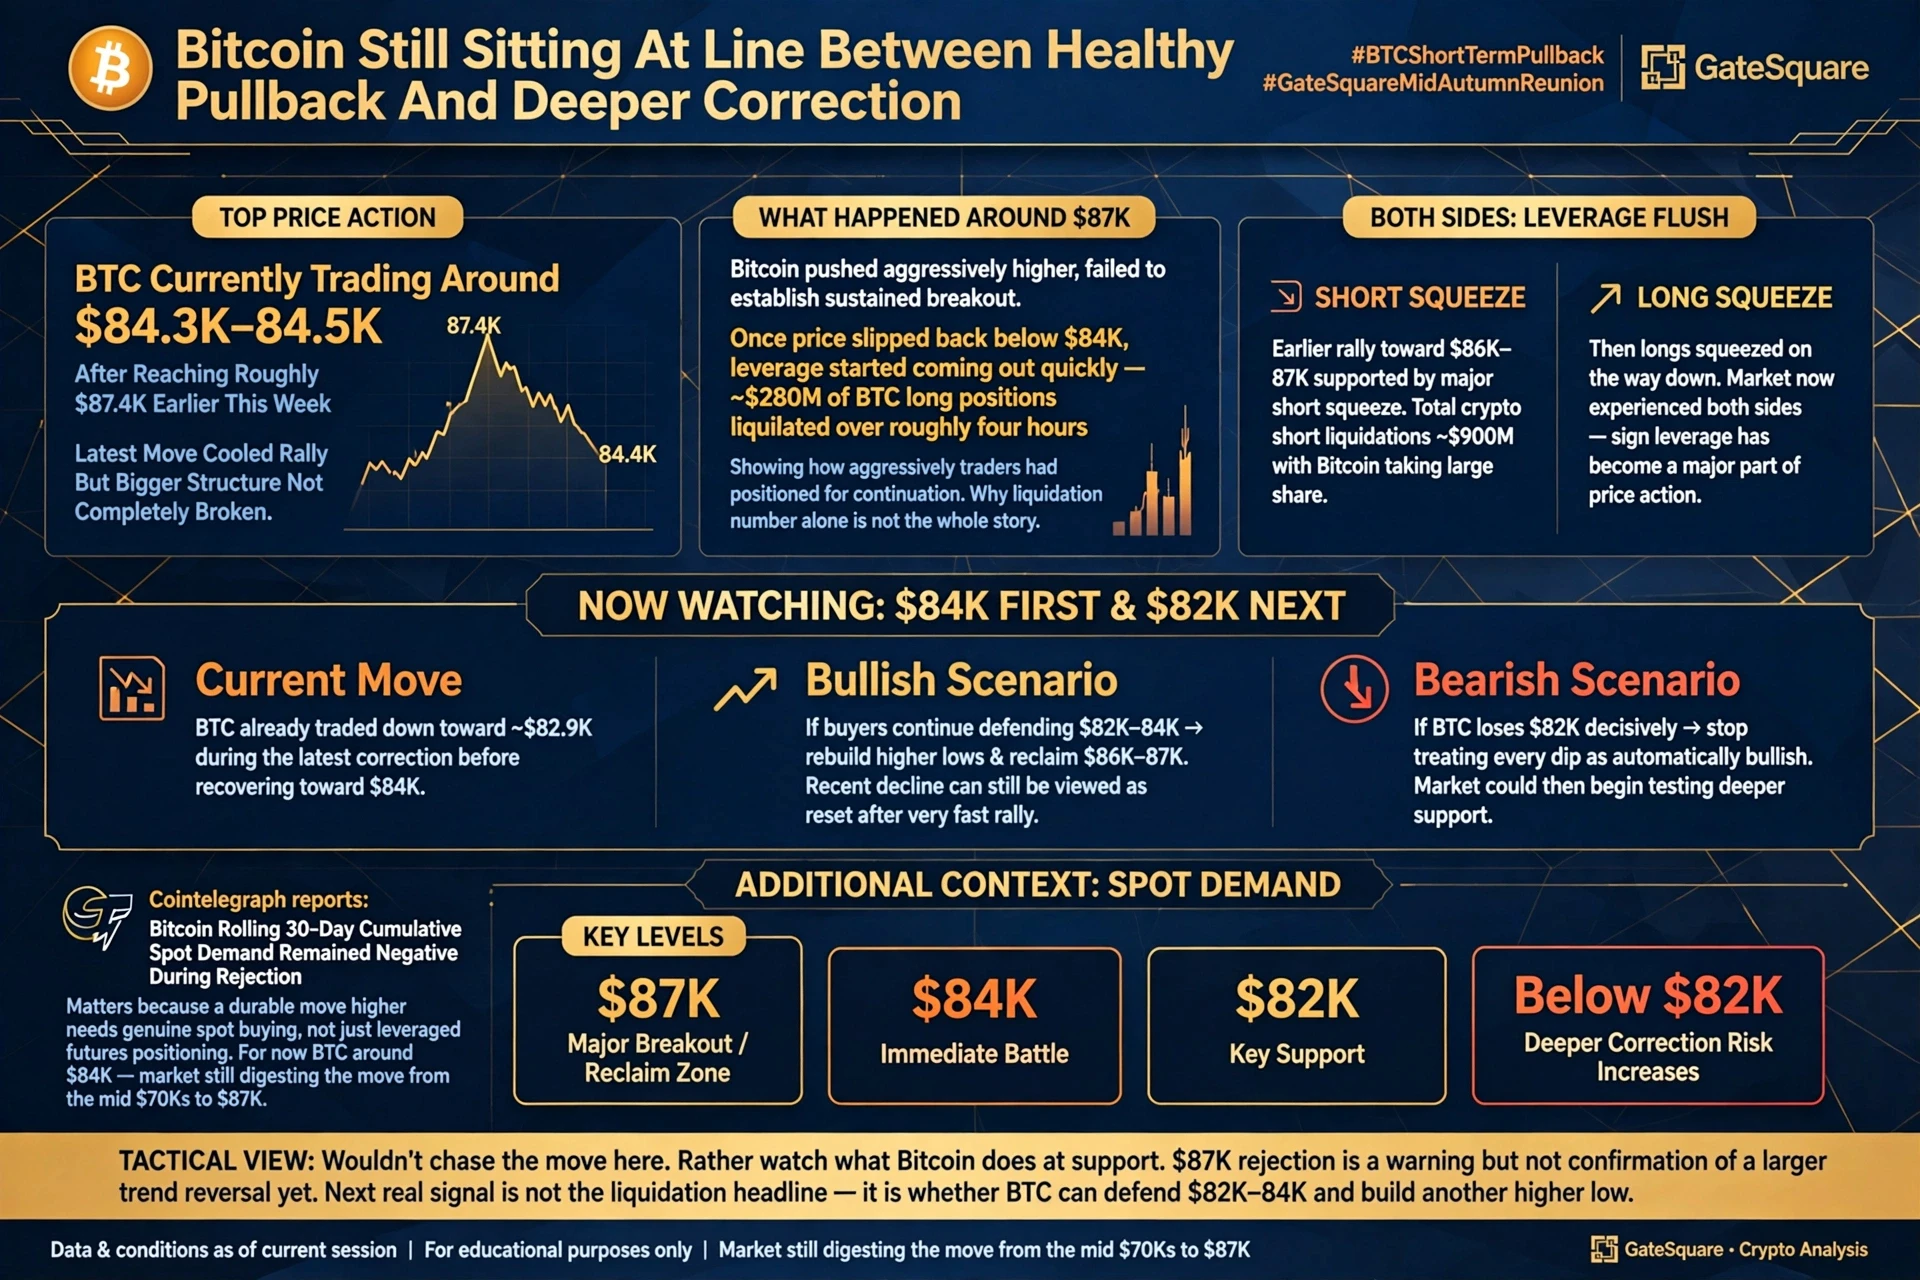
Bitcoin is still sitting at the line between a healthy pullback and a deeper correction.
BTC is currently trading around $84.3K–$84.5K, after reaching roughly $87.4K earlier this week. The latest move has cooled the rally, but the bigger structure has not been completely broken.
What happened around $87K is important.
Bitcoin pushed aggressively higher, but failed to establish a sustained breakout. Once price slipped back below $84K, leverage started coming out quickly. Around $280M of BTC long positions were liquidated over roughly four hours, showing how aggressively t
MrFlower_XingChen
#BTCShortTermPullback
Bitcoin is still sitting at the line between a healthy pullback and a deeper correction.
BTC is currently trading around $84.3K–$84.5K, after reaching roughly $87.4K earlier this week. The latest move has cooled the rally, but the bigger structure has not been completely broken.
What happened around $87K is important.
Bitcoin pushed aggressively higher, but failed to establish a sustained breakout. Once price slipped back below $84K, leverage started coming out quickly. Around $280M of BTC long positions were liquidated over roughly four hours, showing how aggressively traders had positioned for continuation.
This is why I don't think the liquidation number alone tells the whole story.
Earlier in the rally, Bitcoin's move toward $86K–$87K was also supported by a major short squeeze. Reports put total crypto short liquidations near $900M, with Bitcoin accounting for a large share.
So the market has now experienced both sides:
Shorts were squeezed on the way up.
Late longs were squeezed on the way down.
That is usually a sign that leverage has become a major part of the price action.
Now I am watching $84K first and $82K next.
BTC has already traded down toward roughly $82.9K during the latest correction before recovering toward $84K.
If buyers continue defending $82K–$84K, rebuild higher lows and reclaim $86K–$87K, the recent decline can still be viewed as a reset after a very fast rally.
But if BTC loses $82K decisively, I would stop treating every dip as automatically bullish. The market could then begin testing deeper support.
There is another reason I am staying patient: spot demand.
Cointelegraph reported that Bitcoin's rolling 30-day cumulative spot demand remained negative during the rejection. That matters because a durable move higher needs genuine spot buying, not just leveraged futures positioning.
For now, BTC is around $84K, with the market still digesting the move from the mid-$70Ks to $87K.
My levels are simple:
$87K → major breakout/reclaim zone
$84K → immediate battle
$82K → key support
Below $82K → deeper correction risk increases
I wouldn't chase the move here.
I would rather watch what Bitcoin does at support.
The $87K rejection is a warning, but it is not confirmation of a larger trend reversal yet.
The next real signal is not the liquidation headline.
It is whether BTC can defend $82K–$84K and build another higher low.
#GateSquareMidAutumnReunion
repost-content-media
BTC-0.03%
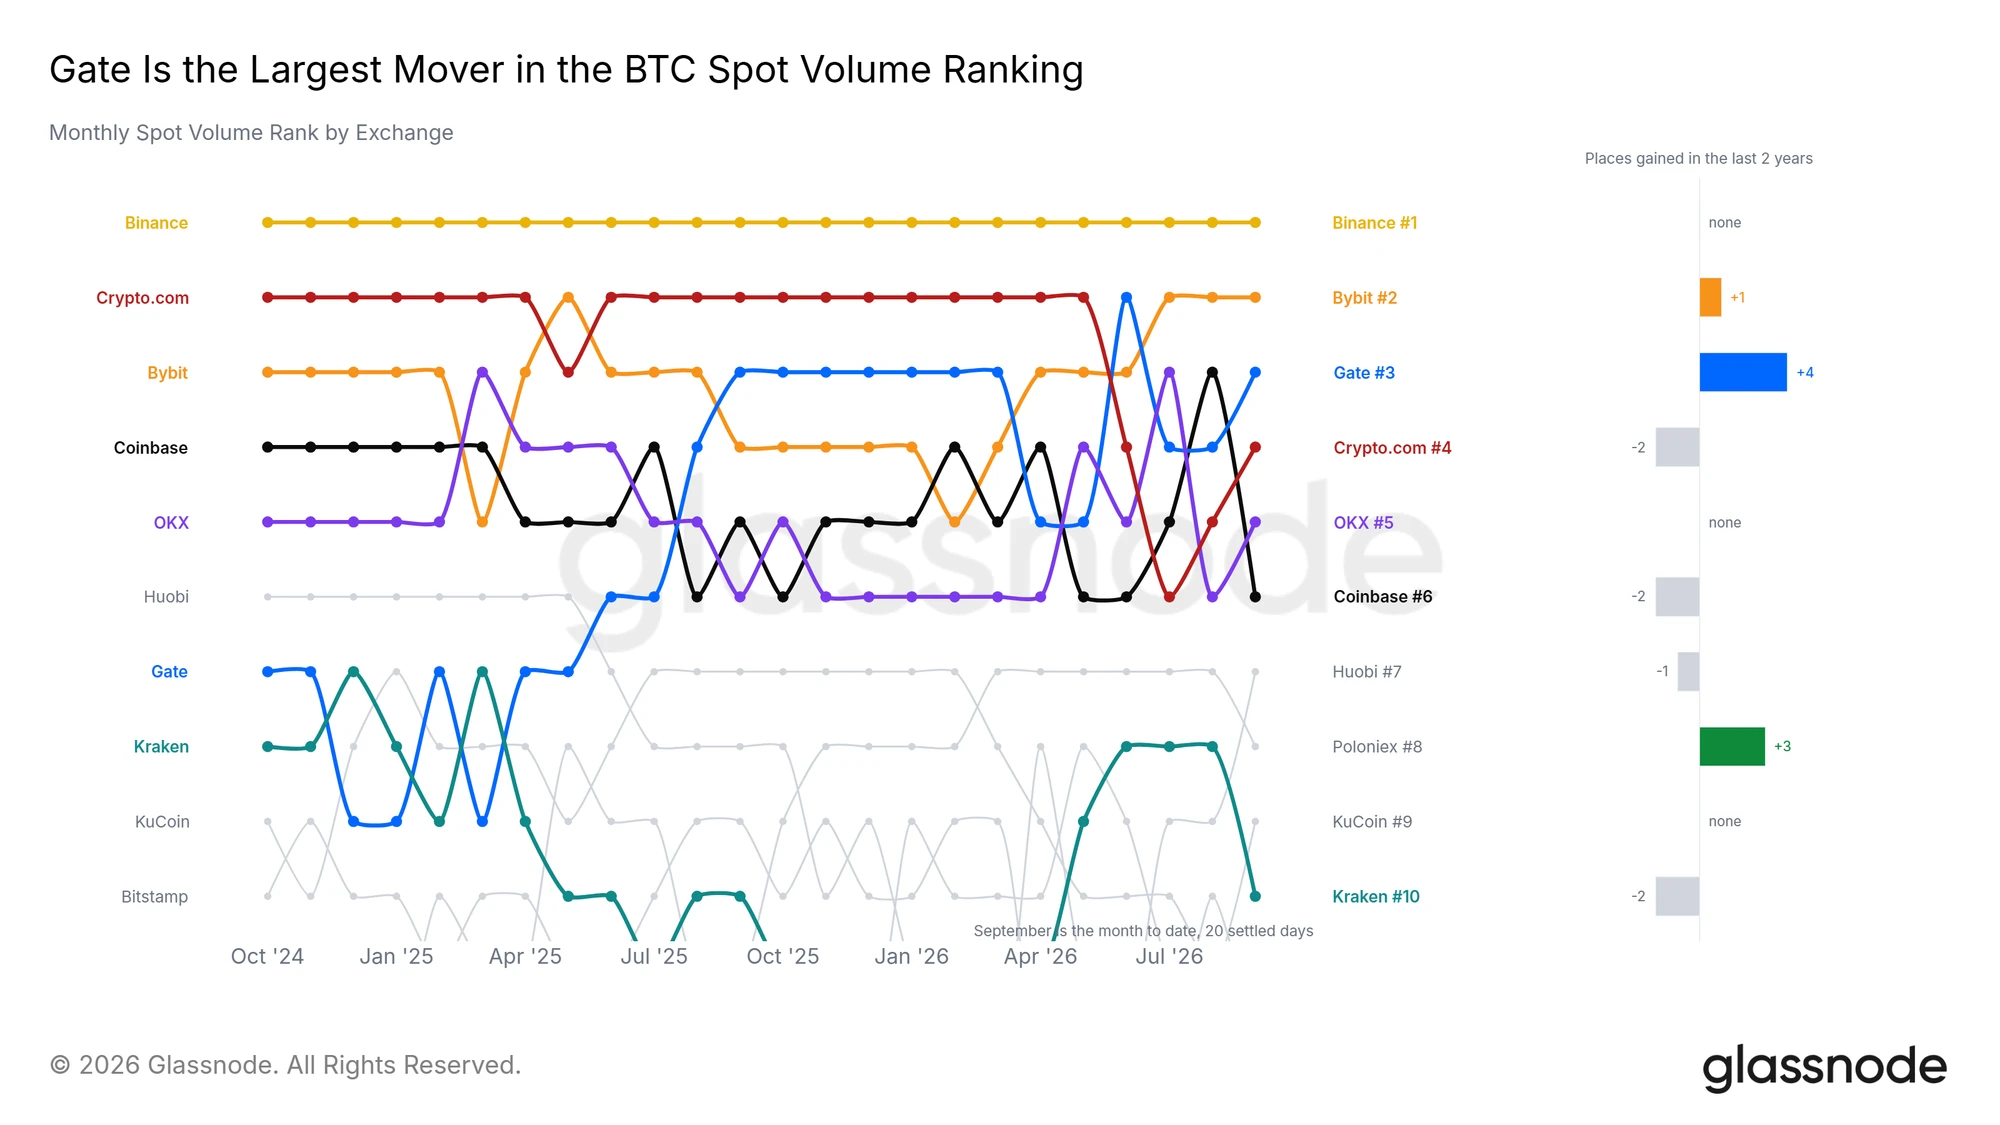
#GateBTCSpotVolumeRanksTop3
Something underneath this crypto rally has changed — and this time the altcoin signal is getting harder to ignore.
Glassnode’s Altcoin Cycle Signal reached 81.25/100 on September 22, moving into its altcoin-season zone. But the number itself isn't the story.
The more interesting question is what is happening underneath it.
During the earlier part of this recovery, Bitcoin was doing most of the heavy lifting. BTC rallied first, while many altcoins struggled to keep pace.
Now the structure is changing.
Glassnode’s latest research shows that 72.5% of the tracked altco
MrFlower_XingChen
#GateBTCSpotVolumeRanksTop3
Something underneath this crypto rally has changed — and this time the altcoin signal is getting harder to ignore.
Glassnode’s Altcoin Cycle Signal reached 81.25/100 on September 22, moving into its altcoin-season zone. But the number itself isn't the story.
The more interesting question is what is happening underneath it.
During the earlier part of this recovery, Bitcoin was doing most of the heavy lifting. BTC rallied first, while many altcoins struggled to keep pace.
Now the structure is changing.
Glassnode’s latest research shows that 72.5% of the tracked altcoins outperformed Bitcoin over the past week. During the August squeeze, that figure peaked at only 39%. That is a meaningful change in market breadth.
And there is another detail I like even more:
Altcoins are gaining without a major expansion in leverage.
Glassnode says altcoin perpetual open interest, measured in coins, has barely increased over the past 30 days, with fewer than half of tracked markets adding positions. That is very different from overheated periods such as February 2021 and December 2024, when leverage expanded aggressively across the market.
In simple terms, this rotation currently looks more connected to spot participation and relative performance than a massive futures-driven chase.
That doesn't mean risk has disappeared.
Bitcoin remains the anchor.
Current market data puts BTC dominance around 57.1%, while global crypto market capitalization is around $2.95 trillion. BTC is still responsible for roughly 57% of the total market, so this is not a situation where capital has suddenly abandoned Bitcoin.
That distinction matters.
A healthy rotation does not necessarily require Bitcoin to fall.
The more interesting setup is exactly what we are seeing now:
BTC holds its structure → BTC dominance stops rising → major alts begin outperforming → participation expands.
Ethereum is one of the clearest examples.
Reuters recently noted that ETH broke above the $2,661.52 resistance area after consolidating following its August rally. The report identified further technical levels around $2,775–$2,825, while also highlighting $2,560–$2,565 as an important downside area.
That matters because ETH is not just another altcoin. It remains one of the largest liquidity hubs in the entire crypto market.
But I would still avoid calling this a guaranteed “full altseason.”
There is an important difference between altcoins outperforming Bitcoin and the entire altcoin market entering a broad speculative phase.
Glassnode's own data actually gives us a useful warning.
Its latest research says the altcoin rally is occurring with relatively little new leverage, which is constructive from a positioning perspective. But breadth still needs to remain strong. If performance becomes concentrated in a handful of tokens, the 81.25 reading can remain elevated while the underlying market becomes much narrower.
This is why I am watching several things together instead of relying on one indicator.
BTC: Can Bitcoin maintain its recent breakout structure?
BTC dominance: Can the ~57% area gradually weaken without BTC suffering a major breakdown?
ETH/BTC: Can Ethereum continue gaining relative strength?
Altcoin breadth: Are more sectors participating?
Leverage: Does open interest remain controlled, or does speculation suddenly explode?
Spot demand: Does actual spot volume continue expanding?
Glassnode has already reported that Bitcoin spot volume has more than doubled from its August low, while ETF buying has been picking up. It also places an important BTC cost-basis zone around $84K–$85K and identifies the mean MVRV price near $96.7K as the next major on-chain resistance.
That gives the current rotation an interesting foundation.
Bitcoin does not need to disappear for altcoins to perform.
In fact, if BTC can consolidate while capital gradually moves further down the risk curve, that could allow more sectors to participate without immediately creating the kind of leverage-driven environment that usually ends badly.
But there is also a clear invalidation signal for this thesis:
If BTC loses its structure, dominance suddenly rebounds, altcoin breadth contracts and futures leverage starts rising aggressively, then the current rotation can change very quickly.
So I don't think the important question is:
“Is this altseason?”
The better question is:
“Is capital rotation becoming broad, persistent and spot-supported?”
Right now, several pieces are moving in that direction.
The 81.25 Glassnode signal is real.
72.5% of tracked alts recently outperformed BTC.
Altcoin futures leverage has not exploded.
BTC dominance remains below 60%.
ETH has regained important technical ground.
And broader spot participation is improving.
That is more meaningful than simply watching a few altcoins pump.
But the next stage still needs confirmation.
A signal can identify rotation.
Only sustained breadth can prove it.
For now, I'm watching whether this rotation keeps spreading — because that will tell us much more than the headline “altseason” label.
DYOR 🔎
#GateSquareMidAutumnReunion
repost-content-media
BTC-0.04%
ETH-0.47%
#GateSquareMidAutumnReunion
BTC Just Gave Back Part of the Rally — Now the Levels Matter
Bitcoin is trading around $84.4K right now, and the important thing is not simply whether BTC is green or red today.
The bigger picture is what happened during the last week.
From September 17 to September 24, BTC moved from roughly $75.9K to a weekly high of $87.36K, giving the market almost a 15% weekly range. After that aggressive move, Bitcoin rejected the $87K area and pulled back toward the low-$83K region before stabilizing again around $84K.
That makes this a very important decision zone.
What act
MrFlower_XingChen
#GateSquareMidAutumnReunion
BTC Just Gave Back Part of the Rally — Now the Levels Matter
Bitcoin is trading around $84.4K right now, and the important thing is not simply whether BTC is green or red today.
The bigger picture is what happened during the last week.
From September 17 to September 24, BTC moved from roughly $75.9K to a weekly high of $87.36K, giving the market almost a 15% weekly range. After that aggressive move, Bitcoin rejected the $87K area and pulled back toward the low-$83K region before stabilizing again around $84K.
That makes this a very important decision zone.
What actually happened?
The move started from the $75.9K–$76K area.
BTC then pushed through $80K, reclaimed $81K–$82K and accelerated toward $86K–$87K. On September 21 alone, Bitcoin traded between approximately $80.87K and $87.36K, showing just how quickly liquidity entered the market.
But $87K was not cleanly accepted.
BTC rejected that area and moved back toward $83K. The recent intraday data shows a low around $82.94K before price recovered toward $84K+.
So I would describe the current move as:
$76K → $87.36K impulse → $82.9K pullback → ~$84.4K stabilization.
The important question now is whether this is simply a healthy retracement after a strong rally, or the beginning of a deeper correction.
My key BTC levels
I would keep the chart relatively simple.
Resistance 1: $84.8K–$85K
This is the first area BTC needs to reclaim with strength.
Resistance 2: $86K–$87.4K
This is the major supply zone from the recent rejection. A clean breakout above $87.4K with strong volume would change the short-term structure again.
Psychological resistance: $90K
If BTC gets above the previous high, $90K becomes the obvious psychological level traders will watch.
On the downside:
Support 1: $83K–$82.9K
This is the first important defense zone after the latest rejection.
Support 2: $81K–$80K
This is much more important. BTC spent considerable time around this area before the breakout toward $87K.
Major support: $76K–$75K
This is the week's starting region and a much deeper structural support area.
Coinbase Institutional's recent framework also identified $83K as a key BTC level, with $90K and $95K above it, while $70K–$72K was identified as a deeper support zone.
Volume is the confirmation I want
Price alone is not enough here.
BTC already demonstrated that it can move from the mid-$70Ks to the high-$80Ks very quickly. The next breakout should therefore be confirmed by expanding spot volume, not just a thin candle pushing through resistance.
The September 21 move was accompanied by roughly $57.7B in reported daily BTC volume, considerably above the ~$20B–$21B levels seen on September 19–20. That tells me the breakout phase had real activity behind it.
Now I want to see whether volume returns when BTC challenges $85K–$87K.
If price breaks resistance while volume stays weak, I would be much more careful about chasing the candle.
The macro problem has not disappeared
There is another reason I don't want to blindly chase BTC here.
The latest U.S. PMI data came in much stronger than expected, while input-price pressure also increased. That pushed expectations for another Fed rate hike higher and Treasury yields jumped. BTC subsequently retreated and stabilized around $84K.
So BTC is currently fighting two forces:
Crypto momentum is strong.
But
higher-rate expectations are still a macro headwind.
That combination can produce very sharp two-way moves.
How I would trade this structure
I don't think the best trade is simply buying BTC because it dropped from $87K.
For me, there are two cleaner setups.
Setup 1 — Breakout
If BTC reclaims $85K and then breaks $86K–$87.4K with strong volume and holds the breakout on a retest, that would give a much cleaner momentum setup.
The next psychological area would be around $90K.
The invalidation should be placed below the reclaimed structure rather than giving the trade unlimited room.
Setup 2 — Support reaction
If BTC pulls back toward $83K–$82.9K and buyers defend the area with a clear rejection candle and improving volume, that can offer a better risk-defined long than chasing at $85K+.
If that support fails, I would watch $81K–$80K next.
And if $80K is lost decisively, the market structure becomes much less comfortable and I would stop treating every dip as an automatic buying opportunity.
The level I care about most
For me, $83K is the line to watch right now.
Above it, BTC is still holding the area that Coinbase Institutional highlighted as a key resistance/support pivot after the recent move.
Below it, I would start paying much more attention to $81K–$80K.
Above $87.4K, the recent rejection is effectively being challenged again.
So rather than predicting the next candle, I would let BTC show its hand.
$83K–$85K = decision zone.
$87.4K = breakout trigger.
$90K = next major psychological level.
$81K–$80K = important downside defense.
$76K–$75K = major weekly support.
The rally from $76K to $87K was already powerful. The market doesn't need to go straight up from here to remain constructive.
Sometimes the healthiest thing after a 15% move is simply to consolidate, build liquidity and allow the next direction to develop.
For traders, that means patience matters more than prediction.
I would rather enter after BTC confirms a level than chase another green candle.
BTC is not at a random price right now. It is sitting directly between a recent breakout zone and a recent rejection zone — and the next high-volume move should tell us which side wins.
$BTC ‌
repost-content-media
BTC-0.04%
#ShareWeekly
ONDO just showed why fundamentals can suddenly wake up a chart. The token jumped from around $0.41 to $0.52, with the latest session closing near $0.517 and volume expanding sharply. The catalyst is Ondo’s new Intelligent Portfolios, where the first three on-chain portfolio strategies were developed by BlackRock for Ondo. This is not BlackRock buying ONDO, but it is a meaningful step in bringing traditional portfolio strategies on-chain. Personally, after a 25%+ daily move, I wouldn’t chase the candle. I’m watching $0.50 as the key hold zone: staying above it keeps $0.55–$0.58
MrFlower_XingChen
#ShareWeekly
ONDO just showed why fundamentals can suddenly wake up a chart. The token jumped from around $0.41 to $0.52, with the latest session closing near $0.517 and volume expanding sharply. The catalyst is Ondo’s new Intelligent Portfolios, where the first three on-chain portfolio strategies were developed by BlackRock for Ondo. This is not BlackRock buying ONDO, but it is a meaningful step in bringing traditional portfolio strategies on-chain. Personally, after a 25%+ daily move, I wouldn’t chase the candle. I’m watching $0.50 as the key hold zone: staying above it keeps $0.55–$0.58 in focus, while losing $0.50 could bring a pullback toward $0.47–$0.45. For me, the real test is whether ONDO can turn this news-driven spike into a new support structure rather than giving the entire move back.
$ONDO ‌#GateSquareMidAutumnReunion
ONDO+25.00%
Market update BTC and Other Coin
live-replay-cover
179 views09-25 01:18
00:35:22
#USSeptemberCompositePMISurgesTo58.4 30-Year Treasury Yield Breaks 5% — A Structural Shift in Global Capital Markets
The US 30-year Treasury yield has decisively crossed the 5% threshold. This is not a temporary spike. It is one of the most important macroeconomic signals of the decade.
For more than a decade, global markets operated under ultra-low interest rates, abundant liquidity, and aggressive central-bank support. That regime is ending. A “risk-free” return above 5% from the world’s deepest and most liquid government bond market forces a complete repricing of risk across every major ass
BlackoutHawkCryptoBoy
#USSeptemberCompositePMISurgesTo58.4 30-Year Treasury Yield Breaks 5% — A Structural Shift in Global Capital Markets
The US 30-year Treasury yield has decisively crossed the 5% threshold. This is not a temporary spike. It is one of the most important macroeconomic signals of the decade.
For more than a decade, global markets operated under ultra-low interest rates, abundant liquidity, and aggressive central-bank support. That regime is ending. A “risk-free” return above 5% from the world’s deepest and most liquid government bond market forces a complete repricing of risk across every major asset class.
Why This Level Matters
A 5% long-term Treasury yield changes the opportunity cost of capital worldwide. Institutional money that once chased growth equities, private tech valuations, and speculative digital assets now has a genuine alternative: high-quality sovereign yield with minimal credit risk.
This is already visible in:
Pressure on long-duration equities and technology valuations
Reduced risk appetite for high-beta assets
Increased sensitivity of Bitcoin and crypto markets to bond-market moves
When the risk-free rate rises this sharply, every other asset must compete harder for capital.
Inflation, Policy, and the Higher-for-Longer Reality
Sticky inflation, elevated producer costs, and ongoing geopolitical uncertainty continue to support the case that the Federal Reserve will keep monetary conditions restrictive for longer than many had hoped. Markets are no longer pricing a rapid return to easy money. They are adapting to a world of tighter liquidity and higher real rates.
Crypto’s Real-Time Reaction
Bitcoin, still viewed by many as a long-term monetary alternative, has shown clear sensitivity to this shift. Short-term capital flows are reacting to Treasury yields, ETF flows, and macroeconomic sentiment. When yields surge, institutional capital often rotates temporarily into fixed income, reducing immediate demand for higher-risk assets.
Yet beneath the volatility a deeper trend is accelerating: the tokenization of real-world assets. Tokenized US Treasuries are reaching record adoption as blockchain infrastructure begins to merge with traditional finance. Digital assets are no longer operating in isolation — they are becoming part of the next technological layer of global capital markets.
At the same time, rising sovereign debt levels and higher interest costs are intensifying debates about fiscal sustainability and long-term currency purchasing power. In this environment, the conversation around scarce, decentralized assets is likely to remain central.
The Real Challenge: Adaptation
This moment is not simply bullish or bearish. It is a structural transition.
Investors now face a landscape where:
Bond yields offer historically competitive returns
Liquidity remains constrained
Inflation continues to shape policy
Digital assets are integrating with traditional finance
Institutional capital is rewriting market structure
Periods of major regime change create uncertainty. They also create opportunity for those who focus on long-term positioning rather than short-term emotion.
The financial system is entering a new era of capital allocation. Every major asset class is being forced to adapt.
How are you adjusting your portfolio as markets reprice around a higher-for-longer interest-rate environment?
#30YearTreasuryYieldBreaks5% #GlobalFinance #Tokenization #RiskManagement
BTC-0.04%
Market update BTC and Other Coin
live-replay-cover
271 views09-24 21:11
02:59:52
Market update BTC and Other Coin
live-replay-cover
577 views09-24 15:42
02:20:36
Market update
live-replay-cover
157 views09-24 14:57
00:20:32
Market update
live-replay-cover
279 views09-24 14:09
00:35:05
Market update
live-replay-cover
418 views09-24 13:18
00:31:54
Market update
live-replay-cover
225 views09-24 12:27
00:38:29
Market update
live-replay-cover
327 views09-24 11:27
00:39:49
Market update
live-replay-cover
273 views09-24 10:38
00:33:48