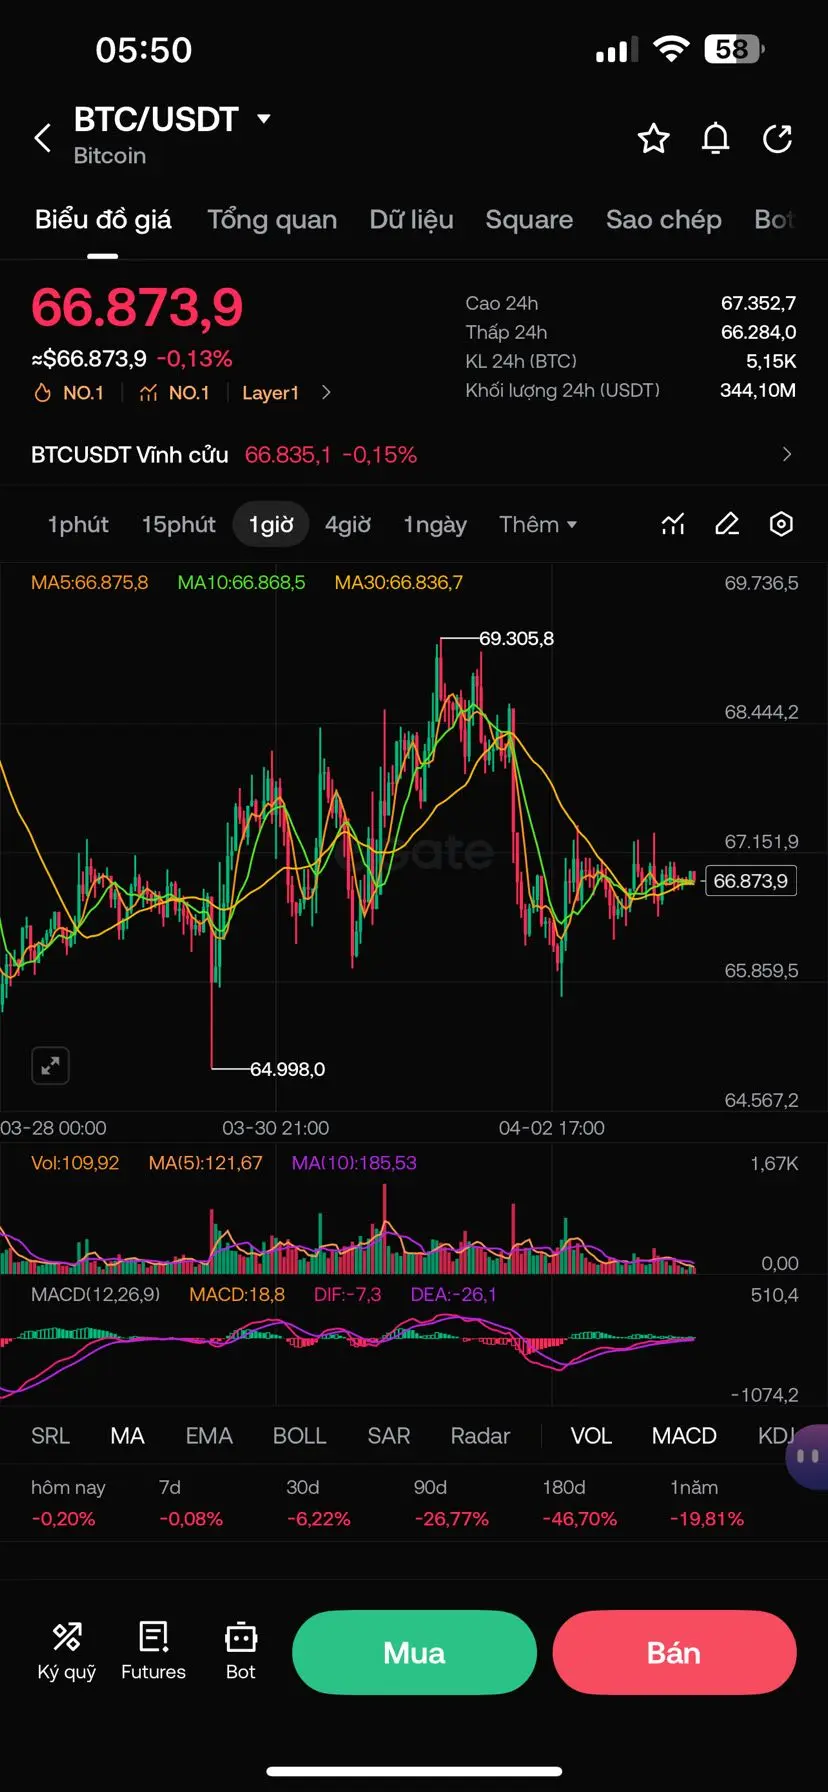
Quick look at the current Bitcoin chart:
The price is around 66.8k, after reaching a short-term peak of approximately 67.3k, it shows signs of slowing down. The fluctuation range is small, leaning more towards a weak sideways movement rather than an immediate breakout.
Notable points:
• Short-term frame: buying pressure is no longer very strong, sideways movement indicates the market is “resting”
• Nearby support zone: 66k – 65.5k, a break below could lead to a deeper dip
• Resistance: 67.5k – 68k, requires high volume to decisively break through
The percentage indicators below show:
• Sho
View OriginalBTC NEW DAY
1 ParticipantsVoting Finished