Square
Following
Hot
News
Profile
Share your thoughts
placeholder
Article
crypto market update btc
live-cover
LIVE2,295
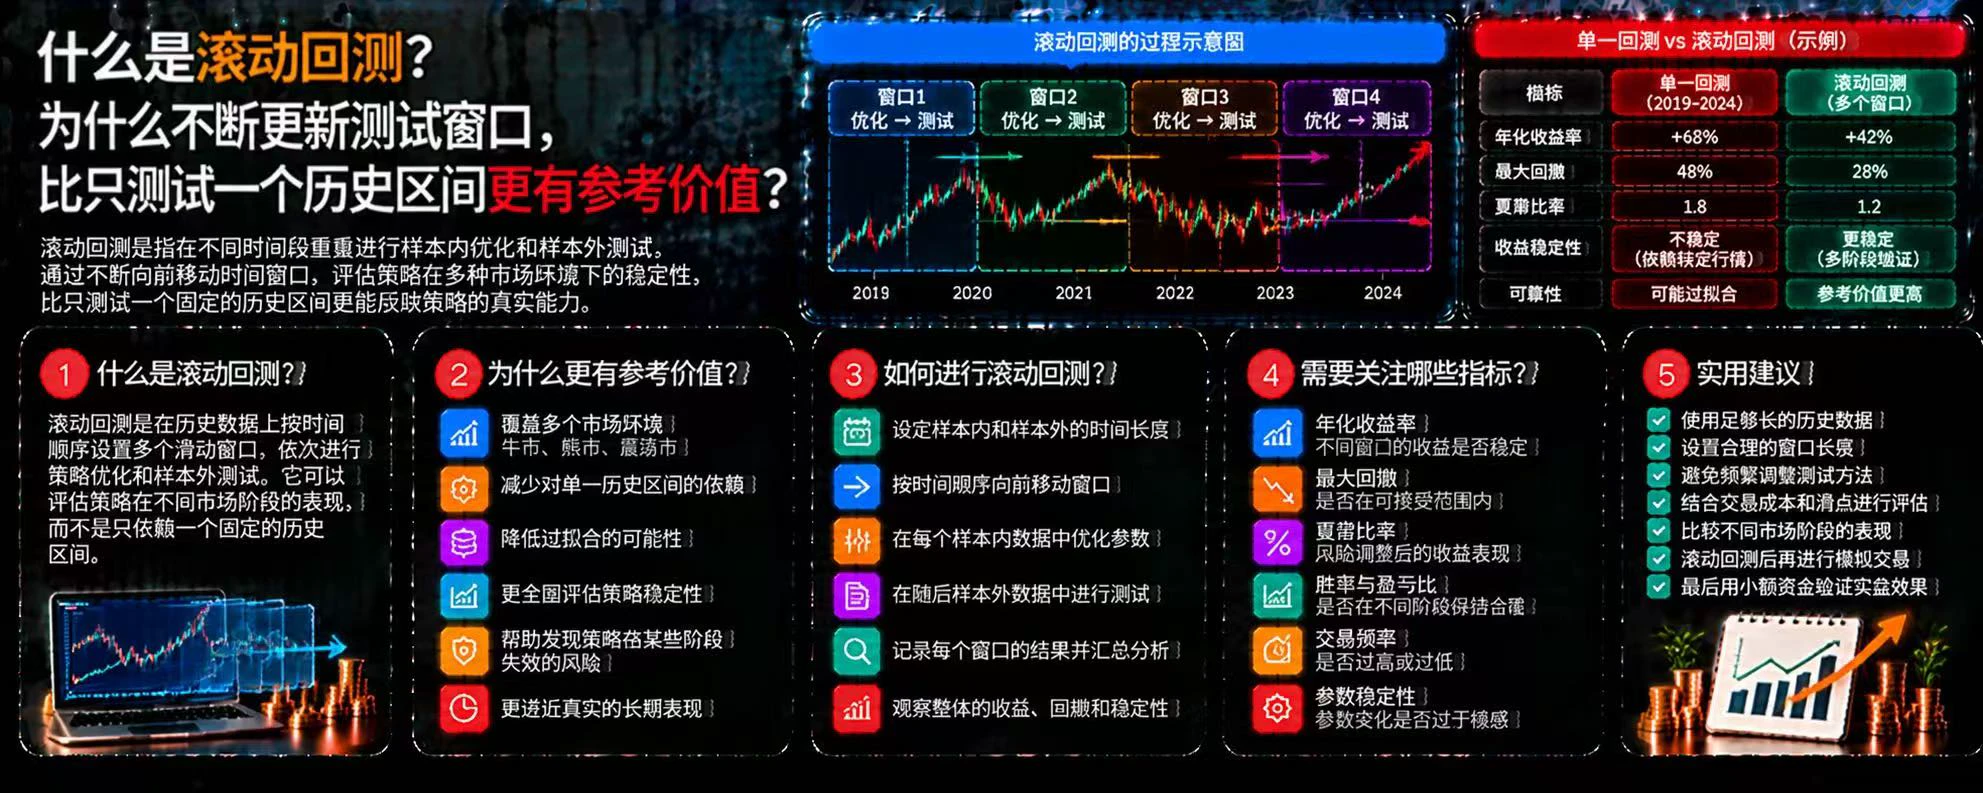
What is rolling backtesting? Why is continually updating the test window more informative than testing just one historical period?
In cryptocurrency trading, a strategy may perform well during one historical market period but fail to adapt to subsequent market changes. Testing only one fixed period can easily overlook how the strategy performs under different conditions. Rolling backtesting helps traders evaluate a strategy's stability more comprehensively by continually updating the test window.
First, what is rolling backtesting?
Rolling backtesting divides historical data into multiple cons
post-image
Trenches
ZIG
Z
bade
b
ZIG
0x8c...1145
Market Cap
$.
Change
.
24h Vol
$.
Holders
.
BTC
B
bade
b
BTC
C5xp...pump
Market Cap
$.
Change
.
24h Vol
$.
Holders
.
HIGH
H
bade
b
HIGH
7ymF...high
Market Cap
$.
Change
.
24h Vol
$.
Holders
.
STONK
S
bade
b
STONK
6GmA...UNgx
Market Cap
$.
Change
.
24h Vol
$.
Holders
.
CORLA
C
bade
b
CORLA
0xba...7777
Market Cap
$.
Change
.
24h Vol
$.
Holders
.
Figure 1 shows ETH’s price action, and Figure 2 shows some patterns. Does the triangle in Figure 1 have successively lower highs and higher lows, forming a triangle pattern? Comparing it with Figure 2, which one do you think fits? Isn’t the first one on the left a better fit? Then whether it’s bullish or bearish is obvious, right? 😉 Unless this structure breaks—for example, if the highs keep rising or the lows keep falling, you can’t use this structure to analyze it! 🤭
#eth #BTC
ETH-1.26%
BTC-0.67%
#Gate推出行业首个资金安全证明
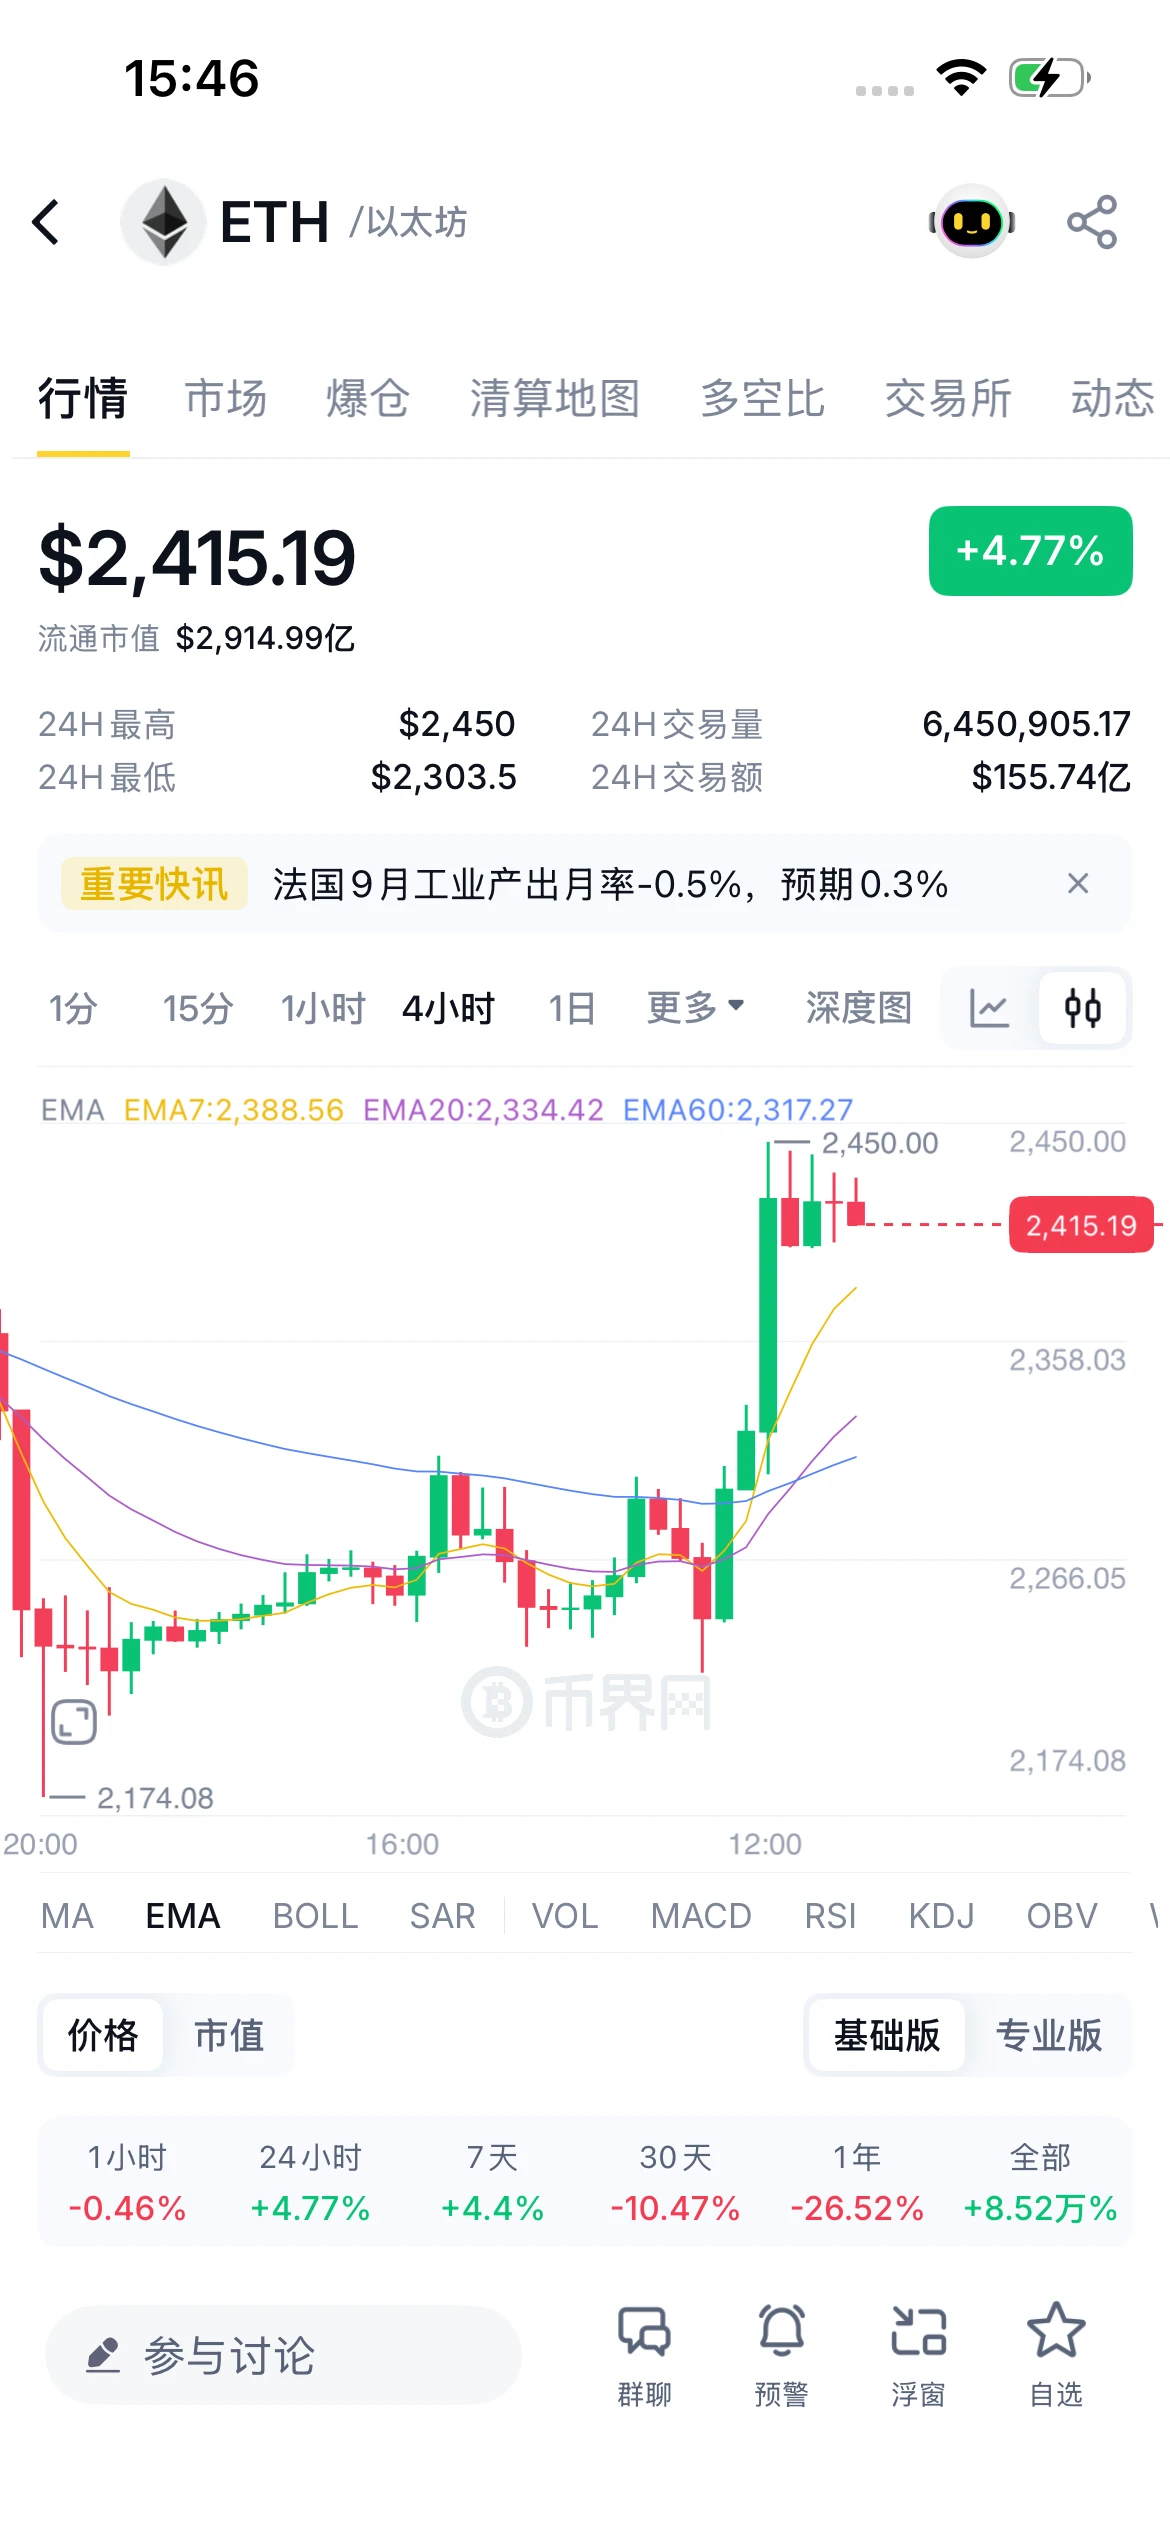
Firmly hold the ETH long. After the strong bullish candle, the EMAs are in bullish alignment. As long as the pullback holds above 2388, it is building momentum for a push to 2450; a break above the previous high could accelerate the move.
Market: After bottoming at 2174.08 on the 4H chart, ETH rebounded strongly and is now at 2415.19 (intraday +4.77%). It has moved above EMA7(2388.56)/EMA20(2334.42)/EMA60(2317.27), forming a bullish structure and building momentum as it approaches the 24H high of 2450. The 1-hour decline of -0.46% is a minor pullback at the highs and a healt
post-image
ETH-1.26%
Five-year USD
fixed deposit at 5.85%
Principal and interest guaranteed
post-image
Today’s Market Data Review
BTC is now holding steady around 80,600, and the sharp V-shaped rebound from 75,700 was indeed strong. Looking at the data, ETFs saw another net inflow of about 74.5 million yesterday, bringing cumulative inflows to over 56 billion. Long-term investors are still buying.
Exchange reserves on-chain have fallen to 2.84 million coins, with clear net outflows. Coins are still moving into cold wallets, so selling pressure is not too heavy. Glassnode shows futures volume (131 billion) far exceeding spot volume (21 billion), signaling intense battles between bulls and bears,
post-image
Business
Largest Company end of November 2026?
Apple
64%1.56x
Tesla
50%2.00x
$22.7K 24H+9 more
BTC+2.93%
Market Analysis: VVV/USDT Intraday Technical Update
$VVV ‌
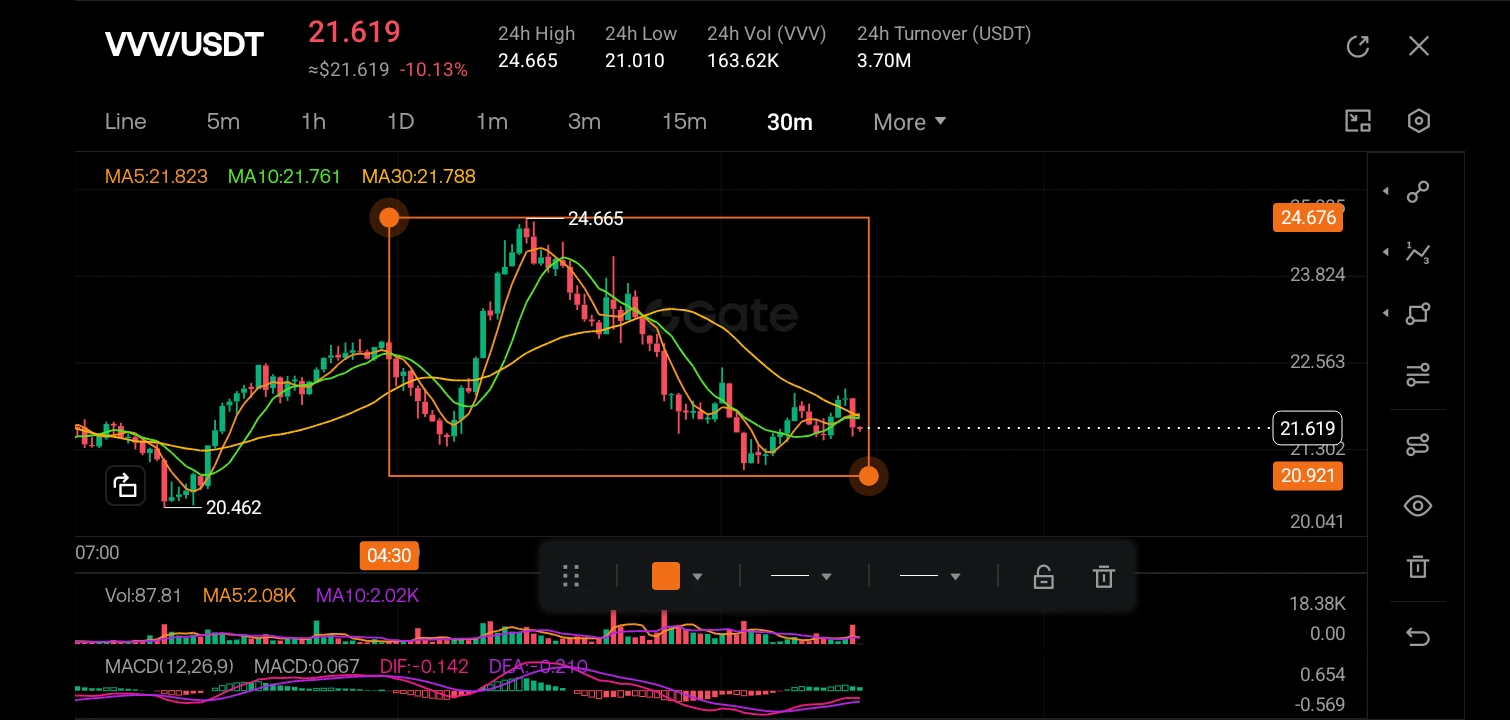
VVV/USDT is currently trading at 21.619 USDT, reflecting a 24-hour decline of 10.13%. The asset has established a narrow daily range, with a 24-hour high of 24.665 and a low of 21.010. Volume metrics indicate a 24-hour turnover of 3.70M USDT across 163.62K VVV, suggesting moderate liquidity as the market digests recent volatility.
Trend and Moving Averages.
Reviewing the 30-minute chart, the immediate short-term bias remains corrective. The price action is currently compressing beneath the primary moving averages. Specifically, the MA
post-image
VVV+0.37%
  • 9
  • 2
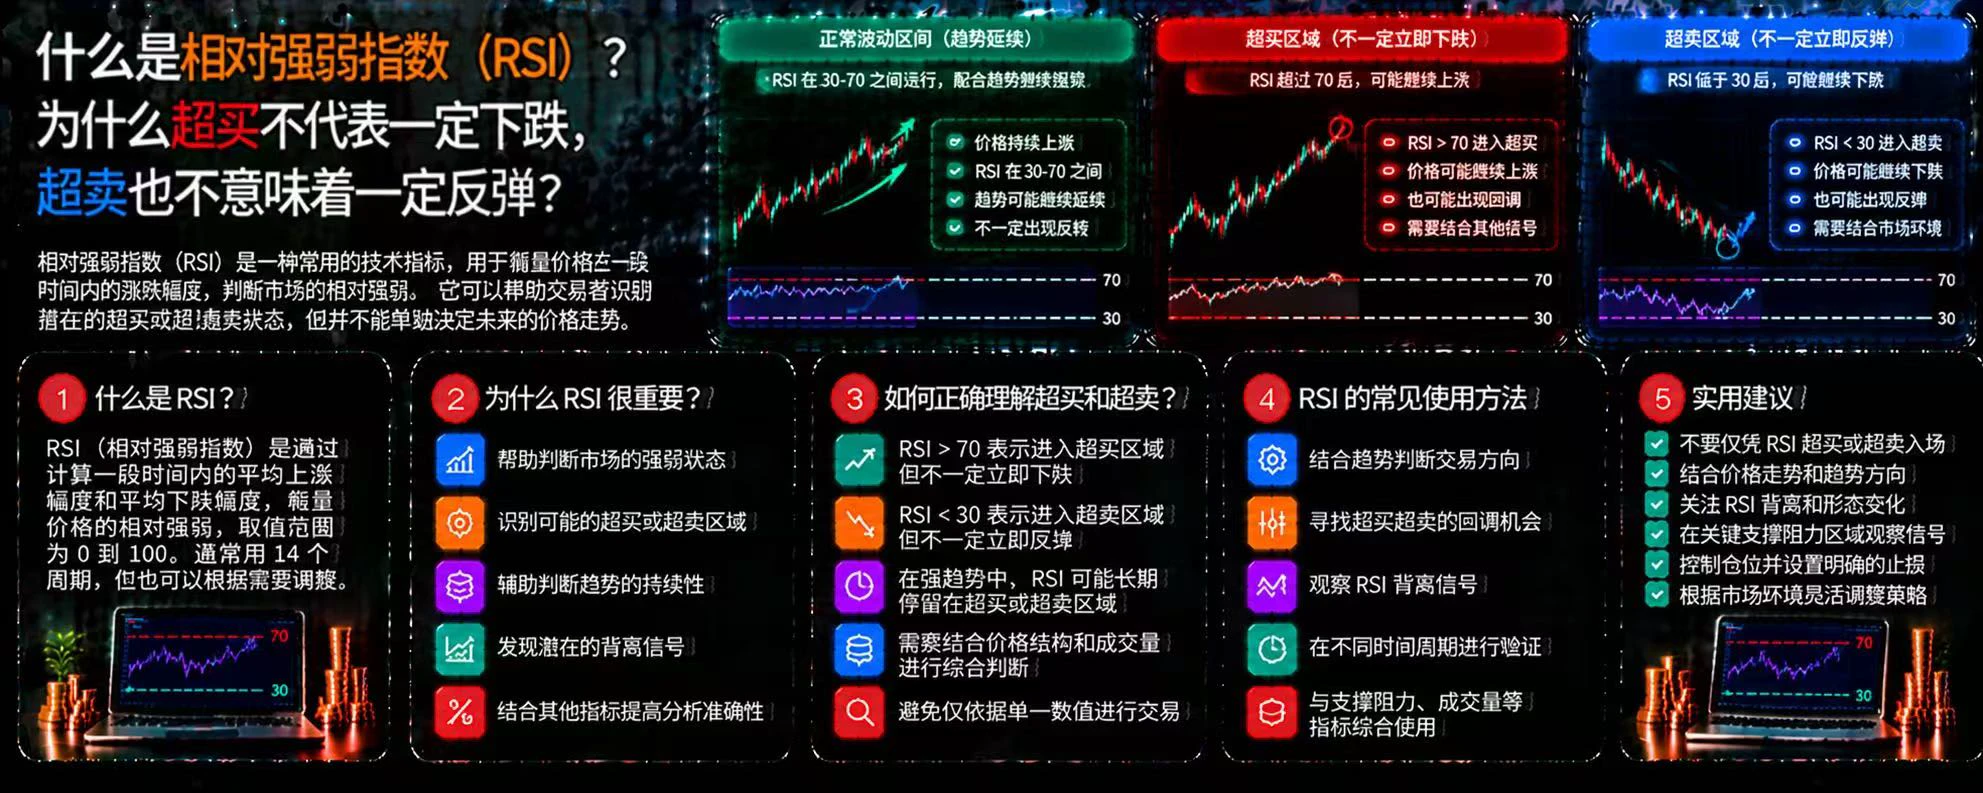
What Is the Relative Strength Index (RSI)? Why Doesn’t Overbought Mean It Will Definitely Fall, or Oversold Mean It Will Definitely Bounce?
In cryptocurrency trading, RSI is a common technical analysis indicator that can help traders observe price momentum. But many people see RSI rise above 70 and immediately go short, or fall below 30 and rush to buy the dip, only to see the opposite of what they expected. The problem is that the indicator reflects market conditions, not an inevitable price reversal.
First, what is RSI?
The Relative Strength Index (RSI) typically ranges from 0 to 100 and mea
post-image
📡 Signal Card | Source: BlockchainBaller
Asset: $AIN Short position | Time: Not specified | Entry: 0.275 | Stop loss: 0.295 | Targets: 0.265 / 0.2602 / 0.245
Funny enough, I reposted this person's $UAI trade earlier today, and here they are again—quite active 👀
I just repost signals; the signal is someone else's, but the wallet is your own. Whether to follow and how small a position to take is up to you all 🫠
For personal record-sharing only; this is not investment advice. #AI Giant Financing Watch: Microsoft and Meta issue a combined $40 billion in bonds.
AIN+3.85%
UAI-7.58%
MSFT+6.76%
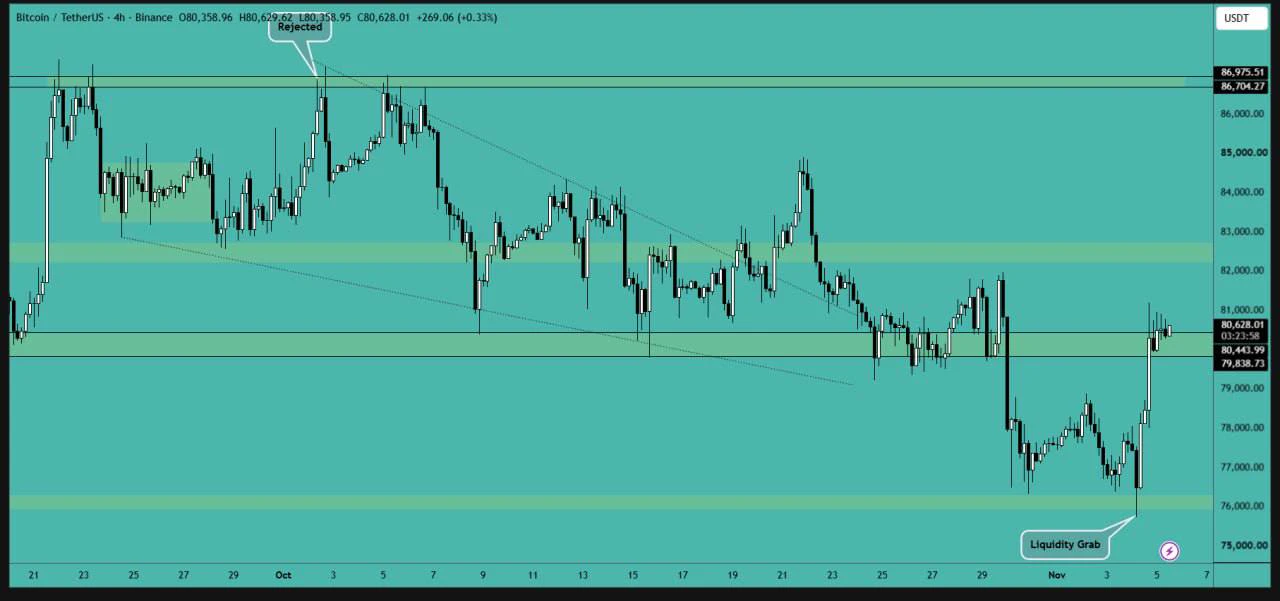
Bitcoin bounced after testing the liquidity and is now testing the resistance area. A close above this resistance zone will lead to more upward movement in the market.
$BTC ‌#BTCBackAbove80K #ShareWeekly
post-image
BTC-0.67%
$BTC $ETH As the market has moved so far
there are still some signs of a general downturn
my friend has managed to hold on
At the worst point, the unrealized loss was around 8000
now it’s down to 5000
Let’s see if they can turn a profit later or take only a small loss
that’s better than the current momentum continuing to carry it downward
It should be able to test the one-hour support level
That’s why I told my friend to hold on too
#非农就业数据
post-image
BTC-0.67%
ETH-1.23%
Put your emotions on silent mode and focus on making money. Money may not be everything, but it can solve most of life's problems.
There's no need to envy other people's lives. Quietly build yourself up and earn well. Having savings gives you the courage to face life's challenges.$BTC $ETH $GT
post-image
BTC-0.65%
ETH-1.23%
GT-2.24%
🔹Chip Stocks Are Falling, but Demand Hasnt Weakened? With Democratic Regulatory Expectations Shakin
live-cover
LIVE1,758
Gate Square Stock Talk Season: Share Your Views, Win GT and Stock Rewards https://www.gate.com/campaigns/6898?ref=VLARBF1YAG&ref_type=132
post-image
GT-2.41%
How's that? Those who missed the move can kick themselves
November 5, 2026
I. Positions / Intraday Plan
The hammer has landed, the other shoe has dropped—we've enjoyed the gains and captured the whole move
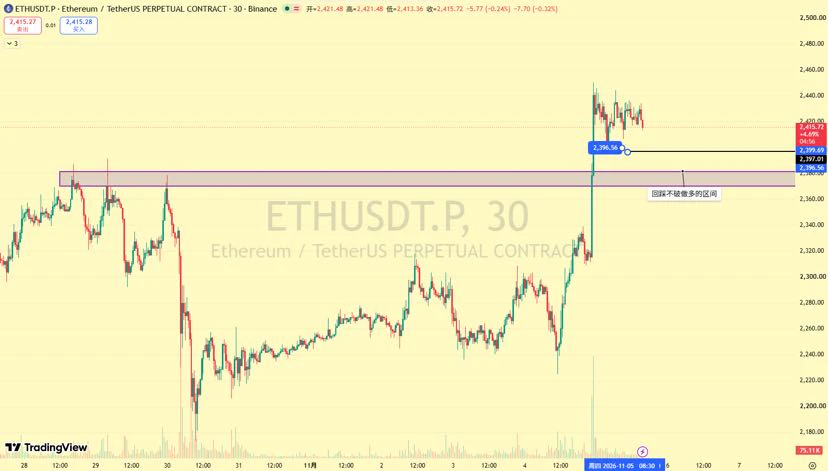
$ETH Today’s intraday plan: Continue to favor buying dips, with shorting rallies as a secondary strategy
1. The major target of 2434-50 mentioned last night was touched, and price paused for sideways consolidation
Long|2396 and the 2379-70 range; go long after a bullish candle appears
Short|Consider shorting at 2493 if an hourly bearish engulfing pattern forms
Buy dips, buy dips, buy dips—i
post-image
ETH-1.26%
#BREAKING:
Institutional buying is heating up....
BlackRock and other Bitcoin ETFs have purchased $74.57 million worth of BTC and $53.02 million worth of ETH, signaling strong institutional interest in the crypto market.
post-image
BLK+5.46%
BTC-0.67%
ETH-1.26%
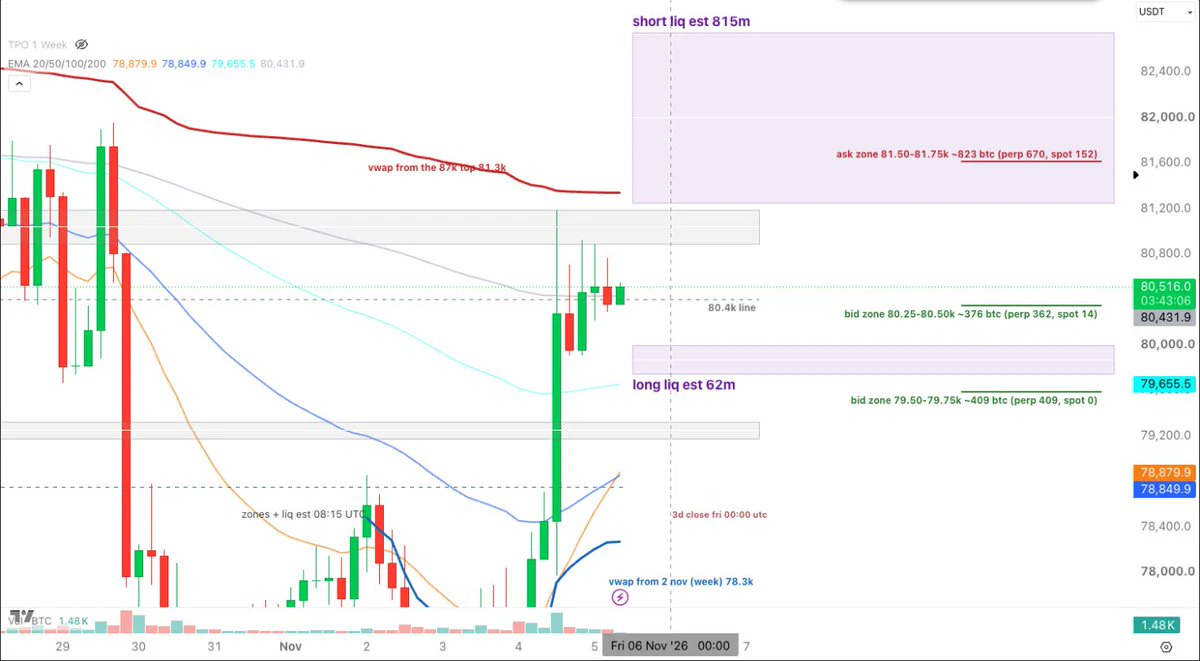
shorts getting comfy again but i dont think they’re safe, squeeze can continue and that 82k shelf is full of their liqs , looks juicy bitcoin:native
post-image
BTC-0.65%
Got a gift from my wife: a Logitech K98M Plus, my second keyboard this year.
The catch is, I paid off another 10k on her credit card.
So does that mean I bought it or she did?😂
  • 6
  • 2
$ETH
U.S. Treasury yields fall to 4.845%
Is the flow of U.S. capital changing?
Holy shit, is this hugely bullish?
Can BTC benefit from the liquidity tailwind this time?
Holy shit
Guys
Another signal worth watching has emerged in U.S. financial markets
The U.S. 10-year Treasury yield has fallen to around 4.845%
Markets are starting to reassess their expectations for the U.S. economy, inflation, and Fed policy
First, let's explain
Why is the 10-year Treasury yield so important?
It can be thought of as a pricing yardstick for global financial markets
U.S. Treasuries are considered an important b
post-image
ETH-1.23%
Load More

Join 40 M users in our growing community

⚡️ Join 40 M users in the crypto craze discussion

💬 Engage with your favorite top creators

👍 See what interests you

Trending Topics

GateLaunchesPoSECProofOfSecurity

543 Views455 Discussing

Gate has officially launched Proof of Security, or PoSEC, extending beyond Proof of Reserves by disclosing the distribution of cold-storage and hot-wallet assets and introducing a cold storage coverage ratio to measure protection under extreme-risk scenarios. Gate’s latest cold storage coverage ratio stands at 104.58%, with 88.26% of assets in cold storage and 11.74% in hot wallets. A coverage ratio of at least 100% means cold-storage assets alone would still be sufficient to cover all user assets even if hot-wallet assets were fully lost. Exchange security is not only about whether reserves are sufficient, but also how assets are stored and protected under extreme conditions. Could cold storage coverage become a new industry standard?[👉 Learn more](https://gate.com/proof-of-security)

BTCBackAbove80K

51.64k Views41.29k Discussing

DemocratsWinBothChambers

20.49k Views461 Discussing

View More