




Square
Following
Hot
News
Profile
Share your thoughts
placeholder
Article
GM!
I took another look at the @termix_ai Points page and found an easily overlooked detail.
Many people assume that once an order is settled, the points will be safely credited, but there is actually a key rule hidden here.
The official rules clearly state that if the Client and Provider use the same address or belong to the same primary account, the interaction will be deemed sybil activity. Neither party will receive points, and even if the points have already been credited, the platform may claw them back later.
This design is quite interesting.
Settlement and points distribution are essen
post-image
U.S.-Iran deadlock calls for cautious dip-buying; long-term short targets reached! October 9 BTC/ETH outlook
Three U.S. aircraft carriers are expected to gather in the Middle East over the next few weeks, and the Pentagon has drafted plans to strike Iran’s missiles, drones, and energy facilities. However, Trump said discussions between the U.S. and Iran are still making progress and that he does not currently plan to launch an attack before the November midterm elections. The long-term bearish outlook given at the beginning of the month played out as expected: in just one week, BTC fell by mor
post-image
ETH-4.18%
BTC-2.05%
  • 1
Layout: Bitcoin, Ethereum, Dogecoin
live-cover
LIVE880
  • 6
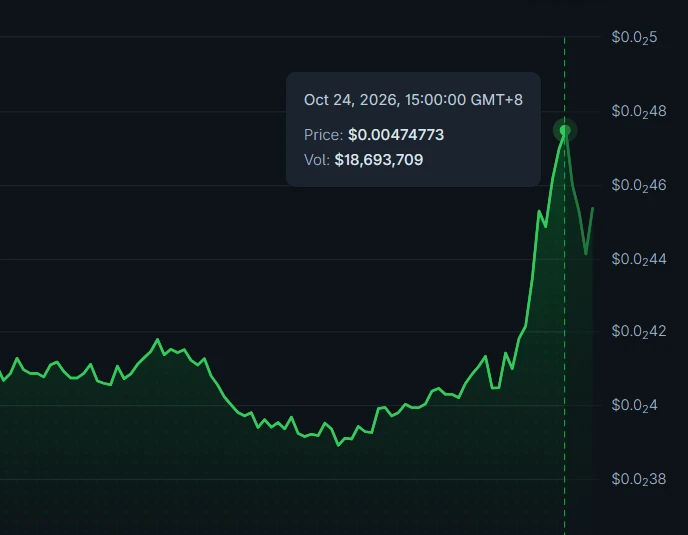
The most unusual detail in today's market is that $OGN posted a vertical +111.38% move over 24 hours amid mild sentiment, with the Fear & Greed Index at just 64 (Greed). At the broader market level, BTC has not seen an extreme surge, and sentiment has not reached Extreme Greed. This indicates that OGN was not lifted by a broad market-wide rally, but was instead an independently strong asset actively selected by capital during sector rotation.
Technically, $OGN is currently at 0.04828, above MA5=0.04819 and MA20=0.03791, with the moving averages arranged bullishly. The MACD histogram at +0.0006
post-image
OGN+86.19%
BTC-2.05%
DOGE-5.91%
Breaking 🚨Tom Lee claims: The current cryptocurrency rebound is the biggest bull market ever! 🚀As a co-founder of Fundstrat, Lee pointed out that price gains across most major tokens are unprecedented. Increased institutional inflows and the expansion of DeFi use cases are driving the momentum. Analysts warn that market volatility could surge sharply as speculative capital chases gains. 🔥Please stay tuned for further updates. $OG , $RLC , $OGN
.
post-image
OG-4.16%
RLC+24.09%
OGN+84.18%
How is this a rebound? This is CPR for my empty account, isn’t it? 😭

I opened the charts this morning: trading volume was low, price stalled at the highs, follow-through was lacking, and every bounce to a key level got pushed back down. I said at the time: don’t chase longs; look for pullbacks on short positions. Some people didn’t believe me and said it could still surge, but every surge got slapped back down. While everyone else was shouting breakout, all I saw was volume shrinking as if its courage had been drained.

$PAID / PAID slid from 0.012918 to 0.004651, and the short returned +6
post-image
PAID-15.20%
SOL-6.51%
SNDK-5.16%
BTC Scumbag Watch
Haven’t updated on Bitcoin for many days
No more talk—let’s look at the chart
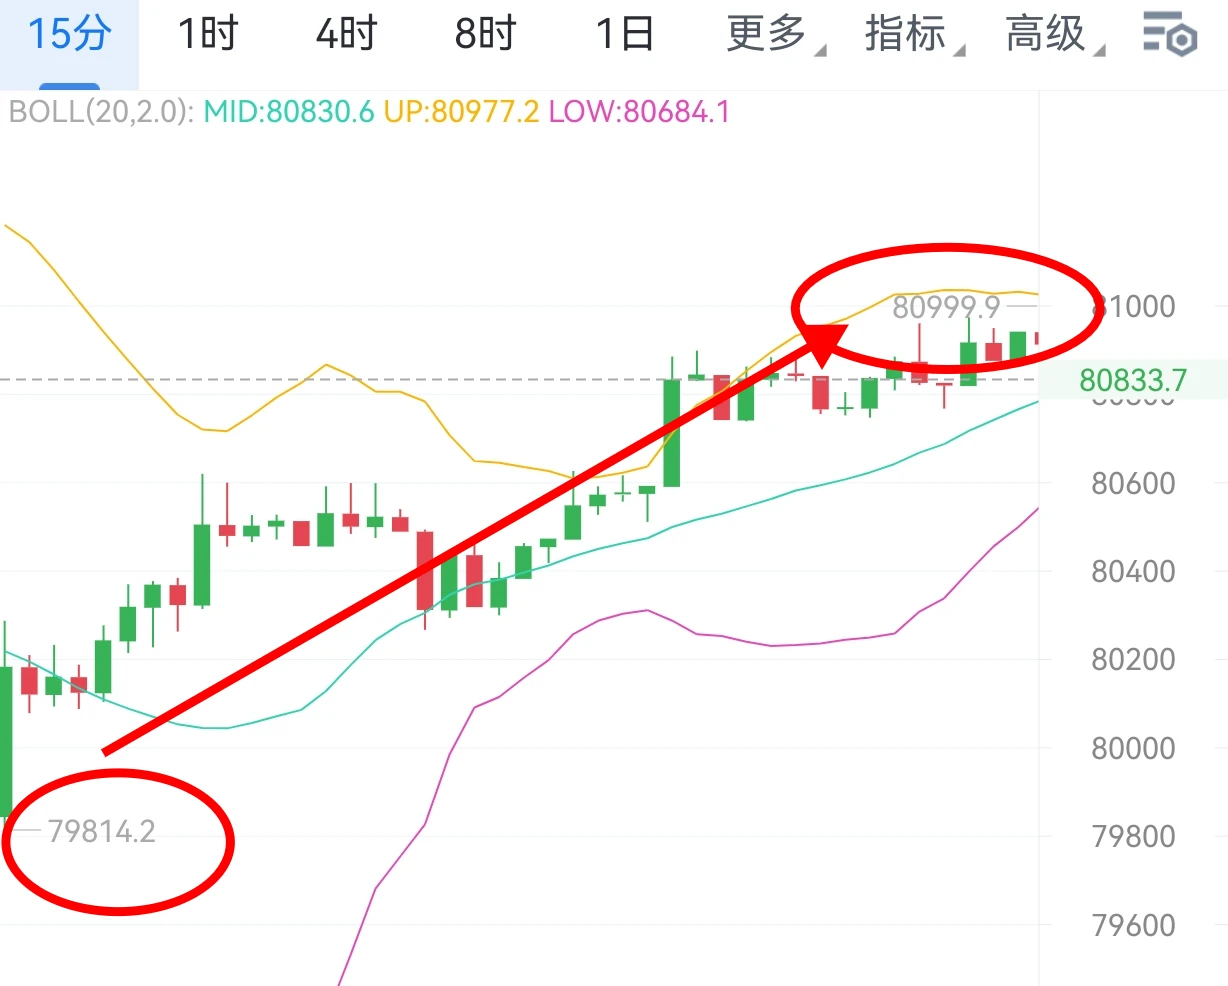
Early this morning, Bitcoin broke through the range created by the large bullish candle on September 21; it has now recovered slightly.
Judging from the liquidation chart, that wick point yesterday
The scumbag will probably open a position at 78,888, which is basically also the 50% level of the large bullish candle on September 18. A lucky number, hahaha.
post-image
BTC-2.02%
$ETH maybe from here to Valhalla
Or maybe I’m just shit out of luck
post-image
ETH-4.18%
I'm bullish on $XRP . There is no need to panic.
Yes, put the bucket down. The market is having a pullback before the crypto rise in October. XRP price is down, but the trading volume is up over 32 percent for the day. Over 300 million in liquidated crypto bets have gone in the last 22 to 25 hours.
The crypto market is battling that right now. However, for XRP, things are moving just fine. The building behind the scenes is getting ready to finish 2026 very strong. The community is still adding more.
Big companies are also adding more. The market cap is 83 billion. But a 100 billion market cap s
post-image
XRP-2.82%
$MU /USDT is quietly building a trap that most traders will miss entirely.

$MU /USDT - SHORT

Trade Plan:
Entry: 1036.44 – 1041.20
SL: 1061.64
TP1: 1021.70
TP2: 1010.29
TP3: 993.17

Why this setup?
Why now? The 1h price is sitting at 1038.82 inside a tight entry zone between 1036.44 and 1041.20, which means the market is coiling right at the edge of a decision. The 15m RSI at 38.74 confirms short-term momentum is already fading without yet being oversold, so the move is likely to continue rather than reverse. The 1h ATR of 9.510169 tells us each candle carries enough volatility to push thr
MU-4.75%
The Loser Subsidy Theory|The Aspiring Loser Theory
“The most absurd thing about society is that the harder many losers try to escape failure, the more they end up supporting those who have already succeeded.”
Recently, I have been thinking about a social phenomenon: Why are so many people desperately pursuing success, while those who actually achieve upward mobility remain a minority? More worth studying is the fact that many people not only fail to succeed, but also lose substantial amounts of wealth, time, and energy in the process of pursuing success. Yet the commercial systems built around
post-image
morning update
live-cover
LIVE1,932
New DTT Journal is live. It automates 98% of the journaling processes. It works in combination with DTT chrome app and DTT charts. Also new DTT chrome app update is available for download inside of whop. I’ll make a new full walkthrough video soon covering how to use everything, it’s 1 streamline process.
  • 1
I just opened a buy order $CT
. Entry now: buy at 0.31500 or 0.31200; first target 0.32500, second 0.3400, third 0.3500, final target 0.3600-+; stop-loss set below 0.2900.
post-image
CT-15.86%
Robinhood Adds $25M Bitcoin to Corporate Balance Sheet
Robinhood has made its first corporate Bitcoin purchase, adding $25 million in BTC to its balance sheet and deepening the company’s involvement in the crypto market.
The transaction was revealed by Johann Kerbrat, Robinhood’s head of crypto, during an interview at the Digital Asset Summit Asia. Unlike crypto assets held on behalf of customers, the Bitcoin acquired in this trade is owned by Robinhood itself.
⚠️ Personal market analysis only. NFA — manage risk and DYOR.
Educational content, not investment advice or a recommendation to buy, s
post-image
HOOD-2.29%
BTC-2.05%
$ZRO ’s lower levels are starting to attract attention, but perceived cheapness can never replace evidence of a bottom.
I’m watching just one divergence: whether buying support remains after a breakout above 2.273. The current price is 1.972, with volume at 0.27x. The 1-hour and 4-hour charts are both weak, with RSI at 40 and 26, respectively.
If volume continues to expand after breaking above 2.273, the initiative will favor the bulls; if 1.92 breaks and fails to be reclaimed, the short-term view is invalidated, and the next level to watch shifts to 1.896.
Don’t rush to guess the endpoint; fi
post-image
ZRO-11.36%
$NEAR Current price is 4.51, down 15.46% over 24h, with trading volume surging to 304 million USDT. On the moving-average front, MA5=4.5278 has crossed below MA20=4.877, with a bearish alignment initially forming; RSI=32.3 is approaching the oversold zone, while the MACD histogram at -0.03631 remains negative, indicating momentum is still controlled by the bears. The key is the funding rate of -0.0052%—the negative rate means shorts are paying to hold positions. Although longs are being squeezed, there is not yet an extreme discount, indicating strong but not irrational bearish sentiment. The
post-image
HYPE-4.90%
$SOL
Seeing this price action, I’m laughing so hard it looks worse than crying😅 But don’t panic—the on-chain data is still holding up; it’s just a shakeout. Once this wave of panic passes, SOL can still bounce back to new highs. Hold tight, don’t get shaken out—the real show is just beginning🚀
post-image
SOL-6.53%
The Federal Reserve's September meeting minutes were released on October 7, and the market's interpretation of them has been far from straightforward. All nineteen officials supported the quarter-point hike that lifted the benchmark rate to 3.75%–4.00%, and most participants believed another increase by year-end could be appropriate. Yet within days, the implied probability of a hike at the October 27–28 meeting fell below 20%, down from roughly 70% in the period immediately after the September decision. That gap between the minutes' language and the market's pricing is the central fact shapin
post-image
User_any
When the Federal Reserve released the minutes from its September meeting, the immediate reading was that the central bank was still leaning toward tightening. All nineteen officials supported the quarter-point hike that lifted the benchmark rate to 3.75%–4.00%, and most participants believed another increase by year-end could be appropriate. Yet the market’s response over the following days told a different story. The odds of a hike at the October 27–28 meeting have fallen to roughly 17%–20%, down from nearly 70% in the days right after the September decision. That gap between what the minutes said and what traders are pricing is the central tension in the market right now.
Part of the explanation lies in the language the minutes used. While most officials saw another hike as potentially appropriate, the document also stressed that decisions would remain data-dependent and gave no indication that October was the intended venue. The phrasing “by year-end” rather than “at the next meeting” left room for interpretation, and the market chose to read it as a signal that the Fed is in no rush. Officials have reinforced that view in public remarks since the meeting. Fed Governor Christopher Waller said this week that further rate hikes are needed, but he also noted that the labor market is cooling and that the central bank can afford to be patient. That combination—a willingness to tighten, but without urgency—has kept October hike odds low.
The data that has come in since the September meeting has supported the patient approach. The August PCE price index, the Fed’s preferred inflation gauge, rose 3.4% year over year, below the 3.7% consensus estimate, while core PCE came in at 3.0%. The September jobs report, released on October 2, showed the economy added just 29,000 jobs, far below expectations, with the unemployment rate ticking up to 4.2%. Softer inflation and a cooling labor market give the Fed room to hold rates steady at the October meeting without risking a surge in price pressures. The market has interpreted that combination as reducing the case for an immediate hike.
That brings us to the October 14 CPI report, which is now the single most important data point on the calendar before the Fed meets. Forecasts point to headline inflation rising to around 3.6%–3.7% year over year, up from 3.4% in August. Core CPI, which strips out food and energy, will draw the most attention because it is a better gauge of underlying price pressures. If core CPI comes in at 0.3% month over month or higher, the case for an October hike will resurface, and the odds could climb back toward 40%–50%. A softer reading, closer to 0.2%, would confirm that inflation is continuing to cool and would likely keep October hike odds where they are—or push them lower still.
So how would a hotter-than-expected CPI print affect the Fed’s decision? The minutes already noted that inflation risks are skewed to the upside, with some participants concerned that energy prices and the AI buildout could keep price pressures elevated. A hot CPI reading would validate those concerns and give the hawks on the committee a stronger argument for acting in October rather than waiting until December. But it is worth remembering that the Fed has repeatedly emphasized its data-dependent approach. One inflation report alone is unlikely to force a hike if the broader trend still points toward gradual cooling. The bar for an October move is high, and it would likely take a combination of hot inflation and resilient jobs data to clear it.
For crypto and U.S. stocks, the transmission channel runs through rate expectations and the dollar. When hike odds fall, the opportunity cost of holding risk assets declines, which tends to support prices. Crypto investment products recorded $3.55 billion in inflows in the week after the September hike, the largest weekly figure of 2026, showing how sensitive digital asset flows are to the rate outlook. But the relationship is not one-directional. The 10-year Treasury yield is holding near 5.28%, and the 30-year is near 5.63%, both at multi-decade highs. Those elevated yields continue to weigh on valuations, particularly for high-growth sectors that depend on discounted future earnings. A softer CPI print would ease that pressure by reducing the probability of further tightening. A hotter print would do the opposite.
Is the current outlook already priced in? Largely, yes—but not entirely. The market has priced a pause for October and a hike for December, with December odds around 70%. Those expectations are reflected in current asset prices. What is not fully priced is the possibility of a meaningful surprise in the CPI data. If the report comes in significantly above or below expectations, the repricing could be sharp, because so much of the market’s positioning is built around the assumption that the Fed will hold in October. A hot print would force traders to reconsider that assumption, and the adjustment could ripple across bonds, currencies, equities, and crypto simultaneously.
My own view is that the Fed is unlikely to hike in October unless the CPI report delivers a genuine upside surprise. The labor market is cooling, inflation is trending in the right direction, and the committee has signaled that it sees no urgency to act. The December meeting remains the more likely venue for the next move, if there is one at all. But the October 14 CPI release is the variable that could change that calculus. Until it lands, the market is operating on incomplete information, and the gap between the hawkish minutes and the dovish pricing will remain unresolved.
This article is not investment advice. Analysis is based on publicly available information and does not guarantee future outcomes.
$BTC $ETH $GT
#ShareWeekly #FedSeptemberMinutesLeanHawkis
BTC-2.05%
ETH-4.18%
GT-2.36%
NVDA-2.86%
SNDK-4.91%
  • 1
  • 1
$BTC
The long-short ratio is almost two to one, and long accounts are packed in like the subway during rush hour. But while funds rush in, they also exit just as quickly—faster than a sudden change of heart. Keeping an eye on the rhythm is more practical than guessing the direction. Whether to buy is up to you; I’ll just sit on the sidelines and watch the show 😏
post-image
BTC-2.02%
Load More

Join 40 M users in our growing community

⚡️ Join 40 M users in the crypto craze discussion

💬 Engage with your favorite top creators

👍 See what interests you

Trending Topics

Gate Money Officially Launches

3.46k Views12.88k Discussing

Gate officially launches Gate Money, a global integrated financial services app that brings digital assets, fiat, stocks, ETFs, gold, bank accounts, and payments into one Gate App. Users can manage assets, invest, send and receive funds, convert currencies, and make payments — all from a single account. Which use case are you most excited about? [👉 Learn more](https://www.gate.com/announcements/article/102094)

Fed September Minutes Lean Hawkish

64.17k Views2.73k Discussing

Samsung Q3 Operating Profit Surges 782.5%

36.94k Views1.93k Discussing

View More