
Square
Following
Hot
News
Profile
Share your thoughts
placeholder
Article
Zero Hunters Crypto Lounge 🎯 | Historical Bangla Adda
live-cover
LIVE990
$ZEC short fighting a fresh bullish reversal.
Pair: $ZEC /USDT
Direction: SHORT
Entry: 1135.67
TP1: 1090.48 +4.0%
TP2: 1060.36 +6.6%
SL: 1195.92
- Steady decline from ~1280 through all three MAs, into a sharp final push down, now a strong green reversal candle
- RSI snapped from ~20s to ~55-58 one of the sharpest recoveries of the week
- MACD still negative overall, but the last bar just flipped green fresh cross, same timing as CRCL/ZEC-last-week
$ZEC ‌
ZEC+7.75%
Does a bullish moving-average alignment always mean you should chase long positions?
Not necessarily. The key is whether the price’s position relative to the moving averages is synchronized with momentum. Take $ZEC as an example: the current price is 1235.97, with MA5=1225.24 above MA20=1138.62, forming a standard bullish alignment and indicating a healthy trend direction; however, RSI has reached 70.2, nearing overbought territory, while the price is hugging the Bollinger upper band at 1248.36, making the risk-reward of chasing short-term highs unattractive. A reusable approach is: use movin
post-image
ZEC+7.81%
XPL+8.96%
INJ+11.40%
BREAKING: TSMC posts a record quarter as Nvidia, Apple, Broadcom and AMD compete fiercely for its wafer capacity.
TSM-1.82%
NVDA-1.92%
AAPL-0.31%
AVGO-0.64%
AMD-1.47%
$CRV Current price is 0.3598, with the upper Bollinger Band at 0.3671 serving as the first resistance level; MA5 at 0.3590 and MA20 at 0.3435 form the short-term support zone. Up over 10% in 24h, the price is now tracking along the upper Bollinger Band, while RSI at 67.1 is nearing the overbought zone. The MACD histogram at +0.002132 remains bullish, but the funding rate at +0.0100% indicates that longs are paying to hold positions, with leveraged long overcrowding increasing and the risk of wick-driven liquidations accumulating accordingly. Trading volume is only 8.4M USDT, so liquidity is n
post-image
CRV+10.77%
BAT+25.54%
XRP+1.33%
This was 2 SOL, was it worth it?
SOL+1.92%
Market update
live-cover
LIVE262
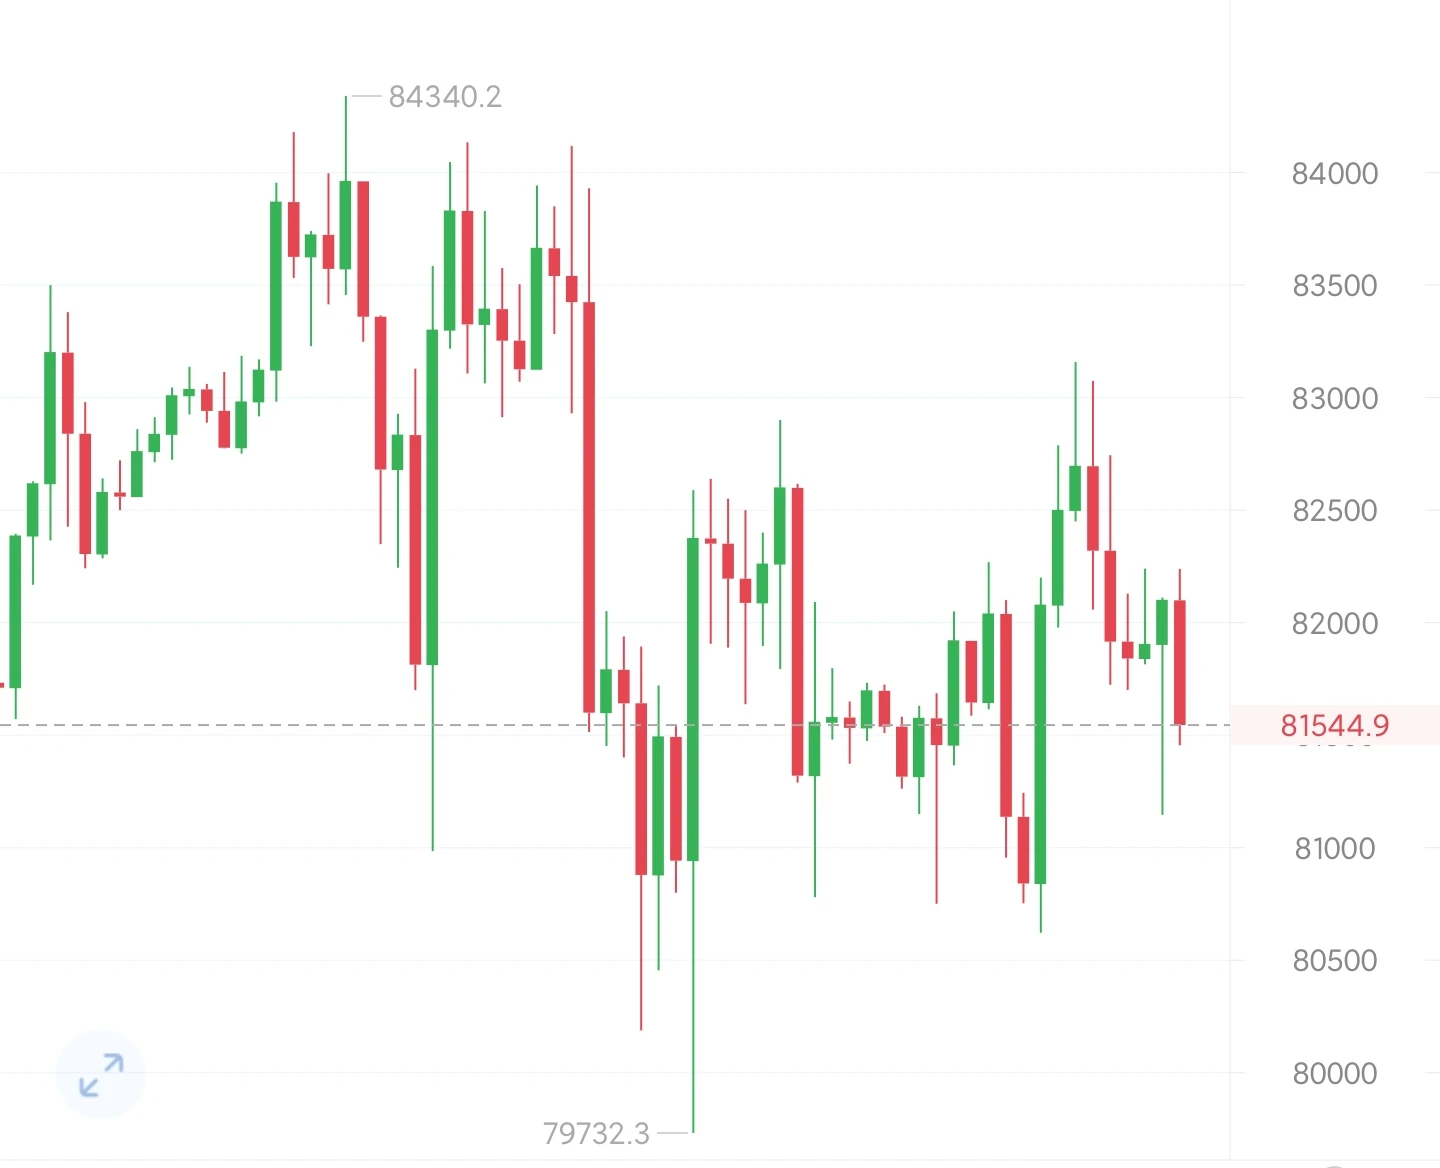
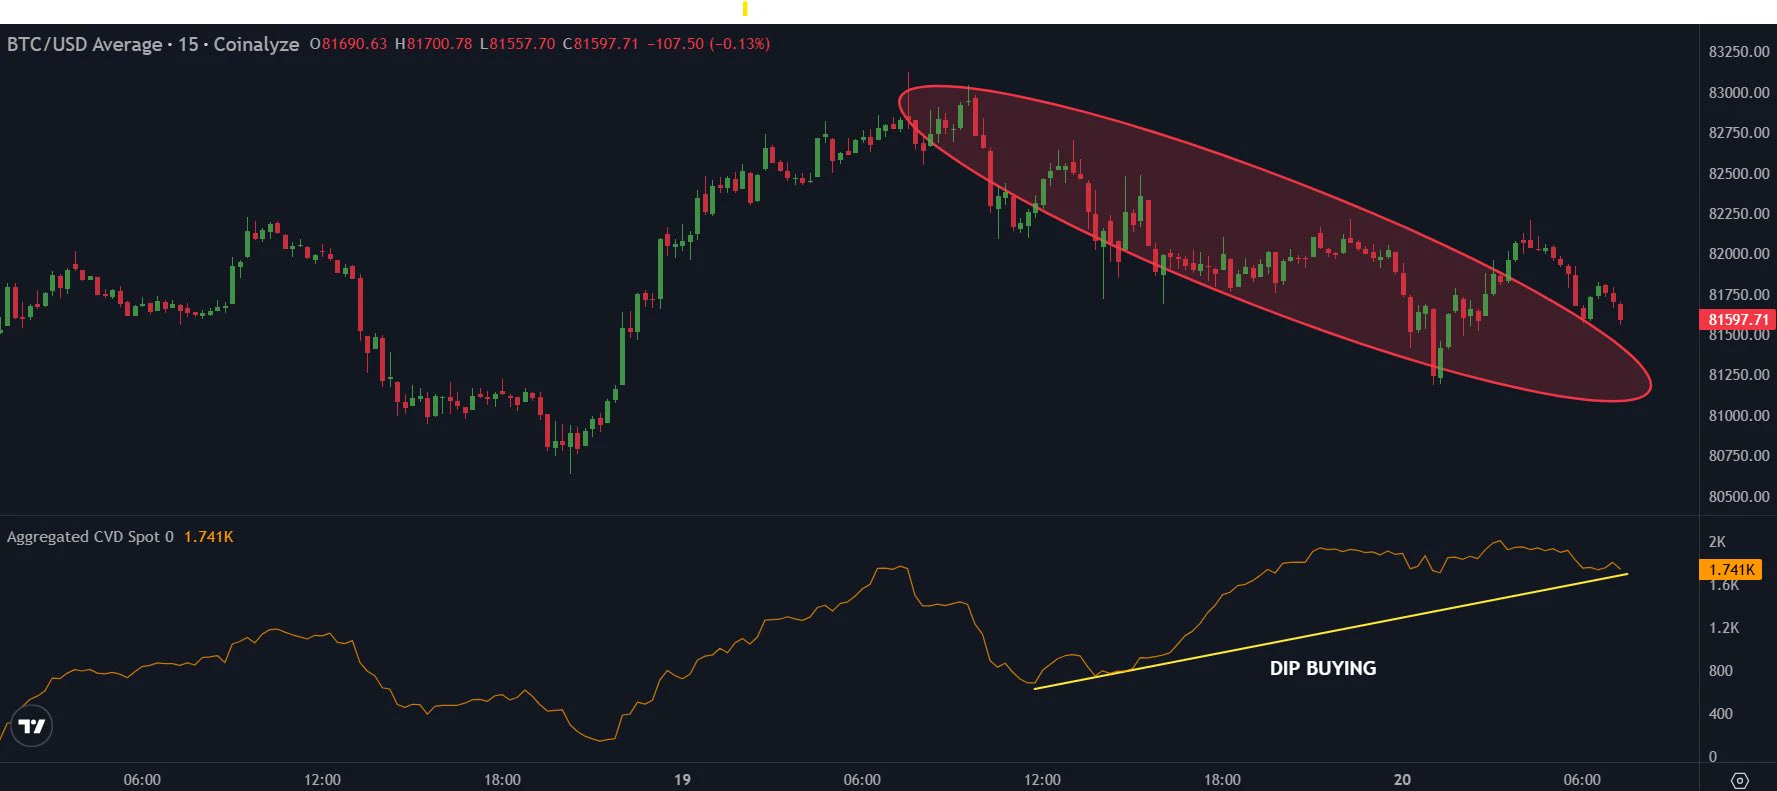
Bitcoin $BTC did not break out and then fall back at the previous highs; if you don't understand, today's break below and reclaim is the same when viewed in reverse.
BTC+0.60%
#晒出我的持仓收益#A group of friends huddling together for warmth—welcome, friend.
post-image
$ACU is showing some life 👀🔥
After that sharp move to $0.11049, ACU is holding around $0.0995, with buyers still trying to keep the momentum alive.
MACD is looking bullish on the 1H chart, but $0.1005 is the level I’m watching next. A clean move above it could make things interesting.
Let’s see if the bulls can take control 👀
#ACU $ACU
post-image
ACU+5.48%
  • 5
  • 2
Everyone, listen‼️ Quickly open a second long position on $ETH
now.entry: $2,451 – $2,455targets: $2,465 / $2,480 / $2,500sl: $2,418
post-image
ETH+1.40%
At midday, we remained firmly bearish across the board. BTC rebounded to the 81700 resistance level but met resistance, ETH rebounded to 2390 but came under pressure, and ZEC rebounded to around 1120 but also faced resistance. Short positions were opened simultaneously. BTC’s target was below 80000, ETH’s around 2320, and ZEC’s around 1070. As the U.S. stock market opened, the market moved lower as expected, with prices continuing to fall. BTC hit a low of 79818, ETH pulled back to around 2320, and ZEC dipped to 1075. BTC captured 1300 points of room, ETH secured 40 points, and ZEC secured 40
BTC+0.59%
ETH+1.40%
Short-Selling Analysis of the Biggest Decliners: Real wealth is hidden in the red candlesEveryone is mesmerized by green candlesticks. Chasing pumps, chasing hot trends. But where is the real opportunity? It is right in front of you—in the red candles. Most people are too afraid to touch them. These four coins are weakening sharply. The market structure has already broken down. Sellers are fully in control. This is not a pullback, but a trend. Smart money positioned itself long ago. I have carefully examined every chart. No hype, just letting the charts speak. $TRUT
Risk level: HighEntry price
post-image
$UNI The most interesting thing right now is not guessing whether prices will rise or fall, but seeing who will be forced to change their stance first.
The bulls' test is at 7.634, while the bears' test is at 6.784. $UNI is currently at 7.416, up 4.32% in 24 hours. The 1-hour support is 6.784, resistance is 7.634, and current volume is 0.47 times the average volume of the past 20 or so candles.
I’ll first note that the $UNI price has already moved, but trading activity and volume have not caught up, because the direction can be trusted for now, while continuation cannot be assumed in advance;
post-image
UNI+4.71%
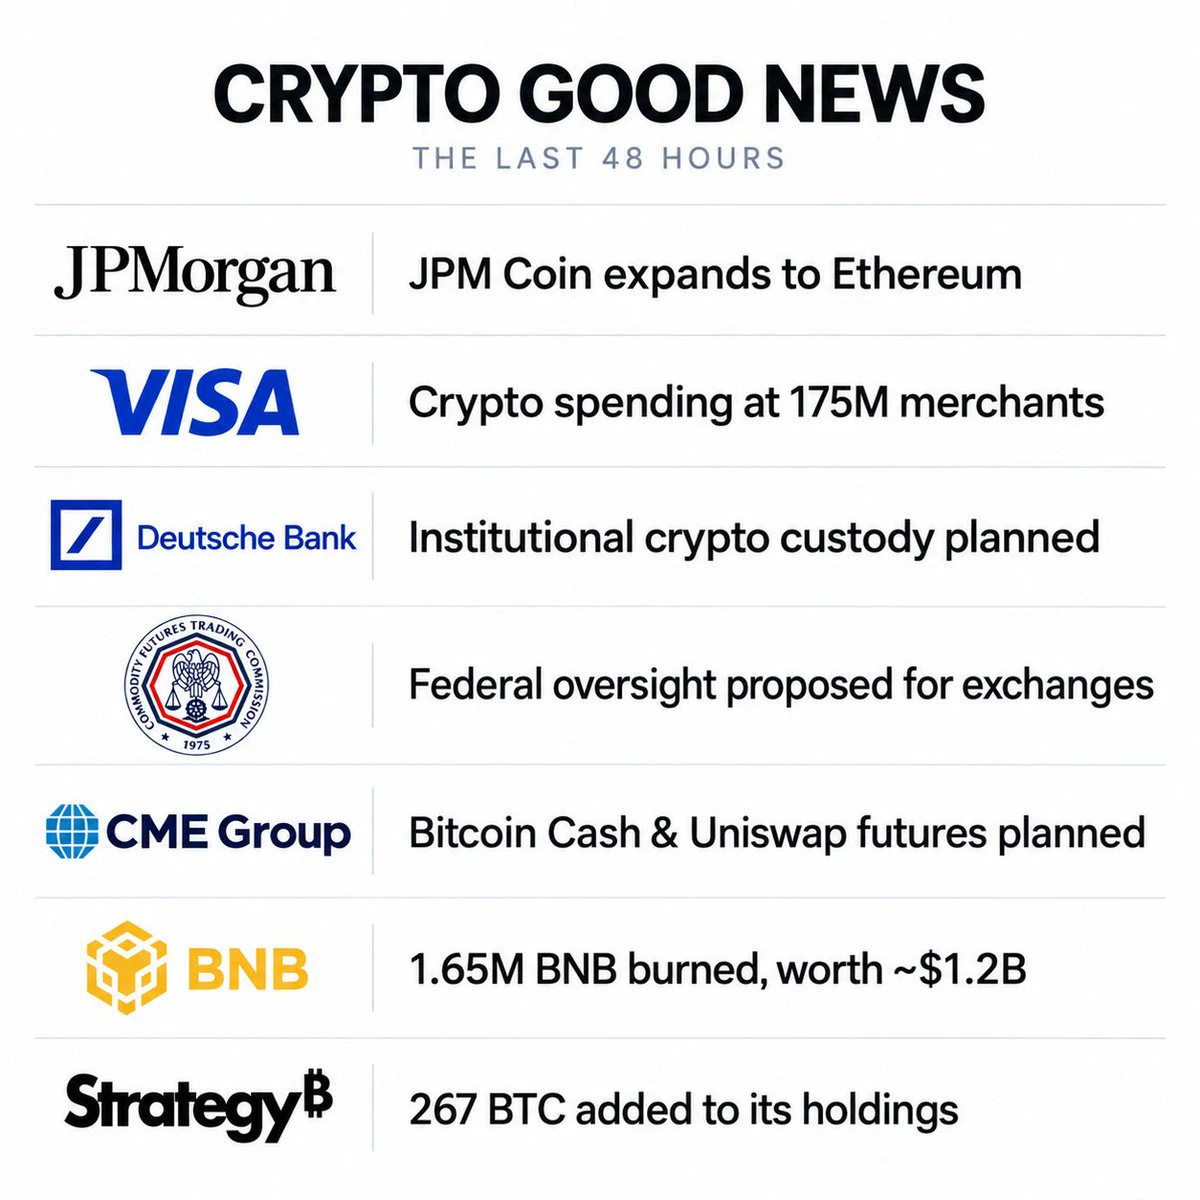
🚨 JUST IN: 🇺🇸 Video platform Rumble transfers 95 $BTC to institutional crypto custodian and OTC trading provider Anchorage Digital. 👀
Rumble reported holding 293 Bitcoin at the end of Q2.
BTC+0.60%
🧑‍🍳 I touch crazy to get something done…and we all become friends 🫢
Gold has climbed back above 4150, while silver is hovering around 57. The dollar has weakened, and Treasury yields have pulled back a bit too.
But don’t celebrate too soon. Oil prices are still rising, and inflation hasn’t gone anywhere. This rebound looks more like a breather than a turnaround.
What I’m watching is whether gold can hold above 4150 if oil surges again next week.
If you see it differently, tell me why.
post-image
GLDX+1.74%
PAXG+1.47%
JUST IN: 🚨 Billionaire real estate titan Grant Cardone just purchased $5,000,000 worth of Bitcoin.
His company now has almost 3,000 $BTC on its balance sheet.
BTC+0.60%
The second target has been reached at 0.03300. Keep your eyes on it and secure your profits. Congratulations! 🎉🤑💰👇$AKE
post-image
AKE+17.90%
Load More

Join 40 M users in our growing community

⚡️ Join 40 M users in the crypto craze discussion

💬 Engage with your favorite top creators

👍 See what interests you

Trending Topics

USSeptemberPPIBeatsExpectations

91.35k Views1.87k Discussing

US September PPI came in at 6.3% YoY, well above the 5.3% market expectation, pointing to renewed producer-side inflation pressure. Weekly jobless claims were 199K, broadly in line with forecasts. Could hotter inflation further reduce room for rate cuts, and what does it mean for $BTC, US stocks, and gold?

DrLinHanSpeaksAtOxfordUnion

135.63k Views1.86k Discussing

JapanAndKoreaStocksPlunge

47.27k Views1.76k Discussing

View More