
Square
Following
Hot
News
Notifications
Profile
Share your thoughts
placeholder
Article
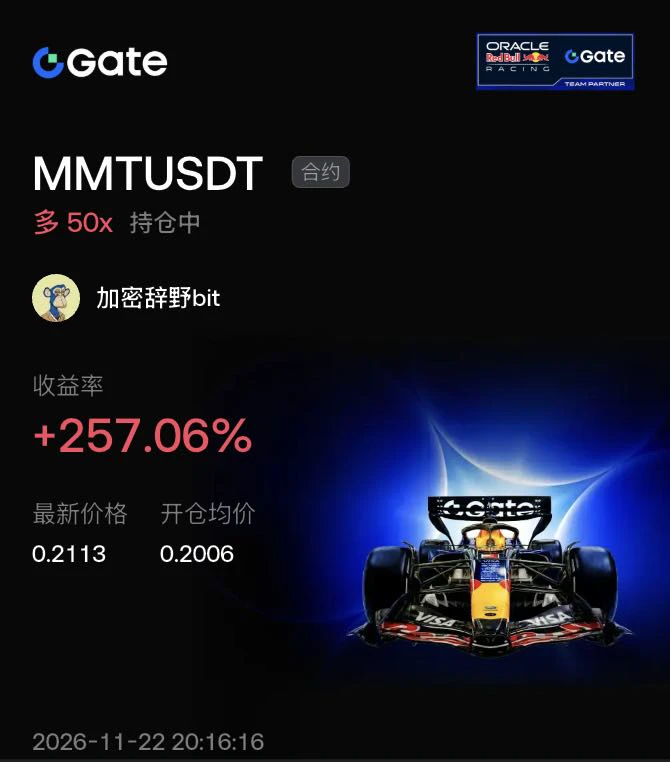
$MMT What goes up too much will fall, and what falls too much will naturally rise. Technical deviations from the moving averages eventually get corrected.

MMT’s previous sharp plunge sent the price completely away from the moving averages—a very extreme move. When it fell to around 0.19, such extreme oversold conditions were bound to trigger a short-covering rebound.

I went long at 0.2006 after seeing it stabilize and rebound, following the move on the right side. 50x leverage. After a crash like that, never try to pick the exact bottom. Waiting for a right-side signal to emerge before getti
post-image
MMT-2.35%
BTC-0.65%
  • 1
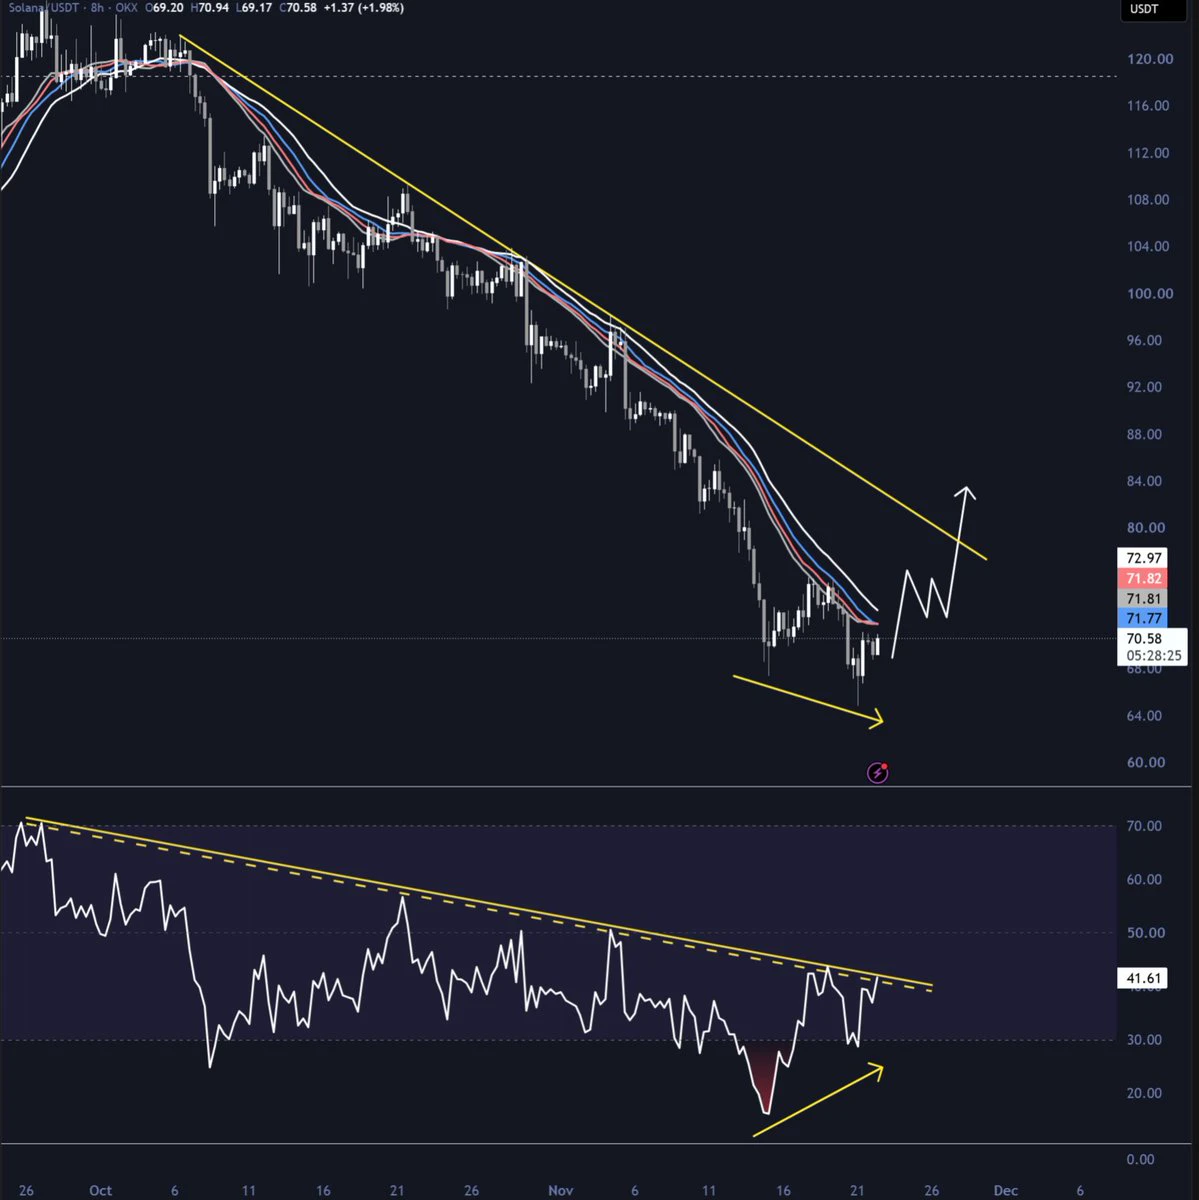
$SOL is very close to breaking out of its RSI downtrend
Remember, RSI breakout happens first and then price breakout follows
post-image
SOL-0.77%
Trenches
IDOL
I
bade
b
IDOL
0x3b...ab07
Market Cap
$.
Change
.
24h Vol
$.
Holders
.
JAGENT
J
bade
b
JAGENT
0x8e...ae15
Market Cap
$.
Change
.
24h Vol
$.
Holders
.
PIEVERSE
P
bade
b
PIEVERSE
0x0e...25a9
Market Cap
$.
Change
.
24h Vol
$.
Holders
.
CLAUDIA
C
bade
b
CLAUDIA
2j5S...W2ZM
Market Cap
$.
Change
.
24h Vol
$.
Holders
.
Singularity
S
bade
b
Singularity
7R4M...pump
Market Cap
$.
Change
.
24h Vol
$.
Holders
.
Short setup on the evening of 11/21; happily pocketed 2,200 points on BTC!
Was this photo taken well?🌇
post-image
X renowned trader mk4 closed out BTC short positions, capturing nearly $7,000 drop
live-cover
LIVE2,749
ETH-1.26%
BTC-0.67%
SOL-0.77%
NEAR+1.17%
#PCEAndGDPDataNextWeek: How Will Macroeconomic Data Affect Gold and Cryptocurrencies

Important macroeconomic data due next week are likely to determine the next moves across major markets. The US will release October personal income and outlays data, as well as the second estimate of third-quarter GDP, on November 25 at 13:30 (UTC). These inflation and economic growth figures are crucial to understanding the interest rate outlook, especially after the recent sell-off.

On the XAUT/USDT daily chart, gold is currently trading near 3,531. Technical indicators show a clear downtrend. The price is
NVDAG-0.24%
XAUT+0.30%
BTC-0.67%
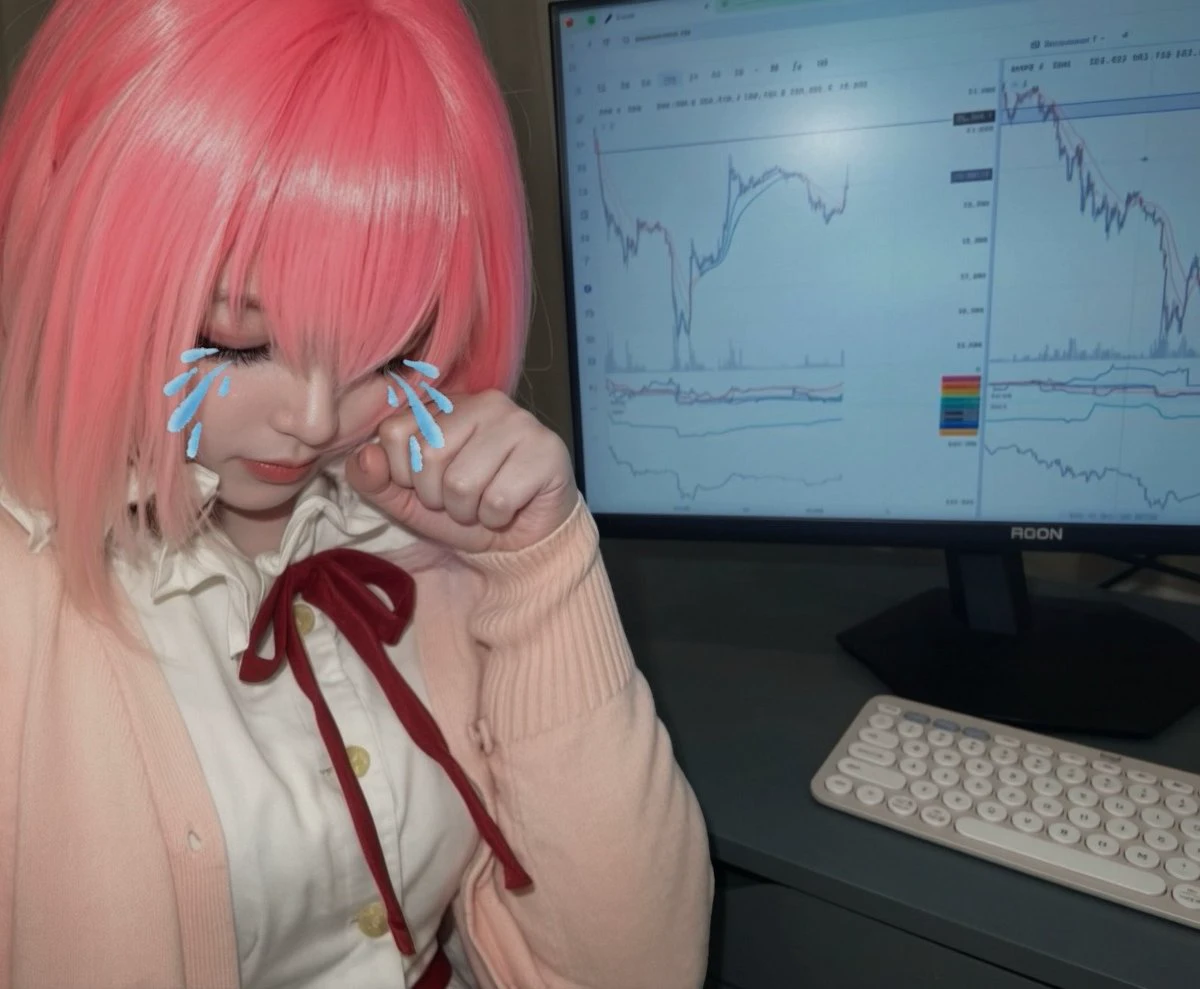
Putting it on gives you the urge to go all in
#FX戦士くるみちゃん
post-image
BTC
live-cover
LIVE1,513
BTC-0.67%
SOL-0.77%
USDC+0.01%
ETH-1.26%
XRP-1.15%
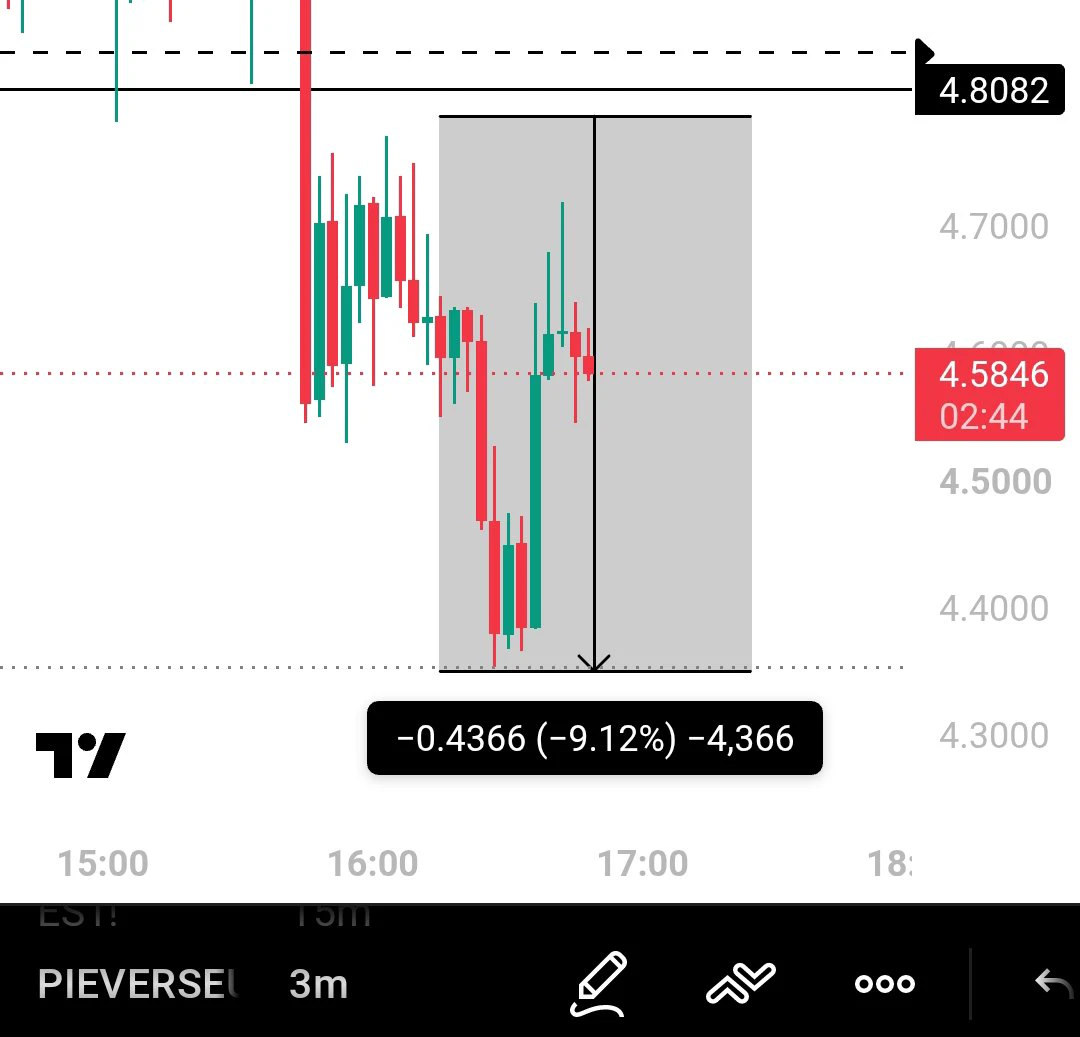
Some people are asking me about $PIEVERSE
Champs, I’ve already posted three tweets explaining the entire situation.
I gave just ONE short level. One stop-loss was hit, and I mentioned it. After that, Bitcoin dropped another 10% from the same level.
According to the 2%–6% strategy, I hope you’ve already booked your profits. A solid profit, and all within just a few minutes.
The accuracy is right in front of you.
Trading has never been this easy. Everything is transparent, and I’ve explained it all in my three tweets.
Now, go and check them.
ENJOY THE RIDE!
post-image
PIEVERSE+0.50%
BTC-0.67%
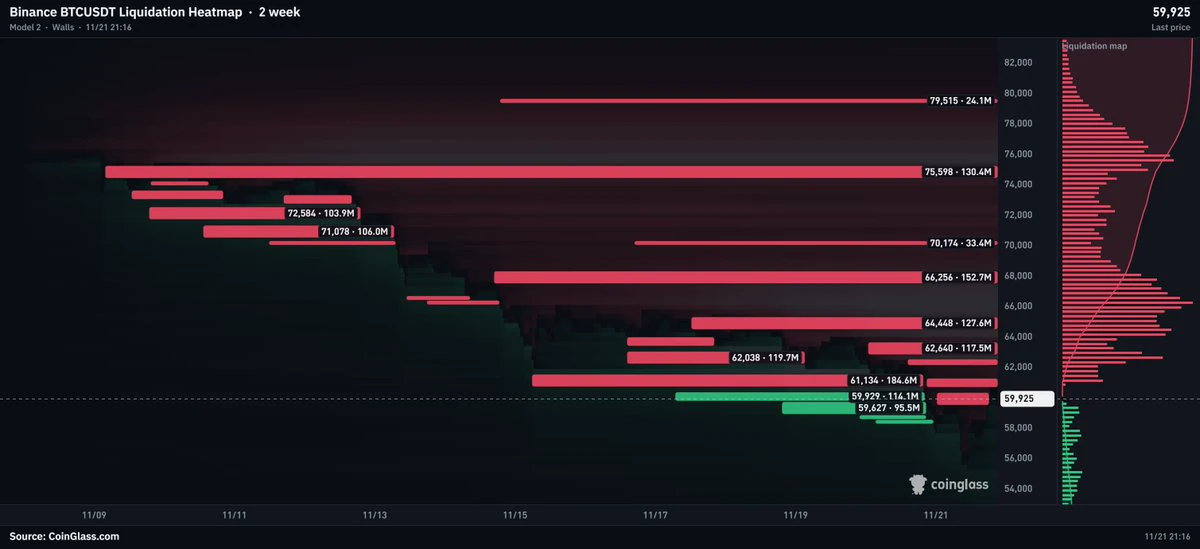
$BTC longs have been flushed, while over $700M in liquidation liquidity is stacked between $61K and $66K.
The fuel is now above the current price. A short squeeze could drive the next major move higher.
post-image
BTC-0.65%
11.22
Manual market monitoring has its limits; quantitative trading never tires.
Alpha Quant Alpha Quant
AI-powered algorithms + multidimensional risk management
Automatically capture global market opportunities 24 hours a day
Eliminate subjective emotions and human greed and fear
Replace human judgment with professional computing power
Give every trade a basis in data, strategy support, and risk management safeguards
Steady compounding, systematic arbitrage, and sustainable long-term returns!
post-image
$EVAA What, can it still be pumped into the green or something?
post-image
EVAA-0.49%
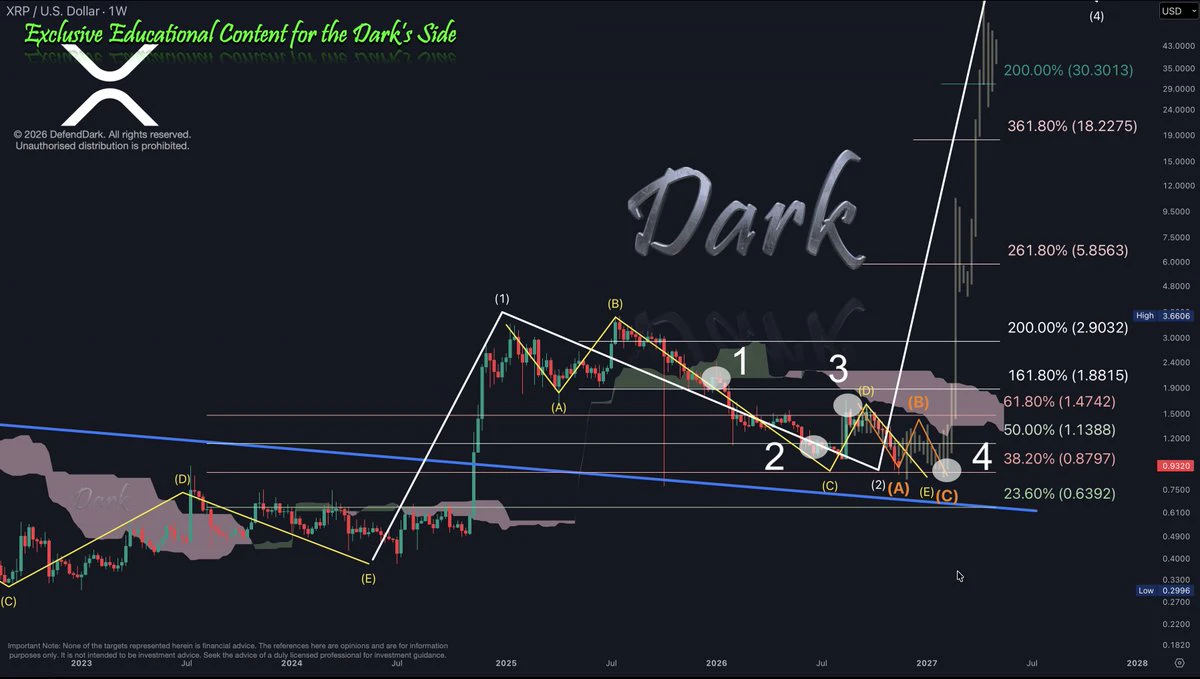
$XRP Weekly – the hardest correction, in four points
1. The flat was complete. ABC Wave from the Wave 1 top, done by the book.
2. The Wave C expanded. The regular flat became an expanded flat, down to $0.9852. Same three letters, a longer last leg.
3. The run to $1.6992. We called it a new wave, on one condition: the pullback had to keep $1.
4. $1 broke. So that run told us ABC wanted to further expand technically. We named our Wave 1 as Wave D when $1 can't hold, and we are now in Wave E.
ABCDE instead of ABC. Two moments that looked like the end, before the real one arrives.
What didn't chan
post-image
XRP-1.15%
Go with the trend: bears dominated throughout the week, with multiple waves of moves playing out one after another!
BTC repeatedly set up shorts at resistance, from 65500 and 64100 down to 59300, consistently targeting higher-level entries as each swing short played out; ETH followed suit, with shorts at the 1840, 1835, 1820, and 1640 resistance levels all validated in turn, steadily locking in profits.
Correlated coins moved down in tandem: the bearish call on ZEC near 960 reached the 600s, netting 210 points; SOL shorts around 76 and 70 hit all their targets as expected.
Every resistance and
BTC-0.65%
ETH-1.23%
What is a dApp?
A dApp, or decentralised application, is an app whose key logic and funds live in smart contracts, not only on a company's server. You usually connect a wallet instead of creating a password account.
The website you click is still often hosted in the normal way, so you must make sure you are on the real site before you sign anything.
📱 Read every wallet pop-up carefully; a fake dApp can ask you to approve a transfer you did not intend.
💡 Key takeaway: a dApp is an app that talks to smart contracts through your wallet.
post-image
  • 1
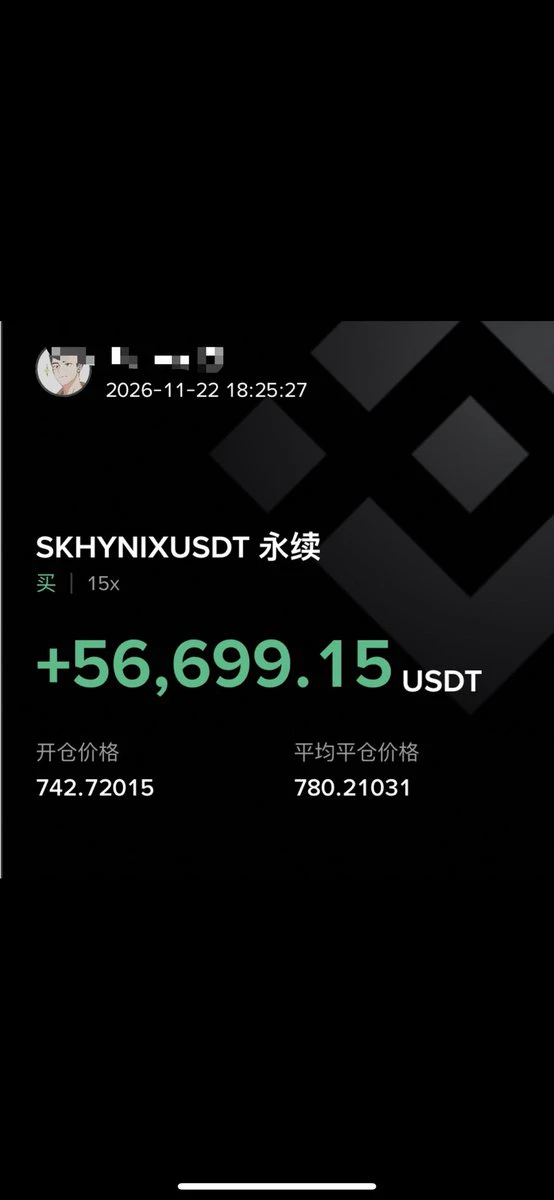
I feel like this trade was executed perfectly
post-image
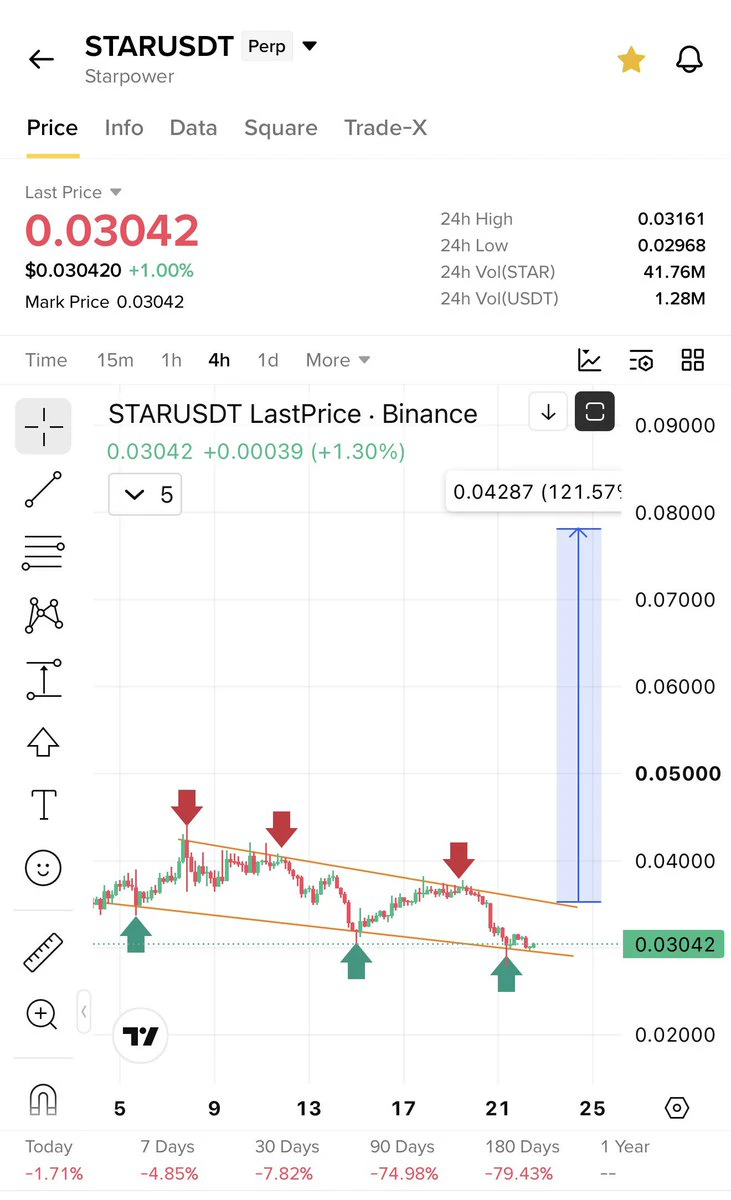
$Star cleanest setup
Perfect wedge
Perfect accumulation
post-image
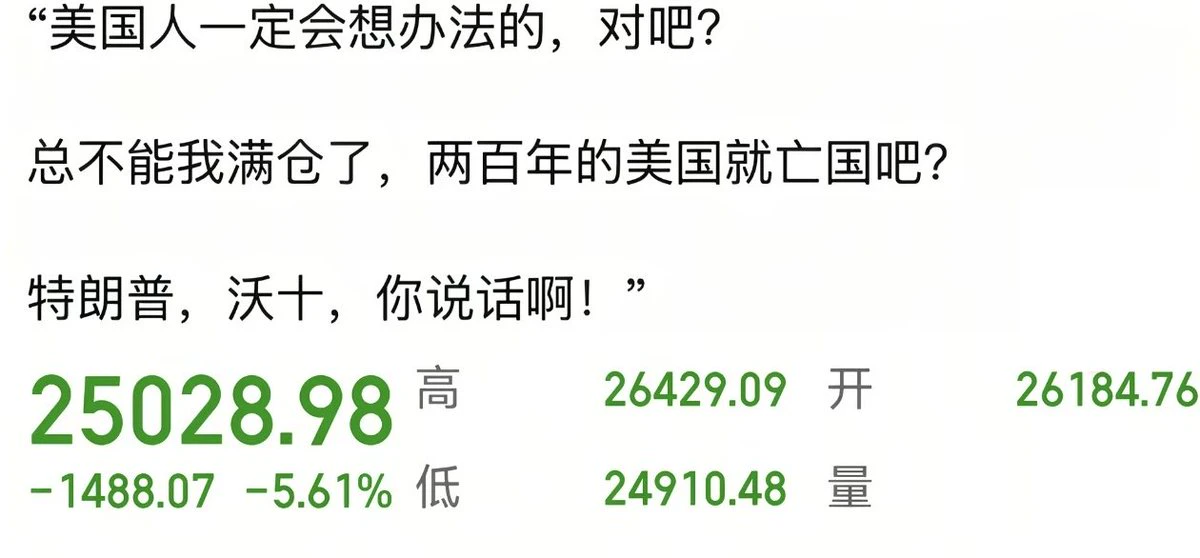
Can someone help him figure out why this is happening?
You guys can keep talking about Nvidia, Lumentum, Micron, Microsoft, and Intel,
Keep talking 😭😭😭
post-image
NVDA-13.84%
MSFT-2.61%
Load More

Join 40 M users in our growing community

⚡️ Join 40 M users in the crypto craze discussion

💬 Engage with your favorite top creators

👍 See what interests you

Trending Topics

BTCReboundFaces60KTest

2.1M Views30.1K Discussing

BTC rebounded from around $55,300 on November 21, briefly reclaiming $60,000 before pulling back to around $59,300. The $60K level is back in focus as traders assess whether the recovery can last. Is this rebound a sign of stabilization or a short-lived recovery? Would reclaiming and holding $60K be enough, or do you need confirmation from trading volume and fund flows?

PCEAndGDPDataNextWeek

259.4K Views2.6K Discussing

GateDirectIPOPhase3ANTAllocates92100Shares

834.6K Views5K Discussing

View More