Square
Following
Hot
News
Notifications
Profile
Share your thoughts
placeholder
Article
This week, I stayed on track: some trades were profitable, others hit stop-losses. When I’m wrong, I exit decisively; when I’ve read the market right, I hold steady. The market won’t always go anyone’s way, but as long as I keep a clear head and manage risk, profits can gradually be locked in. Steady positioning—those who know, know. #美股AI板块遭遇重挫 $BTC ‌
BTC-0.67%
#GateLaunchesPoSECProofOfSecurity

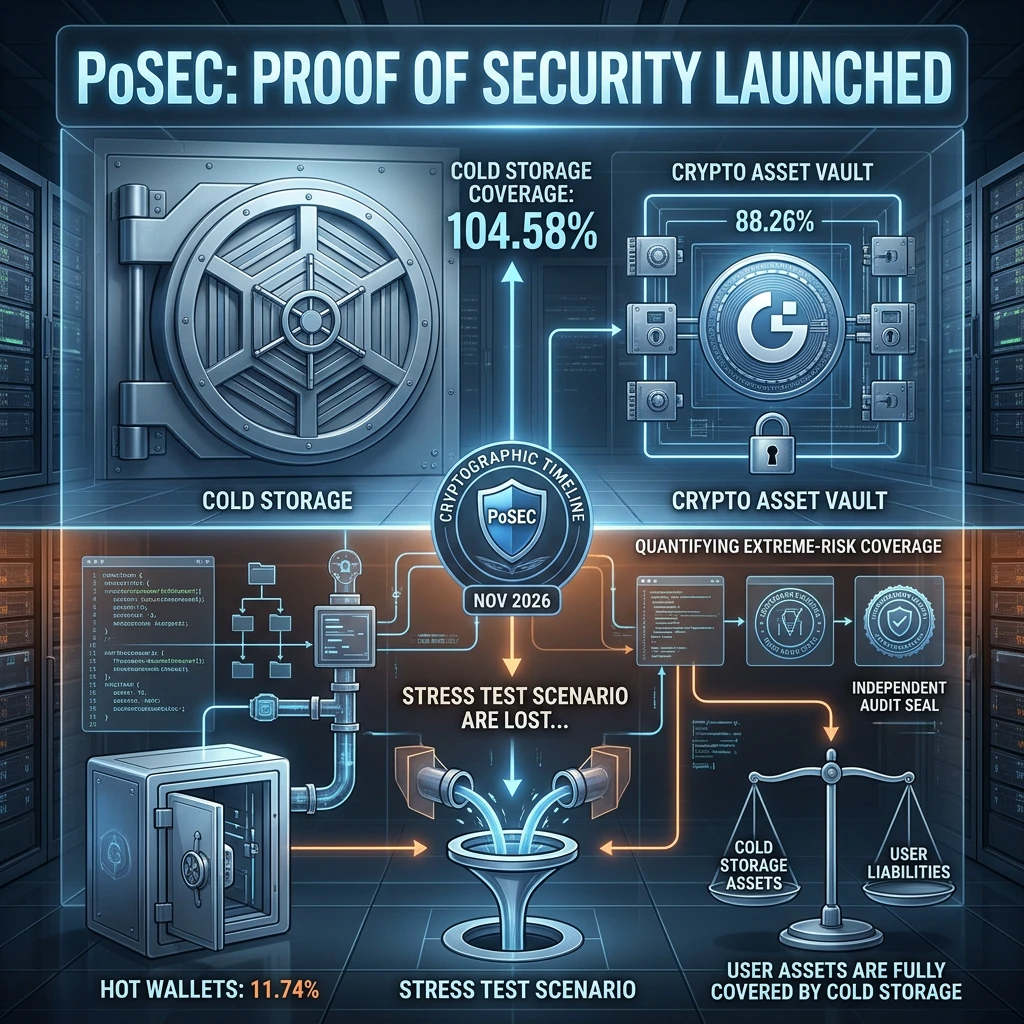
Gate Launches PoSEC: A New Standard for Measuring Crypto Exchange Security

Imagine an exchange suddenly loses access to every asset held in its online wallets. Would the funds stored offline be enough to cover all customer balances? This is an important question that traditional reserve reports do not fully answer.

Gate has introduced a new framework called Proof of Security (PoSEC), designed to bring greater transparency to how exchange assets are stored and how well they can withstand extreme security incidents. The launch adds another important dimensio
post-image
GT-2.41%
Trenches
ZIG
Z
bade
b
ZIG
0x8c...1145
Market Cap
$.
Change
.
24h Vol
$.
Holders
.
STONK
S
bade
b
STONK
6GmA...UNgx
Market Cap
$.
Change
.
24h Vol
$.
Holders
.
IDOL
I
bade
b
IDOL
0x3b...ab07
Market Cap
$.
Change
.
24h Vol
$.
Holders
.
MAGGIE
M
bade
b
MAGGIE
8rHo...PmZV
Market Cap
$.
Change
.
24h Vol
$
Holders
.
FLOAT
F
bade
b
FLOAT
Bv1a...BMmr
Market Cap
$.
Change
.
24h Vol
$.
Holders
.
How Much Should You Lose on a Single Trade? Scientifically Managing Risk Is Key to Long-Term, Consistent Profits!

In cryptocurrency futures trading, many people spend every day studying when BTC will rise or fall, yet rarely take the time to calculate one thing: if this trade goes against them, how much can they actually afford to lose?

In fact, in long-term trading, predicting direction is only part of the equation. Risk management is what determines whether an account can survive over time.

First, set your risk per trade in advance. You can use 1% of your account balance as the risk budge
post-image
BTC-0.65%
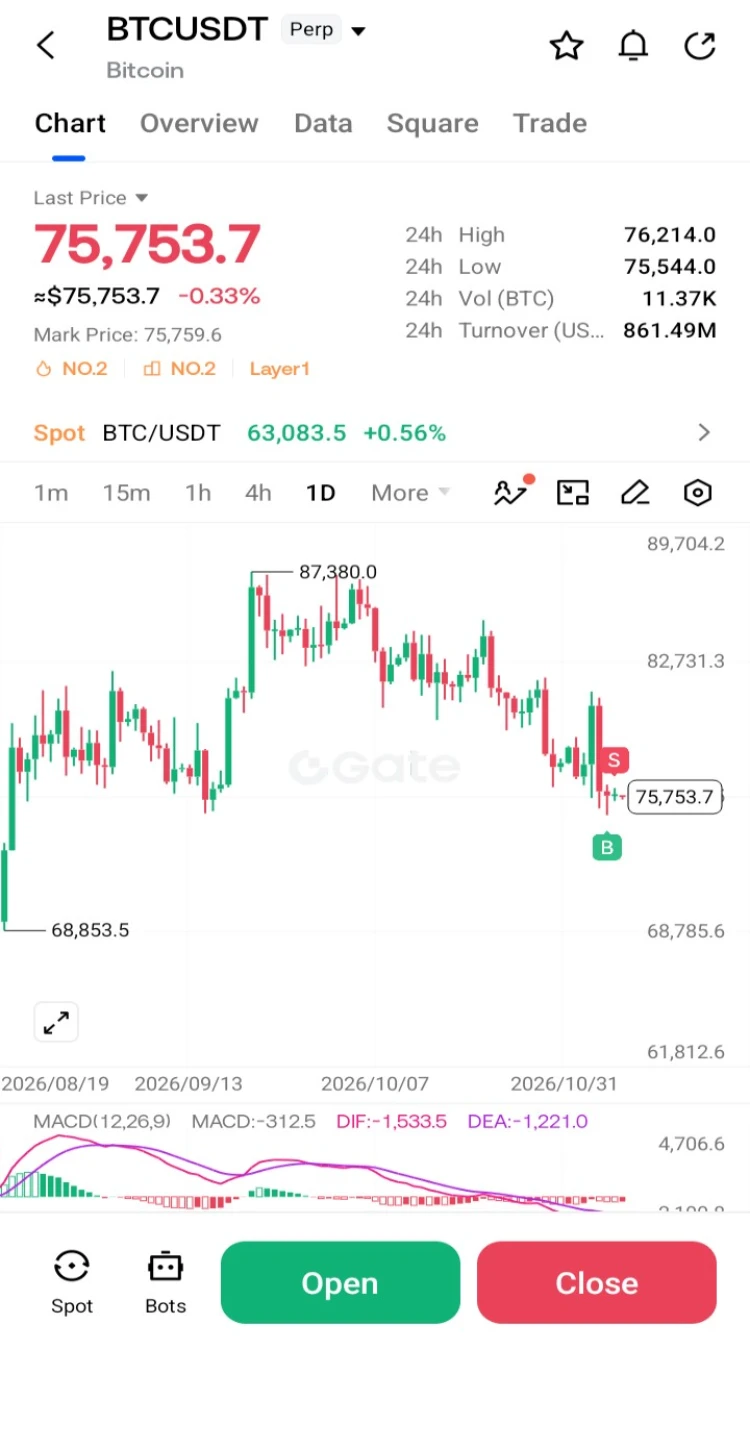
$BTC The previous 3 cycle bottoms occurred approx 365–406 days after their respective cycle tops.

Based on this historical pattern, the current 4-year cycle bottom is likely to arrive by late Nov or Dec.

⚠️ The next 2 months are absolutely critical.#ShareWeekly #USCPIDataIncoming #BTCETFOutflowsContinue #Ahr999EntersBottomBuyingZone

$ZEC
$JCT
$GT
$KOMA
BTC-0.65%
ZEC+1.29%
JCT-3.26%
GT-2.24%
KOMA-4.07%
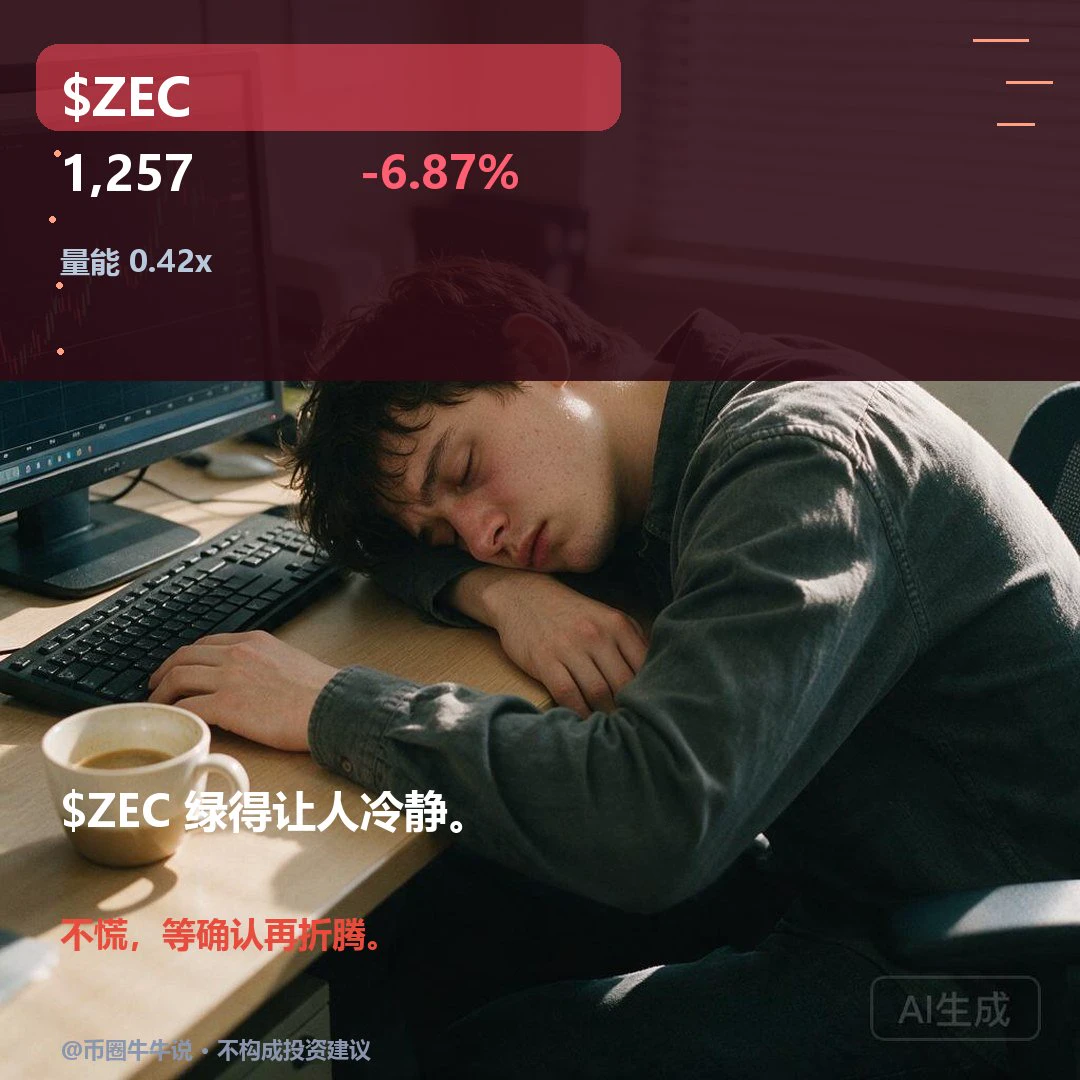
$ZEC Current price: 1257.38, 24H -6.87% (1235.00–1350.19). 1H is weak: RSI 40.10, EMA20 1270.54, support 1235.00/resistance 1334.33; 4H is weak: RSI 51.71, EMA20 1281.78, support 1183.38/resistance 1387.89. A move higher only matters if price reclaims and holds above the 1334.33 resistance; a break below the 1235.00 support would signal further weakness. Review whether price holds above 1334.33 and recovers after losing 1235.00; volume is only 0.42x. Without volume or a recovery, the setup is invalidated. The market is volatile; for observation only.
post-image
ZEC+1.16%
BTC price patterns after halving: What do historical data tell us?
In the Bitcoin market, halvings have always been an important event for investors. With each halving, miners receive fewer block rewards, and the rate at which new BTC enters the market also declines. Historically, BTC has gone through notable bull cycles after several halvings, so many investors view halving as an important reason to be bullish over the long term.
But can historical patterns really repeat?
First, halving changes the new supply. BTC halving reduces the rate of new coin issuance, but does not directly create buy
post-image
BTC-0.67%
$BTC Is Retesting the 15-Minute 200 MA

As projected earlier today, Bitcoin has now returned to retest the 15-minute 200 Moving Average.

This is a key moment for short-term market direction. If BTC faces rejection at this level, further downside movement could follow, with the next targets below coming into focus.

I'm closely watching the price reaction for confirmation.

For the full analysis and downside targets, check my timeline.

#USCPIDataIncoming #StakeOnLaunchpoolToShare450KVLX #ShareWeekly
post-image
BTC-0.67%
  • 7
$ETH

Are the US and Iran about to start fighting again?

Trouble flares up again in the Strait of Hormuz

Where will global capital flee this time?

Holy crap

Guys

The market had just caught its breath

And the Middle East is at it again

Tensions between the US and Iran have been rising again recently

November 6

The US carried out a new round of limited strikes on military targets near the Strait of Hormuz in Iran

Trump said

The US military had destroyed Iran’s newly built air defense system

Iran had also repeatedly warned

That if the US continued its attacks

It would retaliate aga
post-image
ETH-1.23%
‍#每周来晒 #广场交易达人 #WCTCS9

Next Week's Crude Oil Trading Plan

Crude oil posted its biggest weekly drop in six years last week, confirming a double-top pattern. I expect it will likely rebound early next week, and my trading strategy is to go long first, then short:

1. Crude oil long:

Planned entry: around 97

Stop-loss: 92

Take-profit: around 105

2. Crude oil short:

Planned entry: above 105

Stop-loss: 111

Take-profit: Hold for the long term $XBRUSD
post-image
XBRUSD-1.42%
🪔 HAPPY DIWALI 2026 🪔
🙏 शुभ दीपावली ✨
✨ May this Diwali bring endless happiness, peace, success & prosperity into your life. May Goddess Lakshmi bless you and your family with wealth, good health and positivity. ❤️
🙏 दीपावली की हार्दिक शुभकामनाएँ! 🪔
❤️ With Love
🔥 TEAM CRYPTO AMAN 🔥
post-image
BTC Outlook for the Next Year: Analysis of Three Possible Market Scenarios!
In the cryptocurrency market, many investors want to know in advance how high BTC will rise over the next year. But predicting prices is never simple. Rather than trying to give a definitive target, it is better to analyze several possible scenarios based on different market conditions.
First, the bullish scenario: Continued inflows. If global liquidity conditions improve, institutional funds continue to enter the market, and demand keeps growing, BTC may regain upward momentum. In this case, the market could form a ne
post-image
BTC-0.67%
New streamer bts market
live-cover
LIVE1,398
new stream crypt update
live-cover
LIVE1,386
Pi Network has announced more details about its ecosystem summit! 🌐

November 17: New Tools & Pi App Demo
November 18: Using Pi’s AI and Apps
November 19: Pi Next Developer Competition — 200k USDT prize pool.

YouTube, November 17–18: 8 AM Pacific Standard Time / 4 PM Coordinated Universal Time.

What are you most looking forward to?

#PiNetwork
post-image
PI-0.60%
  • 2
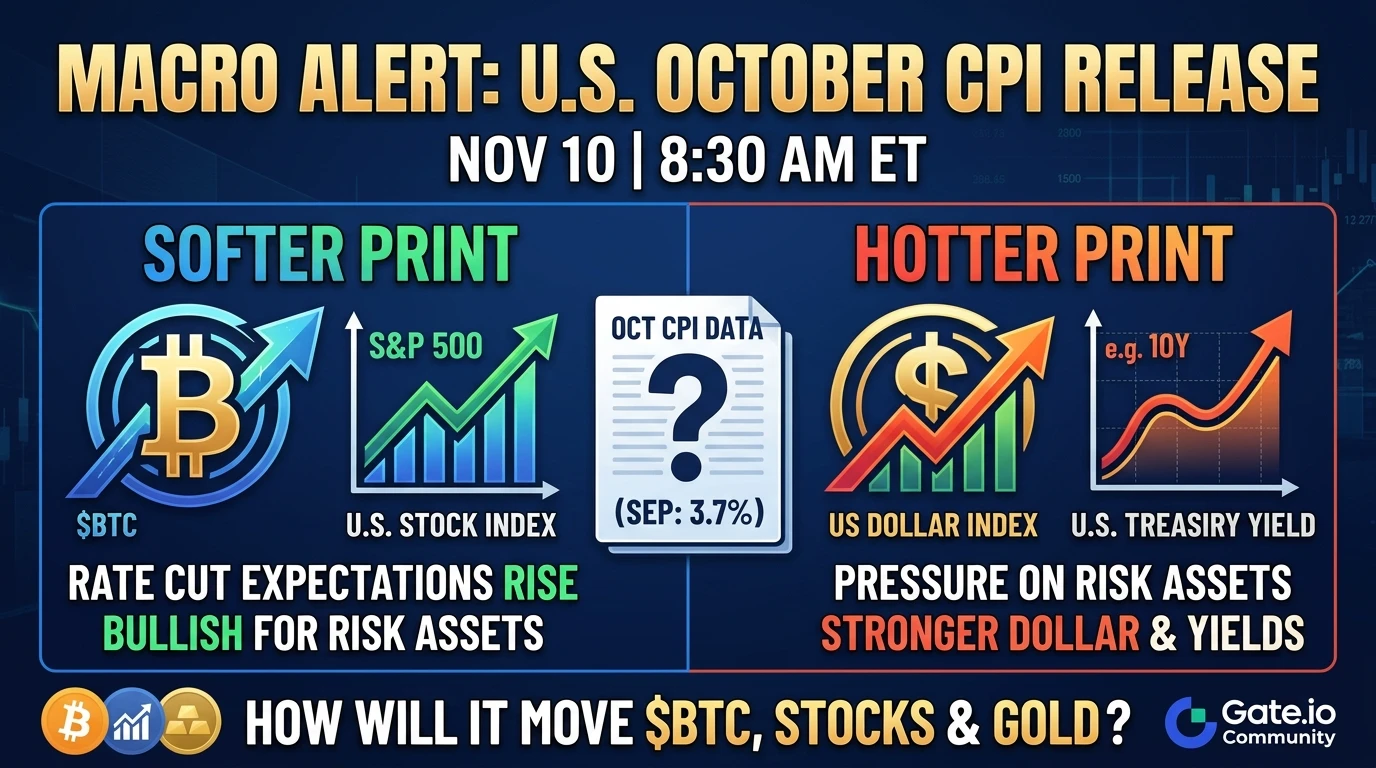
🚨 Macro Alert: The U.S. October CPI Print is Approaching!

All eyes are turning to the upcoming macroeconomic data release. The U.S. October CPI report is scheduled to drop on November 10 at 8:30 a.m. ET. With September's CPI having printed at 3.7% year-over-year, market participants are watching closely for concrete signs that inflation—particularly core CPI—is continuing to cool.

📈 Potential Market Scenarios
The Bullish Case (Softer-than-Expected Print): If inflation cools more than anticipated, expectations for future interest rate cuts will strengthen. This typically triggers a weaker U
post-image
BTC-0.67%
XAU+0.38%
NAS100+1.90%
AMD+11.55%
$ZEC I caught the falling knife at 1241, and my hands are still shaking.
Let’s start with the data—no need to comfort me yet. ZEC is currently at 1241.52, down 8.06% over 24h, with an intraday high of 1355.45 and low of 1235.21. Trading volume is 1.349 billion—it hasn’t contracted, which means panic selling is still underway. I reviewed ZEC’s price action across the past three halving cycles: after the first halving, a roughly -12% shakeout came on day 18; after the second, it was -9.8% on day 22; after the third, -8.5% on day 15. Today is exactly day 16 after this halving, with a decline of 8
ZEC+1.16%
#StakeOnLaunchpoolToShare450KVLX Yield Optimization Protocol: Allocating Capital to the 450,000 VLX Staking Pool

The structural mechanics of wealth preservation during periods of high macroeconomic volatility require a disciplined shift toward non-directional, cash-flow-generating asset classes. As global equity indices navigate intense valuation resets and data-center sector adjustments, maximizing the capital efficiency of idle digital assets becomes a primary operational mandate. Recognizing this need, the official deployment of the Velas (VLX) Launchpool initiative introduces a high-viabi
VLX+0.00%
  • 5
  • 1
Yellow curry Yellow curry Yellow curry Yellow curry Yellow curry Yellow curry Yellow curry
post-image
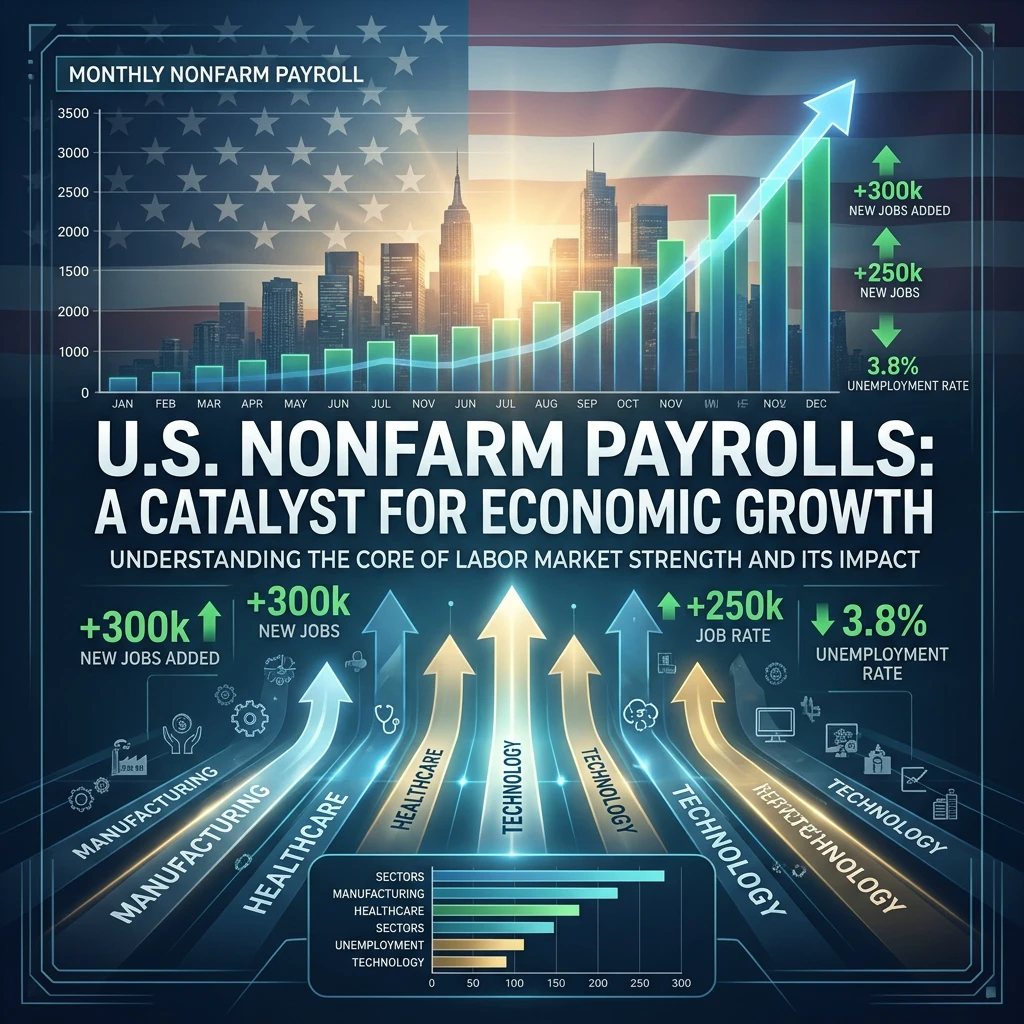
#USNonfarmPayrolls

US Jobs Deliver a Surprise Recovery: What October Payrolls Reveal About the Economy

A Sharp Change in Direction

A month ago, the US labour market appeared to be losing momentum. September added just 29,000 jobs, raising concerns about weaker hiring and a possible slowdown in the economy. Now the picture looks different. October brought a much stronger increase of 165,000 jobs, showing that employers added workers at a faster pace than recent months suggested.

This change is important because the US jobs report is one of the most closely watched economic releases. It hel
post-image
BTC-0.67%
Load More

Join 40 M users in our growing community

⚡️ Join 40 M users in the crypto craze discussion

💬 Engage with your favorite top creators

👍 See what interests you

Trending Topics

USCPIDataIncoming

1.88k Views1.48k Discussing

The U.S. October CPI report will be released on November 10 at 8:30 a.m. ET. September CPI came in at 3.7% year over year, and markets will be watching closely for signs that inflation is cooling, especially in core CPI. A softer-than-expected reading could strengthen rate-cut expectations, while hotter inflation may pressure risk assets through higher Treasury yields and a stronger dollar. How do you think this CPI print will move $BTC, U.S. stocks and gold?

USAIStocksHitHard

24.01k Views3.69k Discussing

USNonfarmPayrolls

41.49k Views4.38k Discussing

View More