Square
Following
Hot
News
Notifications
Profile
Share your thoughts
placeholder
Article
For more than a month now, we’ve been witnessing history every day. It really leaves you wanting to cry, with nothing you can do about it.
The Nasdaq 100 $QQ peaked on 10/6. Since then, this past month has been packed with nothing but epic trading days.

From 10/6 to 10/16, $SOX fell for 9 consecutive trading days, dropping a total of 16.3% and tying its longest losing streak since listing.

On 10/29, $GOOGL plunged 12.64%, its biggest single-day drop since listing in 2004, wiping out around $500 billion in a single day.
On 10/30, INTC tumbled 28.58%, its worst day at least since 1980.
On 1
post-image
GOOGL+0.11%
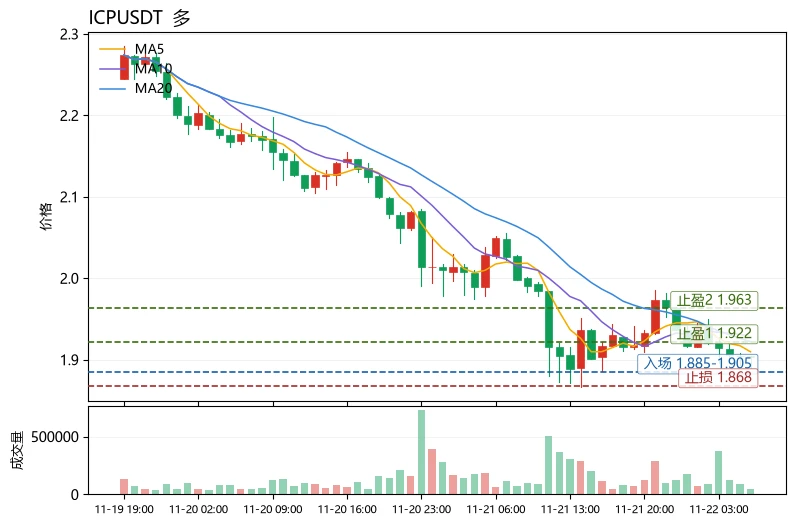
The Extreme Fear Index plunged to 12, yet $ICP fell only 6.26% and the MACD histogram remains positive—this is the most unusual detail in today's market: panic selling is underway, but bearish momentum has not expanded in tandem. Dragged down by BTC's weakness, ICP is now at 1.903, close to the lower Bollinger Band at 1.881. MA5 is below MA20 in a bearish alignment, RSI at 37.8 is nearing oversold territory, and the funding rate of -0.0041% shows shorts are paying to hold positions, indicating elevated crowding. Extreme sentiment combined with a negative funding rate often provides fertile gr
post-image
ICP-1.14%
DOT-1.51%
UNI+3.05%
Trenches
IDOL
I
bade
b
IDOL
0x3b...ab07
Market Cap
$.
Change
.
24h Vol
$.
Holders
.
PIEVERSE
P
bade
b
PIEVERSE
0x0e...25a9
Market Cap
$.
Change
.
24h Vol
$.
Holders
.
FIONA
F
bade
b
FIONA
B34n...pump
Market Cap
$.
Change
.
24h Vol
$.
Holders
.
Singularity
S
bade
b
Singularity
7R4M...pump
Market Cap
$.
Change
.
24h Vol
$.
Holders
.
CLAUDIA
C
bade
b
CLAUDIA
2j5S...W2ZM
Market Cap
$.
Change
.
24h Vol
$.
Holders
.
Crypto Trade Today
live-cover
LIVE661
AAPL-1.83%
AMD-13.27%
PLTR-6.45%
NVDA-13.84%
MU-13.88%
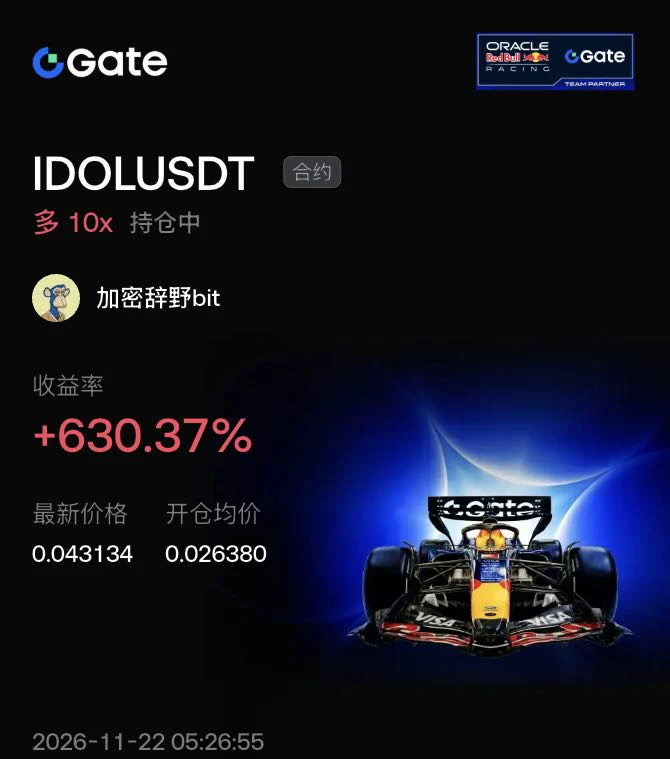
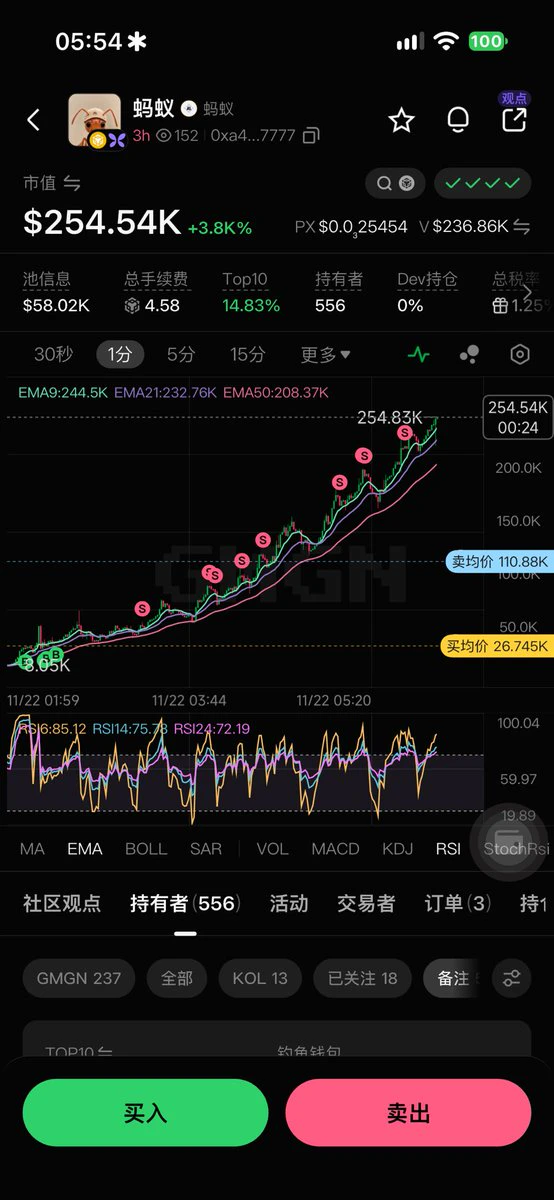
$IDOL I chased in, and didn't expect it to go up again.
IDOL-6.71%
$IDOL The scariest thing in trading isn’t getting the direction wrong—it’s getting it wrong and stubbornly refusing to admit it. This IDOL move took the “epic comeback” to the extreme.

Looking at the 1-hour chart, a pullback was expected after the price moved sideways around 0.026. But who could have expected the whales to suddenly play dirty, unleash massive volume, and send a huge bullish candle soaring straight up, instantly breaking through every resistance level?

Seeing that, I immediately realized the trend had changed. Without a second thought, I closed my position and reversed, going
post-image
IDOL-6.71%
BTC-0.65%
  • 1
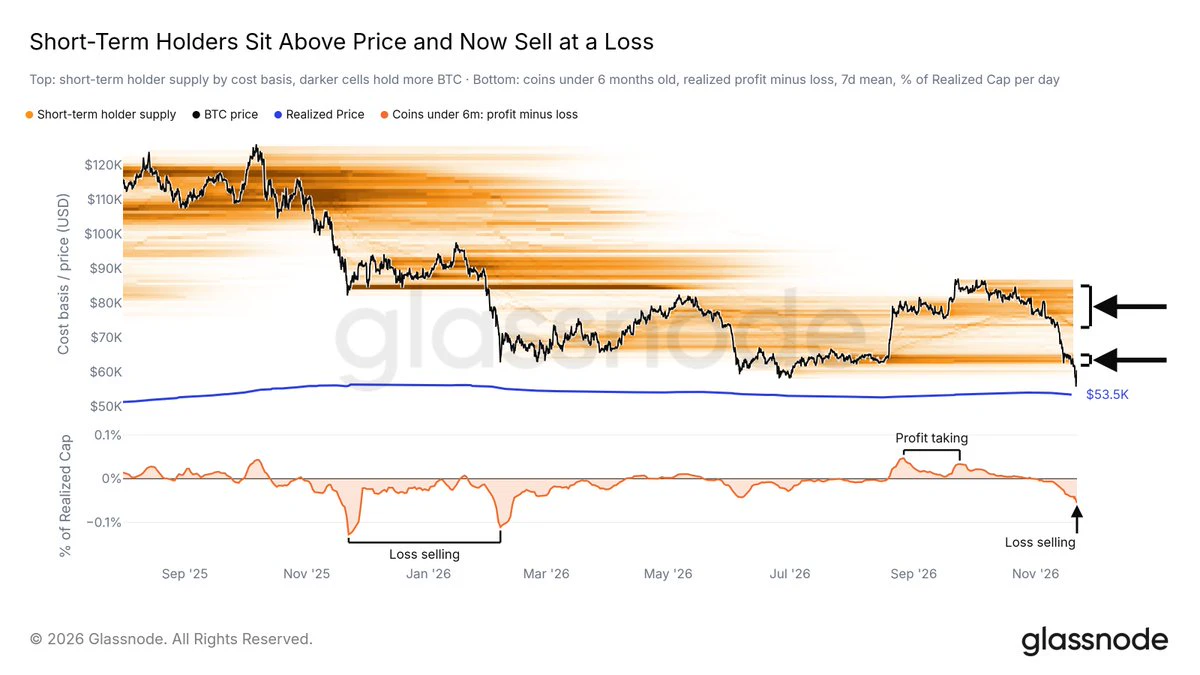
The short-term holder cluster under bitcoin:native has failed to hold.
As price broke below the $62K–$65K block, short-term holders started ramping up their selling at a loss.
Cost basis clusters like this often become resistance once price is below them.
post-image
BTC-0.67%
WEEKEND PREDICTION
live-cover
LIVE2,153
BTC-0.65%
SOL-0.74%
DOGE-0.18%
ZEC+1.29%
XAU+0.38%
$NVDAB 131.05, 24H +1.61%. The 1h chart looks relatively strong, but RSI at 69 is nearing overbought territory. Volume is only 0.21x the average, and price has yet to break above the 131.5 resistance. I’m watching this level closely: I’ll only consider higher prices if it holds above 131.5; a break below 127.4 would turn the short-term outlook bearish. Short-term momentum is still settling, so I’m mostly waiting for a clear direction before acting. I’ll watch the chart and decide. Keep monitoring. No need to rush. Not investment advice
#NVDAB
post-image
Market thoughts for the coming years
post-image
Damn, it moves like a Pixiu
post-image
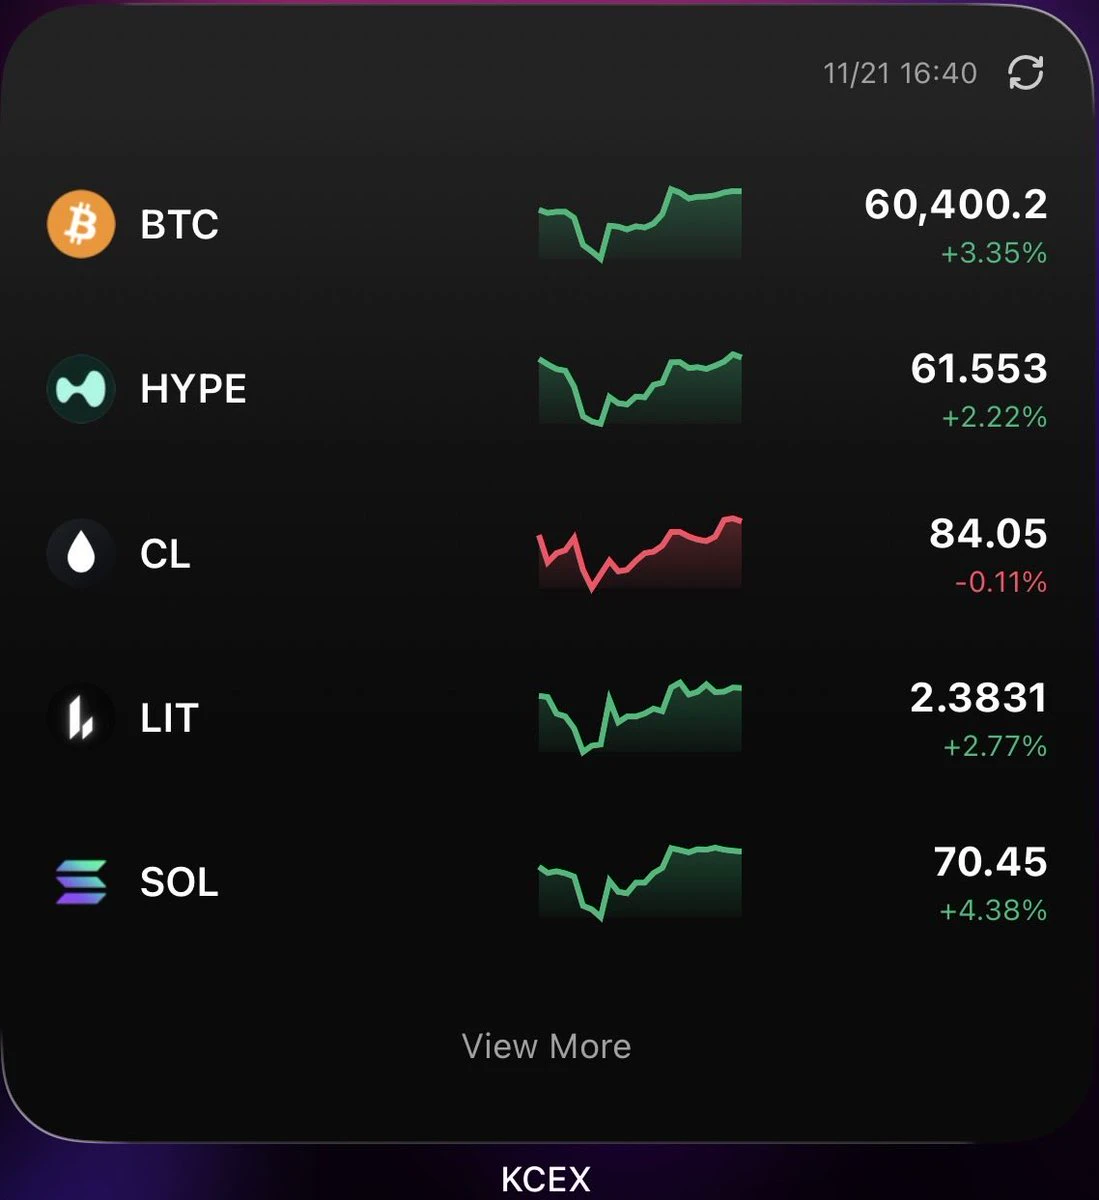
$BTC ‌The sea of red we saw on our screens may have sent a shiver down all of our spines for a moment. Bitcoin dipped below $60,000 for the first time since July, even falling as low as $55,130 at one point. Some of you might have wondered, "Is something even worse on the horizon?" Yet, markets sometimes offer a bit of breathing room, even in their darkest moments. That is precisely what happened: as the weekend approached, Bitcoin staged a recovery, climbing back to the $60,279 level.

So, what fueled this rapid rebound? In essence, the crypto market was purging its own internal excesses. Ac
BTC-0.67%
  • 4
  • 3
What kept me from adding to my position that day was that $SNDK SanDisk was starting to look less weak.

On Friday, the SOX fell 7.9%, while it fell 16%—twice as much as the sector. That day, the SOX fell 1.55%, while it was down just 2.4%, basically in line with the sector and no longer singled out for a selloff.

The previous day’s pattern of “falling harder than its peers” didn’t repeat. That suggests some of the overhead selling pressure had eased, and the short-term money rushing to exit after the split had mostly finished selling on Friday.

I opened the short at 92, and most of my profi
SNDK-0.18%
SKHY+0.86%
NVDA-0.35%
  • 1
Gm everyone ☀️
Are we back?
post-image
  • 1
$VELVET bought in again, and it's pumping
VELVET-3.58%
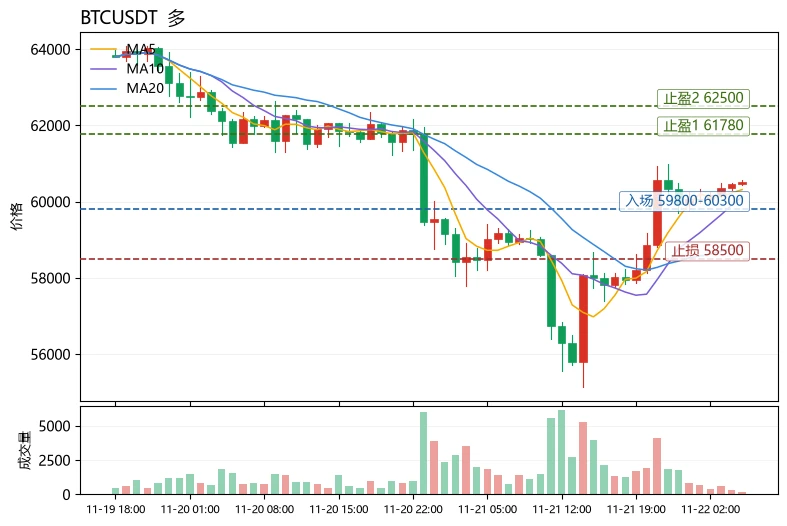
The most unusual detail in today’s market is that $BTC rose 3.60% against the trend while the Fear & Greed Index was just 12 (Extreme Fear), yet the funding rate was -0.0048%—shorts are paying to hold positions, while the price has climbed above MA5 (60316.5) and MA20 (58840.4). This is a classic short-squeeze structure, not a healthy trend. In terms of volatility, the range across 30 candlesticks is about 9.69%, and the upper Bollinger Band at 61786.8 is close at hand, so the risk/reward of chasing higher has already deteriorated. My rule is to go long only after a confirmed pullback, not to
post-image
MMT-2.35%
#BTC跌破6万美元关口 Post a valid post to get some boosts
post-image
BTC-0.67%
  • 2
$DOS This 16% bearish candle sent the rebound from 0.1837 straight back to 0.1423. The chart looks like a freshly paved road cracked under the weight of a heavy truck.
Compared with that asset that slowly drifted down last week, let’s compare them point by point. Decline: one was a sharp single-day plunge, with sentiment released all at once; the other leaked lower a little each day, like a slow, dull blade. Volume: $DOS today’s 16.4M was a high-volume decline, showing that some people really sold at this level while others bought; volume in the drifting-down asset contracted, with no one step
DOS+14.98%
  • 1
  • 2
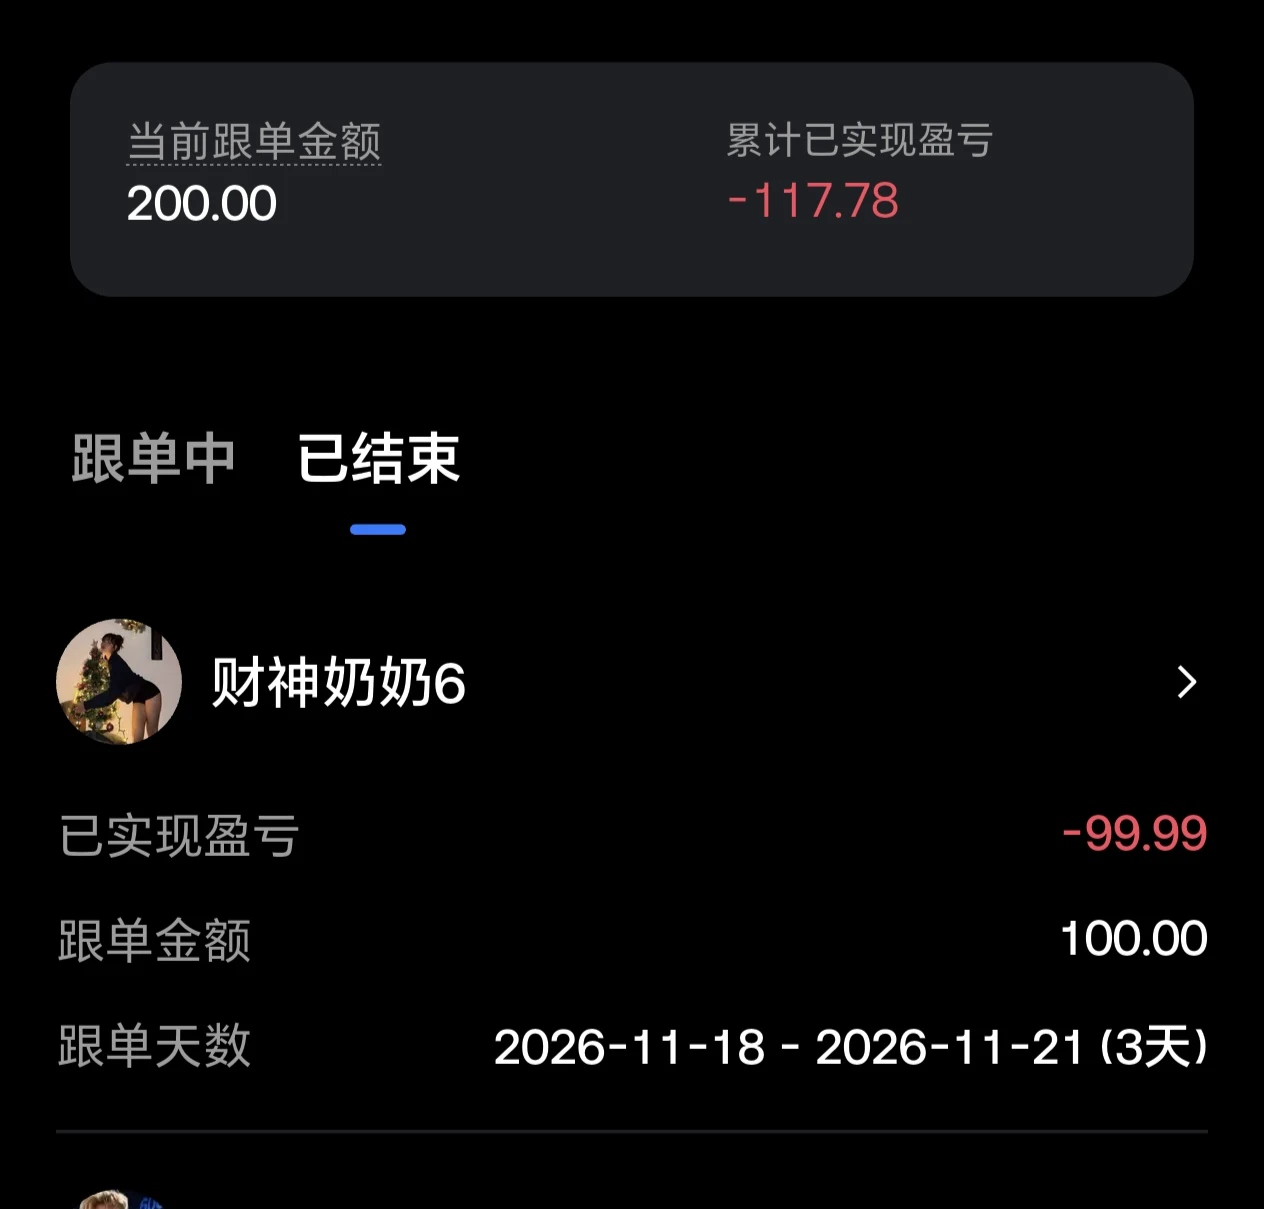
The shady trading signal provider Caishen Nainai 6 blew it all in two days🤬🤬🤬
post-image
Bitcoin ETF investors can hedge during Thanksgiving's 40+ hour trading gap
Arca-listed spot Bitcoin ETFs will miss Thursday’s core session. Eligible CME futures can still trade, with Thursday trades submitted for clearing due to clear Friday.
Quick Take
⚠️ Personal market analysis only. NFA — manage risk and DYOR.
Educational content, not investment advice or a recommendation to buy, sell, deposit, or withdraw any asset. No paid promotion or referral/affiliate links.
post-image
BTC-5.94%
Load More

Join 40 M users in our growing community

⚡️ Join 40 M users in the crypto craze discussion

💬 Engage with your favorite top creators

👍 See what interests you

Trending Topics

BTCBreaksBelow60K

2.1M Views30K Discussing

BTC fell below $60,000 on November 20 for the first time since July, alongside a tech stock selloff and broader pressure on risk assets. Will $60K become resistance, or can BTC quickly reclaim it? What price or volume signals would convince you that selling pressure is easing?

GateDirectIPOPhase3ANTAllocates92100Shares

794.1K Views4.9K Discussing

NvidiaDropsNearly14Percent

332.6K Views7.6K Discussing

View More