# CanBTCHold65K?

1.18M
Pin
📢 Gate Square|3/30 Hot Topics: #BTC能否守住6.5万美元?
The Middle East situation heats up again! Yemen Houthi forces officially involved in the conflict, and the US-Iran clash may escalate into ground warfare, with international oil prices continuing to rise. Amid rising risk aversion, Bitcoin briefly dropped to $65,000 this morning, then rebounded to around $67,000. The key support level has been reached—can BTC hold above $65,000?
🎁 Analyze the market, draw 5 lucky winners to share $1,000 in position experience vouchers!
💬 This week's discussion:
1️⃣ Are you bullish or bearish on BTC mov
BTC0.93%
View Original
post-image
  • Reward
  • 20
  • Repost
  • Share
Luna_Star:
LFG 🔥
View More
#BTCMarketAnalysis
Bitcoin is currently trading around $72,900 to $75,800 depending on the exchange and timing of the market snapshot. On May 28, 2026, BTC traded close to $72,899 after falling nearly 3.6 percent within 24 hours. The overall crypto market capitalization dropped toward $2.53 trillion while Ethereum declined to nearly $1,975.59 with a 4.8 percent loss. Just two days earlier Bitcoin was trading near $77,274 before slipping toward $75,824 and then collapsing into the $73,000 zone. CME Bitcoin futures for May 2026 traded near $77,710 while June contracts hovered around $77,985, sh
BTC0.93%
ETH1.32%
HighAmbition
#BTCMarketAnalysis
Bitcoin is currently trading around $72,900 to $75,800 depending on the exchange and timing of the market snapshot. On May 28, 2026, BTC traded close to $72,899 after falling nearly 3.6 percent within 24 hours. The overall crypto market capitalization dropped toward $2.53 trillion while Ethereum declined to nearly $1,975.59 with a 4.8 percent loss. Just two days earlier Bitcoin was trading near $77,274 before slipping toward $75,824 and then collapsing into the $73,000 zone. CME Bitcoin futures for May 2026 traded near $77,710 while June contracts hovered around $77,985, showing futures traders still expect recovery later. Prediction markets suggested BTC could stabilize around $75,000 by the end of May 29 trading
Why BTC Came Down to the 73K Level
The biggest reason behind Bitcoin’s decline is rising geopolitical tension between the United States and Iran. Reports of military escalation, sanctions pressure, and retaliatory strikes triggered panic across global markets. Investors quickly moved away from risky assets including cryptocurrencies
Another major reason was Bitcoin’s rejection near the 200-day moving average around $83,000. Multiple failed breakout attempts weakened bullish momentum heavily. Once BTC lost the key $75,000 support level, stop-losses triggered aggressively and liquidation pressure accelerated the crash toward $73,000.
Macroeconomic uncertainty also continues damaging sentiment. Concerns regarding inflation, Federal Reserve policy, and high oil prices are reducing appetite for speculative assets like Bitcoin
Technical Analysis: The Critical 73K Support Battle
Bitcoin is now testing one of the most important support zones of 2026 near the 100-day SMA around $73,000. This area has become the main battlefield between bulls and bears.
If BTC successfully reclaims this level with strong buying volume, the next upside targets become $80,000 and then $83,000 to $84,000. However, failure to recover above the 100-day SMA may confirm a dangerous triple-top pattern targeting approximately $59,000.
Momentum indicators including RSI and MACD still show bearish divergence across several timeframes, meaning sellers currently maintain control of short-term momentum
What Traders Are Thinking Right Now
Short-term trader sentiment remains mostly bearish. Many active traders expect BTC to test $72,700 first and then potentially $70,600 or even $68,000 if weakness continues. Rebounds toward $74,000 to $75,000 are currently viewed as short-selling opportunities rather than bullish reversals
However, some analysts still believe Bitcoin is sitting inside a strong weekly support zone where institutional buyers may accumulate aggressively. Long-term sentiment remains positive because ETF inflows, institutional adoption, and post-halving cycle expectations continue supporting the broader bullish thesis.
Prediction markets currently assign only a small probability of Bitcoin reaching $100,000 next month, but year-end expectations remain much stronger
Forecast Price: Where Could BTC Go Next
Institutional forecasts for Bitcoin in 2026 vary widely. Standard Chartered targets approximately $150,000 while CoinShares projects $120,000 to $170,000. Maple Finance expects around $175,000 and several aggressive forecasts extend toward $200,000 or even $225,000 under highly bullish conditions.
At the same time, bearish scenarios still suggest possible downside toward $59,000 if geopolitical tensions worsen and technical breakdowns continue
Most institutional forecasts cluster between $120,000 and $175,000, suggesting long-term upside potential remains significant despite current weakness.
Bullish Scenario
In the bullish scenario, geopolitical tensions ease and risk appetite returns to financial markets. Bitcoin could quickly reclaim $75,000 and push toward $80,000 to $84,000. A breakout above the 200-day moving average near $83,000 would strengthen momentum dramatically and reopen the path toward $100,000.
ETF inflows remain one of the strongest bullish catalysts because institutional investors continue accumulating exposure through regulated products. If Federal Reserve policy becomes more accommodative later in 2026, liquidity conditions could improve sharply for crypto markets.
Under favorable conditions, Bitcoin reaching $120,000 to $175,000 by late 2026 or early 2027 remains possible.
Bearish Scenario
If geopolitical conflict escalates further, Bitcoin may face another major selloff. A breakdown below $71,000 could quickly expose $69,000 and $68,000 support levels. Confirmation of the triple-top pattern could open downside targets near $59,000.
Additional risks include inflation pressure, tighter Federal Reserve policy, regulatory crackdowns, or another major crypto industry crisis. In the worst-case scenario, Bitcoin could revisit the $50,000 region if several negative catalysts combine together.
Trading Strategy and Plan Tips
Current market conditions require disciplined trading and strong risk management. Bullish traders should wait for confirmation before entering large positions. Recovery above $75,000 with strong volume would improve the bullish outlook significantly.
Potential long entries may exist around $72,700 to $73,200 with targets at $75,000, $80,000, and eventually $83,500. Bearish traders continue favoring shorts near $74,000 to $75,000 with downside targets at $71,000 and $70,600.
Leverage should remain limited because volatility is extremely high. Keeping 30 to 40 percent of capital in stablecoins or cash provides flexibility during rapid market swings.
Bitcoin near $73,000 represents a major turning point for the market. Short-term conditions remain bearish due to geopolitical tension, macroeconomic uncertainty, and technical weakness. However, long-term fundamentals including institutional adoption, ETF demand, and post-halving cycle dynamics still support the broader bullish outlook.
The next few weeks will likely remain highly volatile, but these lower price levels may eventually become the foundation for the next major Bitcoin rally. Traders should stay disciplined, manage risk carefully, and monitor both geopolitical headlines and key technical levels closely..@Gate_Square @Gate广场_Official
repost-content-media
  • Reward
  • 5
  • Repost
  • Share
BabaJi:
To The Moon 🌕
View More
#BTCMarketAnalysis
Bitcoin is currently trading around $72,900 to $75,800 depending on the exchange and timing of the market snapshot. On May 28, 2026, BTC traded close to $72,899 after falling nearly 3.6 percent within 24 hours. The overall crypto market capitalization dropped toward $2.53 trillion while Ethereum declined to nearly $1,975.59 with a 4.8 percent loss. Just two days earlier Bitcoin was trading near $77,274 before slipping toward $75,824 and then collapsing into the $73,000 zone. CME Bitcoin futures for May 2026 traded near $77,710 while June contracts hovered around $77,985, sh
BTC0.93%
ETH1.32%
post-image
post-image
post-image
post-image
  • Reward
  • 23
  • Repost
  • Share
ShainingMoon:
To The Moon 🌕
View More
#BTCMarketAnalysis
BITCOIN (BTC) COIN OVERVIEW WITH CURRENT MARKET PRICE CONTEXT
INTRODUCTION
Bitcoin remains the most dominant cryptocurrency in the global financial system and continues to act as a key macro indicator for risk sentiment across both crypto and traditional markets. Its price behavior is now heavily influenced by liquidity conditions, institutional flows, ETF activity, and global macroeconomic developments.
The inclusion of real-time price action through market chart analysis provides a clearer understanding of Bitcoin’s current positioning inside a highly volatile but structu
BTC0.93%
post-image
post-image
  • Reward
  • 10
  • Repost
  • Share
ShainingMoon:
To The Moon 🌕
View More
#GateSquareMayTradingShare
May has been a valuable month for refining my approach to automated trading, especially through experimenting with BTC grid trading strategies on Gate. One thing became very clear during this experience: successful bot trading is less about “set and forget” and more about understanding market structure, volatility, and capital management.
At the beginning of the month, BTC was consolidating near the 80K region with relatively stable intraday volatility. Instead of chasing momentum, I focused on the probability of continued range-bound movement and deployed a BTC/USD
BTC0.93%
post-image
post-image
post-image
post-image
  • Reward
  • 11
  • Repost
  • Share
DragonFlyOfficial:
2026 GOGOGO 👊
View More
#BTCMarketAnalysis
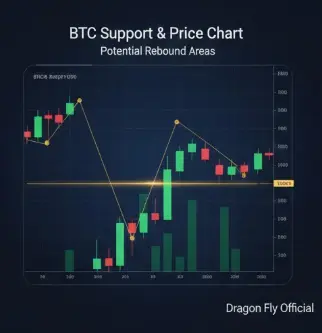
1 The Bitcoin price currently maintains a strong position above the 80052 level on this Tuesday May 5 2026 as the market reacts to the removal of exchange traded fund option limits
2 Support levels have firmly established themselves at 78000 while the next major resistance level for the current rally is targeted at 85000 following the 1.62 percent gain seen on May 4 2026
3 Market analysis shows that institutional inflows have reached a record pace with over 100000000000 managed by spot investment vehicles globally as of May 2026
4 Today strategy for traders involves lookin
BTC0.93%
post-image
  • Reward
  • Comment
  • Repost
  • Share
#BTC能否守住6.5万美元? Bitcoin at the Crossroads: Can BTC Hold $65,000?
Bitcoin stands at a defining moment. After staging an impressive 30% recovery from its February lows below $60,000, BTC now trades near $76,000–$77,000 — but the critical question on every trader's mind is whether it can hold the $65,000 level if the rally falters.
The short answer? It likely can — but the path ahead involves a make-or-break test at $79,000–$80,000 first.
The $79K Wall: Bitcoin’s Most Important Resistance Level
Bitcoin's immediate challenge lies directly overhead. The $79,000–$80,000 zone represents the Short-T
BTC0.93%
WOO3.94%
BRN0.42%
post-image
post-image
post-image
  • Reward
  • 4
  • Repost
  • Share
SheenCrypto:
LFG 🔥
View More
🔥 #BTCMARKETANALYSIS – April 27, 2026 | BREAKOUT PHASE INITIATED 🔥
As of today, Bitcoin (BTC) has officially pushed above the $79,000 level, marking a critical shift in market structure. This is not just a price move — it is a high-confidence signal that the market is transitioning from consolidation into expansion, even while global markets remain under macro pressure.
---
📊 Market Structure & Current Positioning
Bitcoin is currently holding strength above $79K, which was previously acting as a multi-week resistance ceiling. This level is now attempting to flip into support — a key technic
BTC0.93%
post-image
  • Reward
  • 9
  • Repost
  • Share
ybaser:
2026 GOGOGO 👊
View More
#WHCADinnerShootingIncident #AaveLaunchesrsETHRecoveryPlan 🔥 #BTCMarketAnalysis – April 26, 2026 | The $80K Battlefield 🔥
Bitcoin is currently locked in a high-stakes consolidation zone, trading just below the critical $79K–$80K resistance, where the next move will likely define short-term market direction. This is not just another range — it’s a decision phase between continuation and rejection.
---
📊 Current Market Structure
BTC has shown strong recovery from recent lows and is now holding above key moving averages, signaling underlying strength. However, price action is tightening, volat
BTC0.93%
AYATTAC
#AaveLaunchesrsETHRecoveryPlan 🔥 #BTCMarketAnalysis – April 26, 2026 | The $80K Battlefield 🔥
Bitcoin is currently locked in a high-stakes consolidation zone, trading just below the critical $79K–$80K resistance, where the next move will likely define short-term market direction. This is not just another range — it’s a decision phase between continuation and rejection.
---
📊 Current Market Structure
BTC has shown strong recovery from recent lows and is now holding above key moving averages, signaling underlying strength. However, price action is tightening, volatility is compressing, and the market is preparing for a major breakout or breakdown.
👉 This is what smart money calls a “liquidity build-up phase.”
---
🐂 Bullish Case – Institutional Strength Building
The bullish narrative is backed by:
• Consistent ETF inflows providing strong demand
• Ongoing whale accumulation signaling long-term confidence
• Price holding above 100-day SMA, historically a bullish signal
If BTC manages a strong daily close above $80,000, it could trigger:
➡️ Momentum expansion
➡️ New liquidity inflows
➡️ Targets toward $85K–$88K
---
🐻 Bearish Risk – Rejection & Structure Weakness
The bearish argument focuses on:
• Possible bear flag formation on lower timeframes
• Weak altcoin confirmation, signaling incomplete market strength
• Risk of this move being a relief rally, not a true breakout
If BTC fails to break $80K and loses support:
➡️ A drop toward $74K–$76K becomes likely
➡️ Breakdown below that opens path toward $72K or lower
---
📍 Key Levels to Watch (Very Important)
🔴 Resistance: $80,000 (make-or-break level)
🟢 Support: $74,000 – $76,000 (bullish structure zone)
👉 Above $80K = Expansion Phase
👉 Below $76K = Correction Phase
---
🌍 Macro Drivers – Why Market is Unstable
Bitcoin is no longer moving alone. It is now reacting to global factors:
• Geopolitical tension (US–Iran) → increases volatility
• Stock market correlation → BTC follows risk-on / risk-off sentiment
• Altcoin weakness → lack of full bull cycle confirmation
👉 This creates a mixed environment where fundamentals are bullish but momentum is uncertain
---
🧠 Smart Money Insight
Right now, the market is not trending — it is deciding.
👉 Institutions are accumulating
👉 Retail is hesitant
👉 Liquidity is building
This combination usually leads to a strong move once direction is confirmed
---
🔥 Final Thought
Bitcoin is not weak — it is waiting.
The $80K level is not just resistance —
it is a trigger point for the next major phase of the market.
---
💬 Your Turn:
Do you see BTC breaking $80K this week — or rejecting first?
---
🚀 Trade smart. Stay patient. Let the market confirm — then act.
#Bitcoin #CryptoAnalysis #CryptoMarket #Gateio
repost-content-media
  • Reward
  • Comment
  • Repost
  • Share
#BTCMarketAnalysis
Bitcoin is currently trading around $77,680, after recently touching highs near $79,500 and failing to break the major $80,000 psychological resistance. This rejection is not just a simple pullback; it reflects a combination of technical pressure, liquidity barriers, and cautious market sentiment that is shaping the current market structure.
The $78,000 to $80,000 zone has become one of the most important resistance areas in the market right now. This region aligns with previous highs formed in late January and early February, which means a large number of traders previousl
BTC0.93%
BlackRiderCryptoLord
#BTCMarketAnalysis
Bitcoin is currently trading around $77,680, after recently touching highs near $79,500 and failing to break the major $80,000 psychological resistance. This rejection is not just a simple pullback; it reflects a combination of technical pressure, liquidity barriers, and cautious market sentiment that is shaping the current market structure.
The $78,000 to $80,000 zone has become one of the most important resistance areas in the market right now. This region aligns with previous highs formed in late January and early February, which means a large number of traders previously entered positions here. As price revisits this zone, many of those participants are exiting their positions at breakeven or small profit, creating strong selling pressure. At the same time, volume profile analysis shows the Point of Control (POC) near $80,500, meaning this is where the highest trading activity occurred historically. Such levels often act as magnets for price but also require strong momentum to break through.
Liquidity data further strengthens this bearish pressure in the short term. There are heavy sell walls stacked between $80,000 and $84,000, indicating that even if Bitcoin manages to break $80K, it will not be an easy continuation. Without sustained institutional inflows and strong spot demand, any breakout attempt may face quick rejection.
Another critical signal comes from the derivatives market. Funding rates remain negative despite price moving upward toward $79K. This is an unusual divergence because, in strong bullish trends, funding typically turns positive. The current situation suggests that spot buyers are pushing the price up, while leveraged traders are either cautious or actively shorting the market. This creates a fragile rally structure where upward movement lacks strong conviction and can reverse quickly if buying pressure slows down.
At the macro level, geopolitical developments have become the dominant driver of Bitcoin’s recent price action. The temporary ceasefire between the United States and Iran triggered a strong risk-on move, pushing Bitcoin from the low $70,000 range to nearly $79,000 within a short time. This move was supported by approximately $1.4 billion in institutional inflows, highlighting how quickly sentiment can shift when global tensions ease. Additionally, the rally caused over $330 million in short liquidations, creating a chain reaction of forced buying that accelerated the upward move.
However, the situation remains unstable. Reports of renewed tensions, including the seizure of an Iranian cargo vessel, caused Bitcoin to briefly fall below $74,000, showing how sensitive the market currently is to geopolitical headlines. While temporary stability has returned, the lack of a permanent resolution keeps uncertainty high.
🔍 Scenario Breakdown:
🔴 Bearish Scenario (Geopolitical Escalation):
If tensions rise again or the ceasefire collapses, markets may shift into risk-off mode. In this case, Bitcoin could drop toward $73,000 – $70,000, especially as CME gaps remain open in that range. Initially, BTC may move in correlation with equities to the downside before stabilizing.
🟢 Bullish Scenario (De-escalation & Stability):
If peace talks progress and uncertainty fades, Bitcoin could break above $80,000 with strong momentum. This could open the path toward $82,000 – $84,000, and in an extended rally, the $90,000 – $100,000 range could come into focus as institutional demand strengthens.
📊 Inflation & Federal Reserve Influence:
Recent CPI data has shown signs of easing inflation, which supports risk assets like Bitcoin. Lower inflation increases the likelihood of future interest rate cuts, which improves liquidity conditions and supports bullish momentum.
However, risks still remain. Core inflation is still relatively sticky, and any unexpected increase could push the Federal Reserve to maintain higher interest rates for longer. This would reduce liquidity and potentially slow down Bitcoin’s upward movement.
In addition, discussions around potential Federal Reserve leadership changes and policy direction are adding another layer of uncertainty that traders must monitor closely.
📈 Trading Strategies:
Bullish Breakout Strategy:
Wait for a confirmed breakout above $78,300 – $79,000 with strong volume and rising open interest.
Targets: $80K → $82K → $84K
Stop Loss: Below $76,200 or $75,500
Confirmation: Funding turning positive + strong spot demand
Bearish Rejection Strategy:
Look for rejection signals near $79K – $80K (e.g., long wicks, bearish divergence).
Targets: $76K → $73.5K → $71K
Stop Loss: Above $80K
Range Trading Strategy:
Market is currently range-bound, so traders can:
Buy near $75,100 – $73,600
Sell near $78,600+
Avoid $76K – $78K zone due to choppy movement
📦 On-Chain & Market Structure:
On-chain data continues to show strong long-term confidence:
+303,000 BTC accumulated by long-term holders
-290,000 BTC reduced by short-term holders
This indicates a shift from weak hands to strong hands, which is typically a bullish sign for the long-term trend.
Institutional participation is also increasing, with major players and corporations continuing to accumulate Bitcoin, reinforcing the broader bullish structure.
⚠️ Risk Management:
The current market environment is highly sensitive and driven by external factors. Traders should:
Use proper position sizing
Avoid over-leveraging
Wait for confirmation before entering trades
Stay updated on geopolitical and macro developments
🔮 Final Outlook:
Bitcoin remains in a larger uptrend, but is currently facing a strong resistance barrier. The $80,000 level is the key trigger point for the next major move.
A strong breakout above this level could lead to rapid upside expansion, while repeated rejection may push price back toward the $70,000 support region.
In this phase, patience and discipline are more important than aggressive trading. The market is offering opportunities, but only to those who can manage risk and adapt quickly to changing conditions.
  • Reward
  • Comment
  • Repost
  • Share
Load More