HYPE/USDT Under Pressure, Is a Recovery Beginning or Is More Downside Ahead? A Professional 4H Market Analysis
Market Update (18 July 2026)
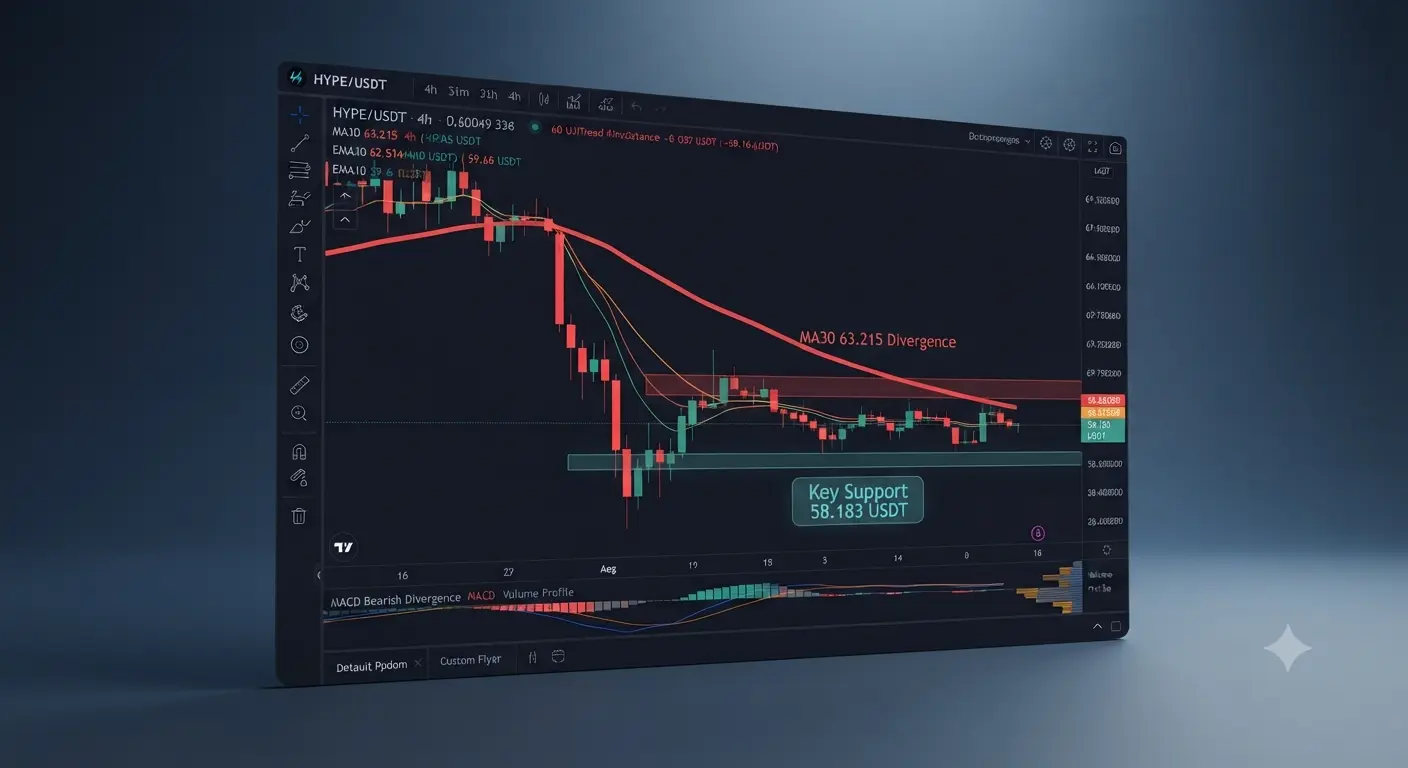
HYPE/USDT is trading near 59.390 USDT on the 4-hour timeframe, according to the provided Gate.io chart. The market remains under pressure following a strong decline from the recent swing high around 68.990 USDT. Although selling pressure has dominated the trend, recent candles indicate that buyers are attempting to defend the lows around 58.183 USDT. At the time reflected in the screenshot, price is moving within a relatively narrow range after a sharp decline, suggesting that traders are closely watching for confirmation of either a recovery or another bearish continuation.
Executive Summary
HYPE has experienced a significant correction after failing to maintain its previous upward momentum. The visible trend on the 4-hour chart remains bearish because price continues to trade below longer-term moving averages. However, recent candles show that sellers are losing some momentum compared with the aggressive decline seen earlier. This creates an environment where both bulls and bears have valid arguments, making confirmation from future price action essential before any directional bias can be established.
This article is based only on the provided chart. Any indicators or market data not visible in the screenshot are intentionally not estimated or invented.
Market Overview
The chart reflects a market that has transitioned from bullish momentum into a corrective phase. After reaching approximately 68.990 USDT, HYPE experienced an aggressive sell-off that pushed price toward the 58.183 USDT area. Such rapid declines often trigger profit-taking, liquidations, and increased uncertainty among short-term traders.
The recent candles indicate that the market is attempting to stabilize rather than continuing its previous freefall. Stabilization alone does not confirm a trend reversal, but it is often the first requirement before buyers can regain confidence.
Current Market Data
According to the screenshot:
Asset: HYPE/USDT Perpetual
Current Price: 59.390 USDT
Mark Price: 59.415 USDT
24-Hour High: 60.747 USDT
24-Hour Low: 58.183 USDT
24-Hour Volume: 421.87K HYPE
24-Hour Turnover: 25.05 Million USDT
These values represent the market snapshot visible on the chart and should not be interpreted as live prices.
Background
Like many crypto assets, HYPE is influenced by market sentiment, liquidity, Bitcoin's overall direction, and speculative trading activity. Strong rallies are often followed by periods of correction as traders secure profits and leverage decreases throughout the market.
The recent decline shown on the chart reflects this normal market cycle rather than automatically indicating a long-term bearish trend.
Explanation of the Current Market Situation
The chart shows several important characteristics.
First, price experienced a rapid decline after failing near 69 USDT.
Second, selling momentum accelerated as consecutive bearish candles formed.
Third, buyers appeared near 58.183 USDT, preventing an immediate continuation lower.
Finally, the market has started moving sideways, indicating temporary equilibrium between buyers and sellers.
This transition from aggressive selling into consolidation often becomes an important decision zone.
Key Facts Visible on the Chart
Current timeframe is 4 Hours.
Price remains below the longer moving averages.
Recent candles are relatively smaller compared with the previous bearish impulse.
The MACD histogram remains negative but appears less aggressive than during the strongest part of the decline.
Trading activity continues as reflected by more than 25 million USDT in daily turnover.
Latest Developments
No external news or fundamental catalyst is visible within the screenshot. Therefore, no assumptions are made regarding announcements, partnerships, token unlocks, ecosystem developments, or protocol upgrades.
Industry Impact
Without verified external information, it cannot be concluded that this movement is driven by sector-wide developments. The decline may reflect normal market volatility, broader crypto weakness, or asset-specific trading activity.
Macroeconomic Impact
No macroeconomic event is identifiable from the provided chart. Broader economic factors such as interest rates, inflation data, or Federal Reserve policy could influence crypto markets generally, but no direct connection can be verified from this screenshot alone.
Crypto Market Impact
The chart illustrates how quickly crypto markets can transition from optimism into risk management. High volatility remains one of the defining characteristics of digital assets, requiring disciplined trading rather than emotional decision-making.
AI and Blockchain Relevance
HYPE operates within the blockchain ecosystem, where transparency, decentralized infrastructure, and digital asset innovation remain important themes. However, no AI-related catalyst is identifiable from the provided information.
Institutional Activity
No institutional buying or selling activity can be verified from the screenshot.
Whale Activity
No on-chain whale transactions or large wallet movements are visible in the provided image. Therefore, no conclusions should be drawn.
Investor Sentiment
Current sentiment appears cautious.
Short-term traders remain concerned because the trend is still below major moving averages.
Long-term investors may instead view stabilization after a large correction as an area worth monitoring, although confirmation is still required.
Valuation Analysis
The screenshot alone does not provide sufficient information to determine whether HYPE is fundamentally undervalued or overvalued. Any valuation assessment would require additional financial and ecosystem data.
On-Chain Analysis
No on-chain metrics are visible.
Wallet activity, staking, transaction volume, active addresses, exchange flows, and network utilization cannot be evaluated from the screenshot.
Fundamental Analysis
No verified protocol updates, governance proposals, revenue statistics, ecosystem growth figures, or adoption metrics are available within the provided chart. Therefore, no speculative conclusions are made.
Technical Analysis
Current Market Trend
The visible trend remains bearish because price continues trading beneath the longer moving averages.
However, bearish momentum appears weaker than during the sharp decline.
Moving Averages
Visible values include:
MA5: 59.273
MA10: 59.606
MA30: 63.215
EMA5: 59.394
EMA10: 60.036
EMA30: 62.514
Price remains below MA30 and EMA30, indicating that longer-term momentum remains negative.
RSI
The RSI indicator is not visible in the screenshot.
No RSI value should be assumed.
MACD
The MACD displayed on the chart remains below the zero line, reflecting bearish momentum.
However, the histogram bars appear smaller than earlier during the decline, suggesting that downside momentum may be weakening.
This alone does not confirm a bullish reversal.
Bollinger Bands
Bollinger Bands are not displayed.
No analysis can be provided without visible data.
Fibonacci Levels
No Fibonacci retracement tool is visible.
No Fibonacci support or resistance levels should be estimated.
Volume Analysis
The chart reports a 24-hour trading volume of approximately 421.87K HYPE.
Daily turnover is approximately 25.05 Million USDT.
Although trading activity remains healthy, detailed volume profile analysis cannot be performed from the screenshot.
Volatility Analysis
Recent price action demonstrates elevated volatility, with a decline from near 69 USDT toward 58 USDT over a relatively short period.
Higher volatility generally increases both opportunity and risk.
Bullish Scenario
If buyers continue defending the recent low while price gradually reclaims the short-term moving averages, market confidence could improve. Sustained higher lows and stronger buying volume would strengthen the recovery case.
Bearish Scenario
If sellers regain control and price falls below the recent low shown on the chart, bearish momentum could accelerate once again. Traders should monitor price action carefully rather than assuming support will always hold.
Neutral Scenario
The market may continue consolidating between buyers and sellers before choosing its next major direction. Sideways movement often follows strong impulsive declines.
Market Outlook
Short-Term Outlook
Cautiously neutral with bearish pressure still present.
Medium-Term Outlook
Recovery depends on reclaiming important moving averages and confirming higher highs.
Long-Term Outlook
Long-term direction cannot be determined from this chart alone and requires broader market and fundamental confirmation.
Key Technical Levels
Support
The visible chart shows buying interest near 58.183 USDT.
No additional support levels can be confirmed.
Resistance
Longer moving averages around the low-60 USDT region represent nearby technical obstacles visible on the chart.
No precise resistance beyond what is visible should be assumed.
Trading Strategy
Trend-following traders generally wait for confirmation before entering positions.
Risk management should include predefined stop-loss levels, appropriate position sizing, and avoiding excessive leverage.
Patience is often more valuable than attempting to predict exact market bottoms.
Investment Opportunities
Periods of consolidation following sharp corrections often become important observation zones. Investors should prioritize confirmation over speculation and evaluate both technical and fundamental developments.
Risk Management
Never risk more capital than you can afford to lose.
Use stop-loss orders.
Avoid emotional trading.
Monitor market news.
Diversify exposure.
Respect volatility.
Advantages
Healthy trading volume.
Signs that selling momentum may be slowing.
Active market participation.
Disadvantages
Trend remains below longer-term moving averages.
Recovery has not yet been confirmed.
Volatility remains elevated.
Challenges
Maintaining buyer confidence.
Breaking above key moving averages.
Avoiding renewed selling pressure.
Expert Insights
Professional traders often focus on confirmation rather than prediction. Strong recoveries usually require improving momentum, higher lows, increasing buying volume, and successful resistance breakouts instead of relying on hope alone.
Future Outlook
HYPE is approaching an important technical decision area. Whether this develops into a sustainable recovery or another leg lower will depend on future price action, trading volume, and broader cryptocurrency market sentiment. Until stronger confirmation appears, disciplined risk management remains the most prudent approach.
Key Takeaways
The dominant trend on the visible 4-hour chart remains bearish, but downside momentum appears less aggressive than before. Buyers are attempting to defend the recent low around 58.183 USDT, while longer-term moving averages continue to act as overhead resistance. The market is currently in a consolidation phase that could precede either a recovery or another decline, making confirmation essential before drawing strong directional conclusions.
Final Thoughts
The HYPE/USDT chart reflects a market in transition rather than one with a confirmed new trend. Traders should avoid making decisions based solely on expectations and instead rely on confirmed technical signals, disciplined execution, and sound risk management. Monitoring future price behavior around recent support and the longer-term moving averages will likely provide the clearest indication of the market's next significant move.
#HYPEUSDTMARKITINGANALYSIS
Market Update (18 July 2026)
HYPE/USDT is trading near 59.390 USDT on the 4-hour timeframe, according to the provided Gate.io chart. The market remains under pressure following a strong decline from the recent swing high around 68.990 USDT. Although selling pressure has dominated the trend, recent candles indicate that buyers are attempting to defend the lows around 58.183 USDT. At the time reflected in the screenshot, price is moving within a relatively narrow range after a sharp decline, suggesting that traders are closely watching for confirmation of either a recovery or another bearish continuation.
Executive Summary
HYPE has experienced a significant correction after failing to maintain its previous upward momentum. The visible trend on the 4-hour chart remains bearish because price continues to trade below longer-term moving averages. However, recent candles show that sellers are losing some momentum compared with the aggressive decline seen earlier. This creates an environment where both bulls and bears have valid arguments, making confirmation from future price action essential before any directional bias can be established.
This article is based only on the provided chart. Any indicators or market data not visible in the screenshot are intentionally not estimated or invented.
Market Overview
The chart reflects a market that has transitioned from bullish momentum into a corrective phase. After reaching approximately 68.990 USDT, HYPE experienced an aggressive sell-off that pushed price toward the 58.183 USDT area. Such rapid declines often trigger profit-taking, liquidations, and increased uncertainty among short-term traders.
The recent candles indicate that the market is attempting to stabilize rather than continuing its previous freefall. Stabilization alone does not confirm a trend reversal, but it is often the first requirement before buyers can regain confidence.
Current Market Data
According to the screenshot:
Asset: HYPE/USDT Perpetual
Current Price: 59.390 USDT
Mark Price: 59.415 USDT
24-Hour High: 60.747 USDT
24-Hour Low: 58.183 USDT
24-Hour Volume: 421.87K HYPE
24-Hour Turnover: 25.05 Million USDT
These values represent the market snapshot visible on the chart and should not be interpreted as live prices.
Background
Like many crypto assets, HYPE is influenced by market sentiment, liquidity, Bitcoin's overall direction, and speculative trading activity. Strong rallies are often followed by periods of correction as traders secure profits and leverage decreases throughout the market.
The recent decline shown on the chart reflects this normal market cycle rather than automatically indicating a long-term bearish trend.
Explanation of the Current Market Situation
The chart shows several important characteristics.
First, price experienced a rapid decline after failing near 69 USDT.
Second, selling momentum accelerated as consecutive bearish candles formed.
Third, buyers appeared near 58.183 USDT, preventing an immediate continuation lower.
Finally, the market has started moving sideways, indicating temporary equilibrium between buyers and sellers.
This transition from aggressive selling into consolidation often becomes an important decision zone.
Key Facts Visible on the Chart
Current timeframe is 4 Hours.
Price remains below the longer moving averages.
Recent candles are relatively smaller compared with the previous bearish impulse.
The MACD histogram remains negative but appears less aggressive than during the strongest part of the decline.
Trading activity continues as reflected by more than 25 million USDT in daily turnover.
Latest Developments
No external news or fundamental catalyst is visible within the screenshot. Therefore, no assumptions are made regarding announcements, partnerships, token unlocks, ecosystem developments, or protocol upgrades.
Industry Impact
Without verified external information, it cannot be concluded that this movement is driven by sector-wide developments. The decline may reflect normal market volatility, broader crypto weakness, or asset-specific trading activity.
Macroeconomic Impact
No macroeconomic event is identifiable from the provided chart. Broader economic factors such as interest rates, inflation data, or Federal Reserve policy could influence crypto markets generally, but no direct connection can be verified from this screenshot alone.
Crypto Market Impact
The chart illustrates how quickly crypto markets can transition from optimism into risk management. High volatility remains one of the defining characteristics of digital assets, requiring disciplined trading rather than emotional decision-making.
AI and Blockchain Relevance
HYPE operates within the blockchain ecosystem, where transparency, decentralized infrastructure, and digital asset innovation remain important themes. However, no AI-related catalyst is identifiable from the provided information.
Institutional Activity
No institutional buying or selling activity can be verified from the screenshot.
Whale Activity
No on-chain whale transactions or large wallet movements are visible in the provided image. Therefore, no conclusions should be drawn.
Investor Sentiment
Current sentiment appears cautious.
Short-term traders remain concerned because the trend is still below major moving averages.
Long-term investors may instead view stabilization after a large correction as an area worth monitoring, although confirmation is still required.
Valuation Analysis
The screenshot alone does not provide sufficient information to determine whether HYPE is fundamentally undervalued or overvalued. Any valuation assessment would require additional financial and ecosystem data.
On-Chain Analysis
No on-chain metrics are visible.
Wallet activity, staking, transaction volume, active addresses, exchange flows, and network utilization cannot be evaluated from the screenshot.
Fundamental Analysis
No verified protocol updates, governance proposals, revenue statistics, ecosystem growth figures, or adoption metrics are available within the provided chart. Therefore, no speculative conclusions are made.
Technical Analysis
Current Market Trend
The visible trend remains bearish because price continues trading beneath the longer moving averages.
However, bearish momentum appears weaker than during the sharp decline.
Moving Averages
Visible values include:
MA5: 59.273
MA10: 59.606
MA30: 63.215
EMA5: 59.394
EMA10: 60.036
EMA30: 62.514
Price remains below MA30 and EMA30, indicating that longer-term momentum remains negative.
RSI
The RSI indicator is not visible in the screenshot.
No RSI value should be assumed.
MACD
The MACD displayed on the chart remains below the zero line, reflecting bearish momentum.
However, the histogram bars appear smaller than earlier during the decline, suggesting that downside momentum may be weakening.
This alone does not confirm a bullish reversal.
Bollinger Bands
Bollinger Bands are not displayed.
No analysis can be provided without visible data.
Fibonacci Levels
No Fibonacci retracement tool is visible.
No Fibonacci support or resistance levels should be estimated.
Volume Analysis
The chart reports a 24-hour trading volume of approximately 421.87K HYPE.
Daily turnover is approximately 25.05 Million USDT.
Although trading activity remains healthy, detailed volume profile analysis cannot be performed from the screenshot.
Volatility Analysis
Recent price action demonstrates elevated volatility, with a decline from near 69 USDT toward 58 USDT over a relatively short period.
Higher volatility generally increases both opportunity and risk.
Bullish Scenario
If buyers continue defending the recent low while price gradually reclaims the short-term moving averages, market confidence could improve. Sustained higher lows and stronger buying volume would strengthen the recovery case.
Bearish Scenario
If sellers regain control and price falls below the recent low shown on the chart, bearish momentum could accelerate once again. Traders should monitor price action carefully rather than assuming support will always hold.
Neutral Scenario
The market may continue consolidating between buyers and sellers before choosing its next major direction. Sideways movement often follows strong impulsive declines.
Market Outlook
Short-Term Outlook
Cautiously neutral with bearish pressure still present.
Medium-Term Outlook
Recovery depends on reclaiming important moving averages and confirming higher highs.
Long-Term Outlook
Long-term direction cannot be determined from this chart alone and requires broader market and fundamental confirmation.
Key Technical Levels
Support
The visible chart shows buying interest near 58.183 USDT.
No additional support levels can be confirmed.
Resistance
Longer moving averages around the low-60 USDT region represent nearby technical obstacles visible on the chart.
No precise resistance beyond what is visible should be assumed.
Trading Strategy
Trend-following traders generally wait for confirmation before entering positions.
Risk management should include predefined stop-loss levels, appropriate position sizing, and avoiding excessive leverage.
Patience is often more valuable than attempting to predict exact market bottoms.
Investment Opportunities
Periods of consolidation following sharp corrections often become important observation zones. Investors should prioritize confirmation over speculation and evaluate both technical and fundamental developments.
Risk Management
Never risk more capital than you can afford to lose.
Use stop-loss orders.
Avoid emotional trading.
Monitor market news.
Diversify exposure.
Respect volatility.
Advantages
Healthy trading volume.
Signs that selling momentum may be slowing.
Active market participation.
Disadvantages
Trend remains below longer-term moving averages.
Recovery has not yet been confirmed.
Volatility remains elevated.
Challenges
Maintaining buyer confidence.
Breaking above key moving averages.
Avoiding renewed selling pressure.
Expert Insights
Professional traders often focus on confirmation rather than prediction. Strong recoveries usually require improving momentum, higher lows, increasing buying volume, and successful resistance breakouts instead of relying on hope alone.
Future Outlook
HYPE is approaching an important technical decision area. Whether this develops into a sustainable recovery or another leg lower will depend on future price action, trading volume, and broader cryptocurrency market sentiment. Until stronger confirmation appears, disciplined risk management remains the most prudent approach.
Key Takeaways
The dominant trend on the visible 4-hour chart remains bearish, but downside momentum appears less aggressive than before. Buyers are attempting to defend the recent low around 58.183 USDT, while longer-term moving averages continue to act as overhead resistance. The market is currently in a consolidation phase that could precede either a recovery or another decline, making confirmation essential before drawing strong directional conclusions.
Final Thoughts
The HYPE/USDT chart reflects a market in transition rather than one with a confirmed new trend. Traders should avoid making decisions based solely on expectations and instead rely on confirmed technical signals, disciplined execution, and sound risk management. Monitoring future price behavior around recent support and the longer-term moving averages will likely provide the clearest indication of the market's next significant move.
#HYPEUSDTMARKITINGANALYSIS