
Square
Following
Hot
News
Notifications
Profile
Share your thoughts
placeholder
Article
Buddy, go long on $ARIA now. Entry: 0.1700 - 0.1750 Stop-loss: 0.1620 Take-profit 1: 0.1828 Take-profit 2: 0.1950 Take-profit 3: 0.2100
post-image
ARIA+22.03%
Trenches
牛逼
牛
bade
b
牛逼
0x96...7777
Market Cap
$.
Change
.
24h Vol
$.
Holders
.
PIEVERSE
P
bade
b
PIEVERSE
0x0e...25a9
Market Cap
$.
Change
.
24h Vol
$.
Holders
.
STONK
S
bade
b
STONK
6GmA...UNgx
Market Cap
$.
Change
.
24h Vol
$.
Holders
.
ON
O
bade
b
ON
0x0e...1d48
Market Cap
$.
Change
.
24h Vol
$.
Holders
.
FLOAT
F
bade
b
FLOAT
Bv1a...BMmr
Market Cap
$.
Change
.
24h Vol
$.
Holders
.
What Are Market Makers? How Do They Affect Liquidity in the Cryptocurrency Market?

In cryptocurrency trading, when you click buy or sell, your order needs to be matched with other orders in the market. Market makers are among the key participants that provide market liquidity. They typically help market participants trade more easily by continuously offering buy and sell quotes.

First, what are market makers?

Market makers typically offer buy and sell quotes simultaneously within a certain price range, hoping to cover costs and risks through the bid-ask spread and other trading profits. But
post-image
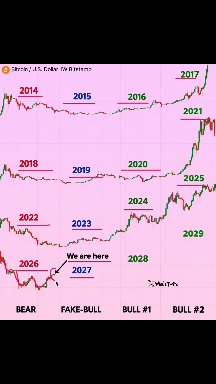
#BITCOIN'S 4-YEAR CYCLE IS BACK — IS 2027 THE TURNING POINT? 👀🔥
📊 LOOK AT THIS REPEATING PATTERN…
🔻 2014 → BEAR MARKET
🔄 2015 → RECOVERY
🐂 2016 → FIRST BULL PHASE
🚀 2017 → EXPLOSIVE RALLY
🔻 2018 → BEAR MARKET
🔄 2019 → RECOVERY
🐂 2020 → FIRST BULL PHASE
🚀 2021 → EXPLOSIVE RALLY
🔻 2022 → BEAR MARKET
🔄 2023 → RECOVERY
🐂 2024 → FIRST BULL PHASE
🏆 2025 → CYCLE TOP
🔻 2026 → BEAR MARKET?
🔄 2027 → RECOVERY?
🐂 2028 → FIRST BULL PHASE?
🚀 2029 → NEW CYCLE TOP?
⚠️ FOUR CYCLES. A SIMILAR FOUR-YEAR STRUCTURE.
🇺🇸 Here's the interesting part…
Every bear-market year shown here lines up wit
BTC-0.65%
$BTC The liquidation map for the past 30 days shows:

1. If Bitcoin falls to $73,720, the cumulative long liquidation intensity will be $579 million.
2. If Bitcoin falls to $72,708, the cumulative long liquidation intensity will be $1.459 billion.

3. If Bitcoin rises to $78,688, the cumulative long liquidation intensity will be $3.798 billion.
4. If Bitcoin rises to $79,240, the cumulative short liquidation intensity will reach as high as $5.025 billion.

Massive short positions will face liquidation as soon as this week, or by next week at the latest, and a surge driven by a short squeeze wi
BTC-0.65%
Write your Pi horror story: The day you almost lost passphrase, or sent Pi to wrong address, or deleted app. My horror: I almost reset phone without saving passphrase. What's yours?
#PiNetwork
#ShareWeekly
#GateSquare
#WCTCS9
post-image
PI-0.60%
market update
live-cover
LIVE2,893
Does a High Funding Rate Mean the Market Is About to Reverse?

In crypto perpetual futures markets, when funding rates remain elevated, many traders assume that longs are overcrowded and prices are about to fall. But a high funding rate is not a reliable reversal signal. The key is understanding what it reflects and what other evidence is needed.

First, what does a high funding rate indicate?

Under common perpetual futures mechanisms, a persistently positive and high funding rate usually indicates strong demand for long positions or that the contract is trading at a premium to spot. This may
post-image
Always Losing Trading Macro Data? What You Need Is “Response,” Not “Prediction”

The longer you stay in this market, the more you notice a pattern: people who are obsessed with predicting nonfarm payrolls and CPI data every day often end up getting liquidated. Why? Because they treat trading like buying lottery tickets.

With October’s CPI data coming out tomorrow night, I’d like to share the core principle of macro trading: stop predicting and focus on responding.

A lot of people are up all night, anxiously wondering: What if core CPI rises to 0.3% again? What if headline CPI surges to 4.0%?
BTC-0.65%
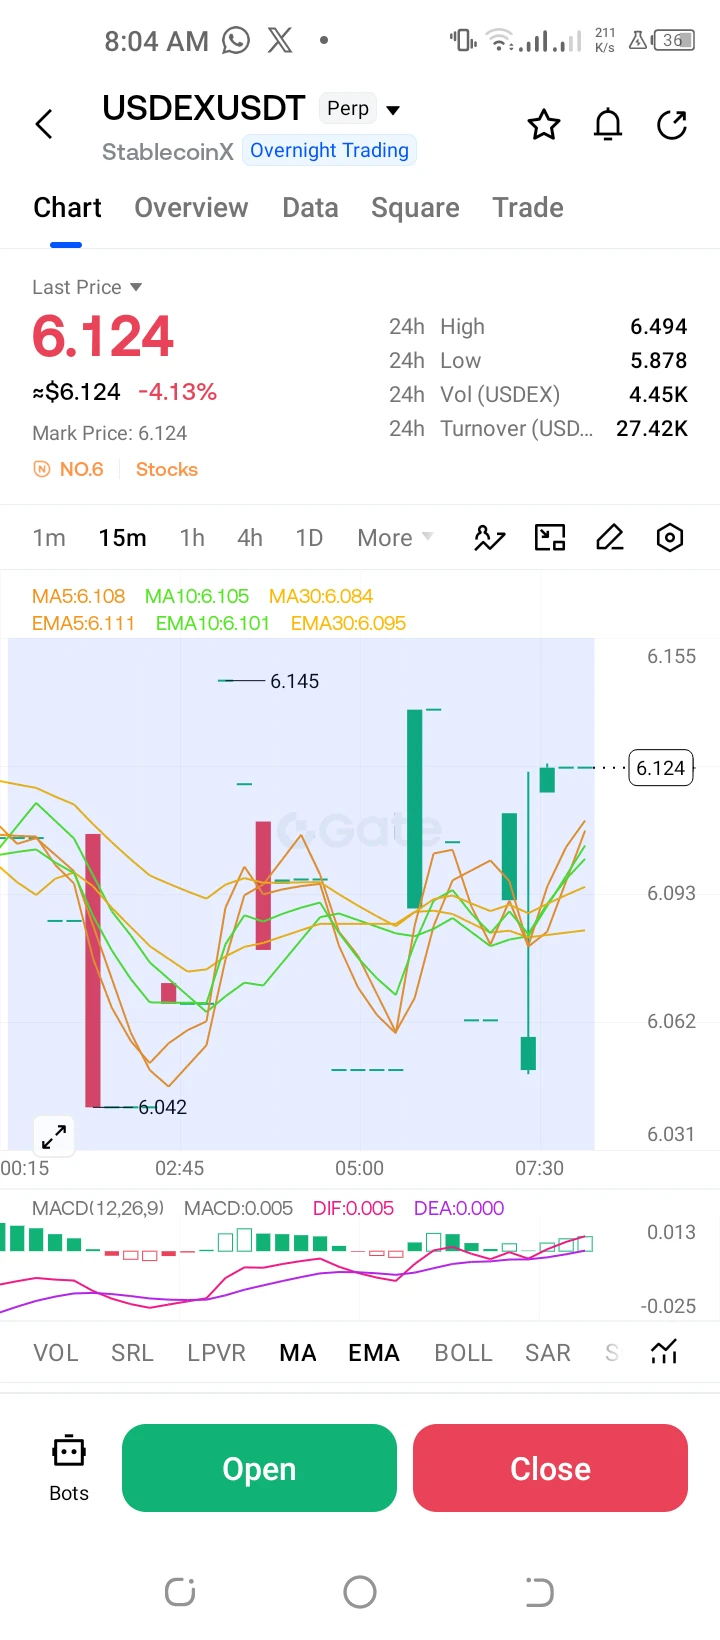
$USDEX /USDT Perp – "High Volatility Chop – Long"**
Trading Plan Long $USDEX
Entry: 6.124
SL: 6.031
TP1: 6.155
TP2: 6.494
USDEX is down -4.13% with massive erratic wicks. MACD is curling up slightly; targeting the 6.155 local resistance. Very high risk due to erratic candles.
post-image
USDEX+2.78%
  • 1
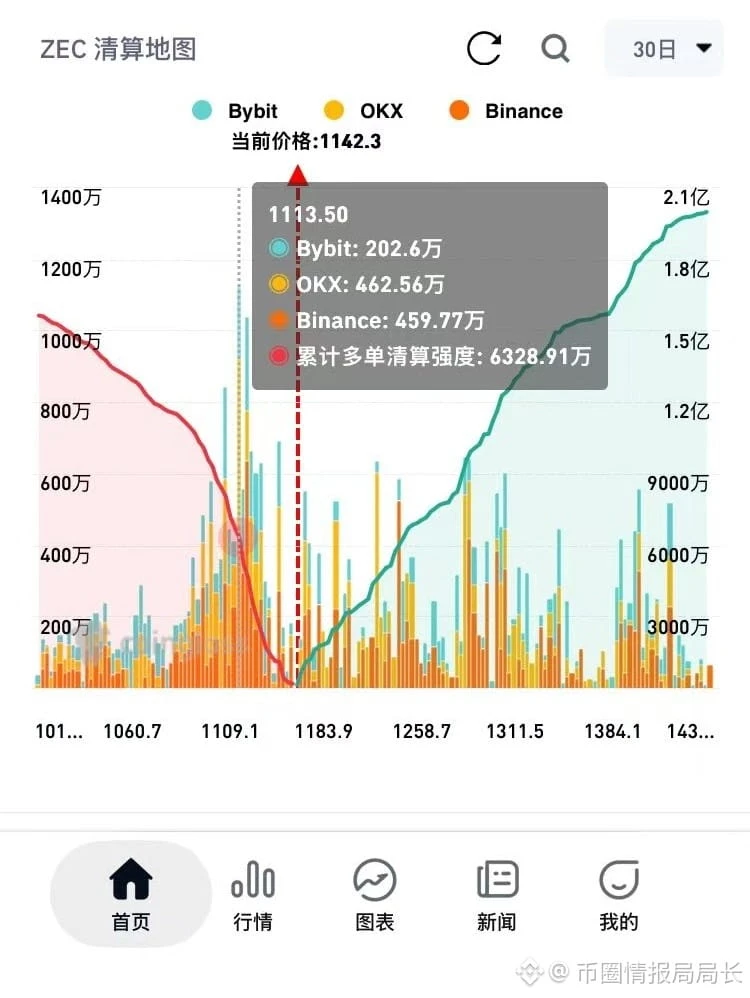
$ZEC The 30-day liquidation map shows:
1. If ZEC falls to $1113.5, cumulative long liquidation intensity reaches $63.28 million.
2. If ZEC falls to $1089, cumulative long liquidation intensity reaches $109 million!
3. If ZEC falls to $1065, cumulative long liquidation intensity reaches $126 million.

4. If ZEC rises to $1236, cumulative short liquidation intensity reaches $45.8 million.
5. If ZEC rises to $1307, cumulative short liquidation intensity reaches $124 million.
6. If ZEC rises to $1414, cumulative short liquidation intensity reaches $194 million.

ZEC is currently at $1152, with a r
post-image
ZEC+1.29%
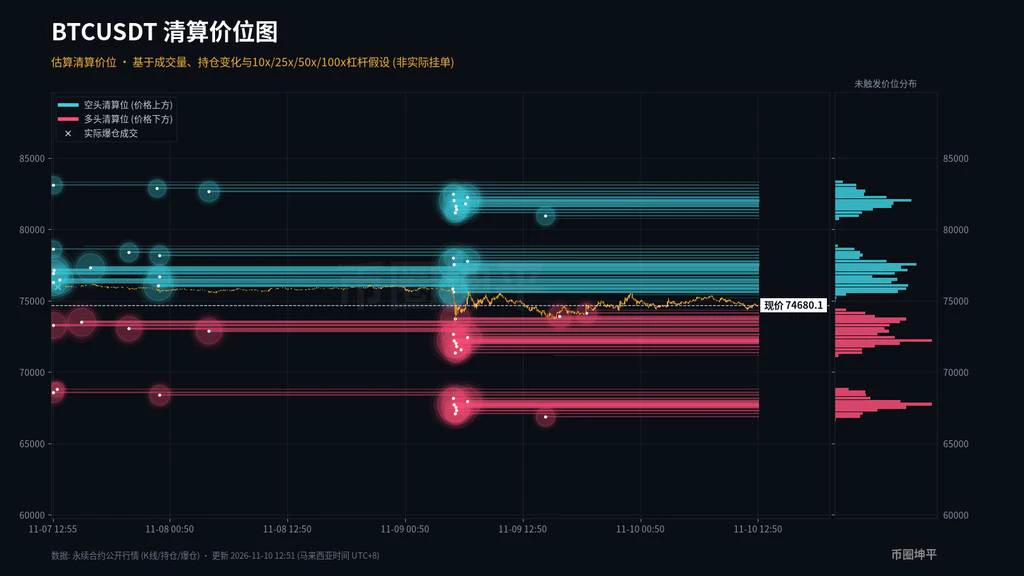
$BTC Still grinding below 75000, with several pushes higher getting stuck near 75400 before pulling back. The current price is around 74700, and today's low touched 73740. Estimated long liquidation levels are densely packed around 72000-73800 below. Above, 75800-78500 is the estimated short liquidation zone, with the largest cluster around 77500. If it can reclaim and hold 75800, I’ll be looking toward 77500; if it breaks below 73700, don’t rush to buy the dip. Which side are you leaning toward here? Share your thoughts.
post-image
BTC-0.67%
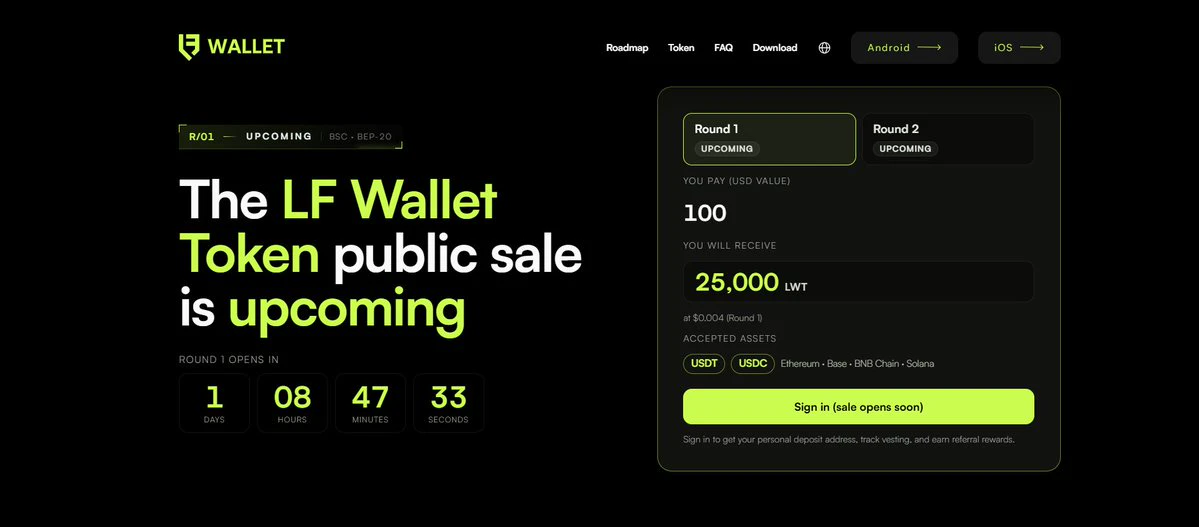
Good things are worth sharing. Here’s an interesting early-stage project: LF Wallet.

LF Wallet is currently raising $1.6 million to expand globally, and its app is already available on the Android and Apple app stores.

I took a look at its roadmap, and two things stood out.

One is content sharing. It plans to add a TikTok-like video feature, where users can share their thoughts directly on the platform.

The other is trading. Users will be able to trade on-chain tokens, stocks, forex, and other assets directly.

In short, the idea is to bring content, opportunity discovery, and actual tradi
post-image
$ZEC ‌
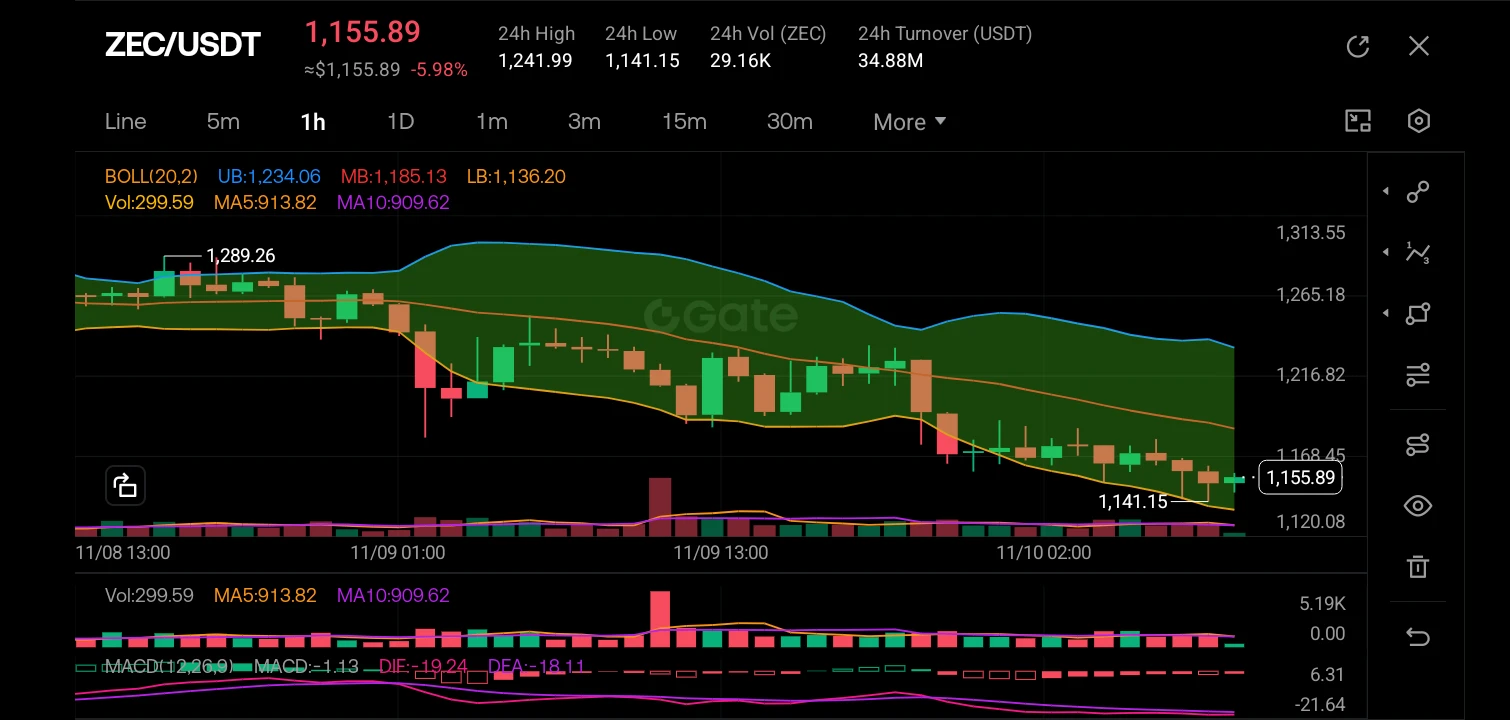
The market structure on the 1-hour timeframe has shifted from a consolidation phase to a clear bearish breakdown. After failing to sustain the highs near 1,289.26, the price action created a series of lower highs and lower lows, aggressively breaking below the middle Bollinger Band (MB: 1,185.13). The current structure is distinctly bearish as the price rides the lower Bollinger Band (LB: 1,136.20), indicating strong selling pressure and a lack of immediate buying interest at these levels.

Looking at the K-lines, the trend is heavy. We can see a strong impulsive red candle on 11/09 th
post-image
ZEC+1.16%
  • 2
#GateRanksThirdIn24HNetInflows
Gate Records $40.66M in 24-Hour Net Inflows, Ranking Third Globally
Market volatility continues to shape crypto sentiment, but capital movement across exchanges is another signal worth watching.

According to DeFiLlama data reported on November 9, Gate recorded approximately $40.66 million in net inflows over 24 hours, ranking third among centralized exchanges worldwide.

That is a notable snapshot, particularly in a market where traders are adjusting exposure and waiting for clearer direction.

However, exchange inflows need to be interpreted carefully. They sh
BTC-0.67%
  • 1
#AnthropicLaunchesNasdaqIPORoadshow
Anthropic’s IPO Could Become a Turning Point for AI Valuations
Anthropic’s planned Nasdaq listing is shaping up to be more than another major technology IPO. It could become a test of how much investors are still willing to pay for the AI growth story when the cost of delivering that growth becomes impossible to ignore.

For much of the AI boom, valuation discussions were driven by market share, model capabilities and explosive revenue expansion. Anthropic’s latest disclosures are pushing the conversation toward a different set of questions: how expensive i
NDAQ+1.29%
  • 1
🆕 stream crypt update
live-cover
LIVE1,435
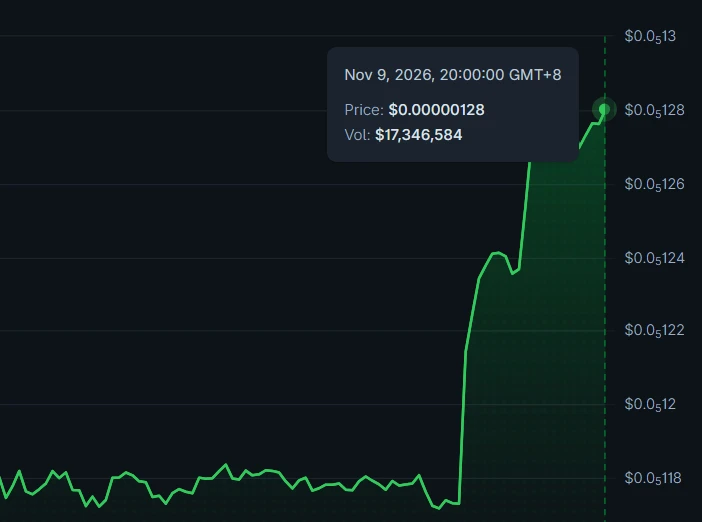
$APEPE returning to monke, scaling up the tallest tree
post-image
APEPE+0.25%
Load More

Join 40 M users in our growing community

⚡️ Join 40 M users in the crypto craze discussion

💬 Engage with your favorite top creators

👍 See what interests you

Trending Topics

USCPIDataIncoming

49.63k Views2.21k Discussing

The U.S. October CPI report will be released on November 10 at 8:30 a.m. ET. September CPI came in at 3.7% year over year, and markets will be watching closely for signs that inflation is cooling, especially in core CPI. A softer-than-expected reading could strengthen rate-cut expectations, while hotter inflation may pressure risk assets through higher Treasury yields and a stronger dollar. How do you think this CPI print will move $BTC, U.S. stocks and gold?

USIranTalksShowNewProgress

6.14k Views1.25k Discussing

KoreanStocksJumpOver5%

1.69k Views4.83k Discussing

View More