Square
Following
Hot
News
Profile
Share your thoughts
placeholder
Article
It's never too late to start again.
You can always do all the things you want to do just make sure you really go all the things work because one thing is for sure.
We won't be here forever, so enjoy every single day as it will be a lot keep going
post-image
FTX’s Bitcoin Mining Bet Gets New Life as Parent Raises €800M for AI
SWI Group has raised €800 million to expand its AI infrastructure, advancing its plan to repurpose FTX-backed Bitcoin miner Genesis Digital Assets.
On Oct. 12, the Amsterdam-listed company announced a capital increase backed by institutional investors, valuing the group at €6.1 billion and bringing total equity raised since March above €1 billion.
⚠️ Personal market analysis only. NFA — manage risk and DYOR.
Educational content, not investment advice or a recommendation to buy, sell, deposit, or withdraw any asset. No paid pr
post-image
BTC-0.29%
  • 5
  • 1
$US A 18% halving-style plunge over 24 hours, with the current price at 0.0097 and the low hitting 0.0088. In the sixth to eighth months after the past three halvings, small-cap coins have all undergone an average shakeout of more than 40%. This time, it has already fallen 22% from 0.0125, so it is only halfway there. Historical data is clear: in the 2016 cycle, the median retracement for similar coins was 47%; in the 2020 cycle, it was 39%. With macro liquidity tighter this time, I’m not betting that a 22% drop will be the end of it.
Looking at trading volume, the 110.5M volume has not contra
US-18.00%
$XLM XLM/USDT
Stellar (XLM) – Long-Term Bullish Outlook
Stellar (XLM) appears to be entering a long-term bullish trend, presenting a potential buying opportunity for long-term investors.
Potential Entry Zone: $0.16
Target 1: $0.30
Target 2: $0.50
The $0.16 area could offer an attractive entry point for traders looking to capitalize on a potential long-term upward move.
If bullish momentum continues and key support levels hold, XLM could gradually move toward the $0.30 and $0.50 targets.
Trade Scenario:
* Entry: Around $0.16
* First target: $0.30
* Second target: $0.50
* Outlook: Bullish i
XLM-4.36%
📈10.13 Midday Market Outlook📈
$ETH Strategy:
Chase long on a volume-backed breakout above 2500 from the right side, then move up the stop-loss.
Chase short on a volume-backed breakdown below 2463 from the right side, with a properly placed stop-loss.
After a pullback to 2416 confirms that support is valid, add one long position; place the stop-loss below 2380.
On the hourly timeframe, if 2500 holds, look toward 2550-2606 to the upside.
Watch 2568 above and open one short position there; place the stop-loss above 2606 if it breaks through.
Left-side wick orders: long at 2355, with a s
ETH-1.43%
#闪迪重挫6%存储股收跌 Short-term sentiment-driven pressure in the storage sector is likely to persist, while the fundamentals of a tight supply-demand balance remain intact in the medium term
I. Core drivers of this round of consecutive pullbacks
1. Multiple short-term negative factors hit simultaneously
Industry leaders such as SanDisk and Micron fell on 6 of 7 consecutive trading days. The trigger was a catch-up decline in the South Korean market after a holiday, the early termination of a $40 billion buyback plan by a major company, and heightened long-term supply concerns following ChangXin's break
post-image
SNDK-5.98%
Near market update
live-cover
LIVE2,223
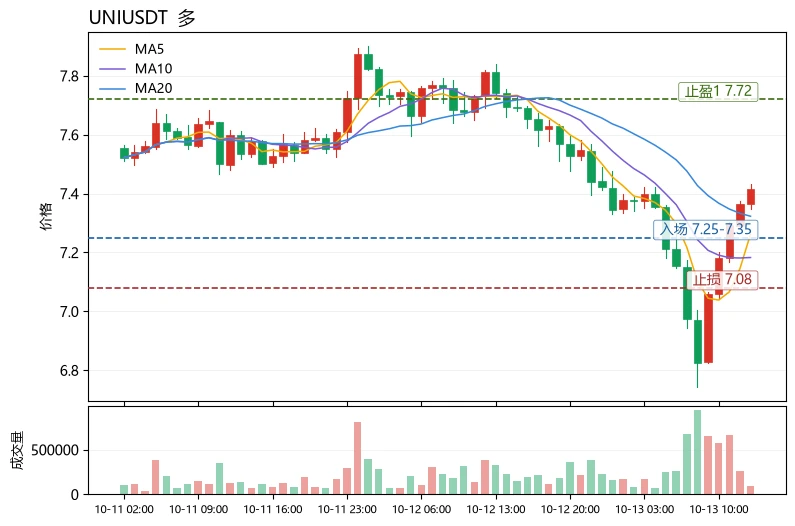
$UNI The moving averages are entangled, yet MACD has turned positive—is this a trend reversal or a false move?
First, the conclusion: Short-term bias is bullish, but this is only a rebound, not a trend reversal. UNI is currently at 7.414. MA5=7.2622 has attempted to cross above MA20=7.3231 but has not succeeded and remains below it. The moving-average system is converging after a bearish alignment, indicating that selling pressure is fading. The MACD histogram has turned positive at +0.02299, showing the initial emergence of bullish momentum after a golden cross below the zero axis. RSI=52.2 i
post-image
UNI-4.32%
OGN+17.54%
PUMP-13.51%
#ASMLTSMCQ3EarningsSoon and TSMC Q3 Earnings Could Shape the Next Big Move in the Semiconductor and Crypto Markets
The global technology market is approaching an important moment as investors prepare for the third quarter earnings reports from ASML and TSMC. These two companies play a critical role in the semiconductor industry, and their financial results could provide valuable insight into the direction of artificial intelligence, advanced computing, and global technology investment.
ASML holds a unique position in semiconductor manufacturing because its advanced lithography systems are ess
TSM-1.92%
ASML-1.76%
BTC-0.29%
  • 2
btc and today gainers update
live-cover
LIVE2,362
Recent summary:
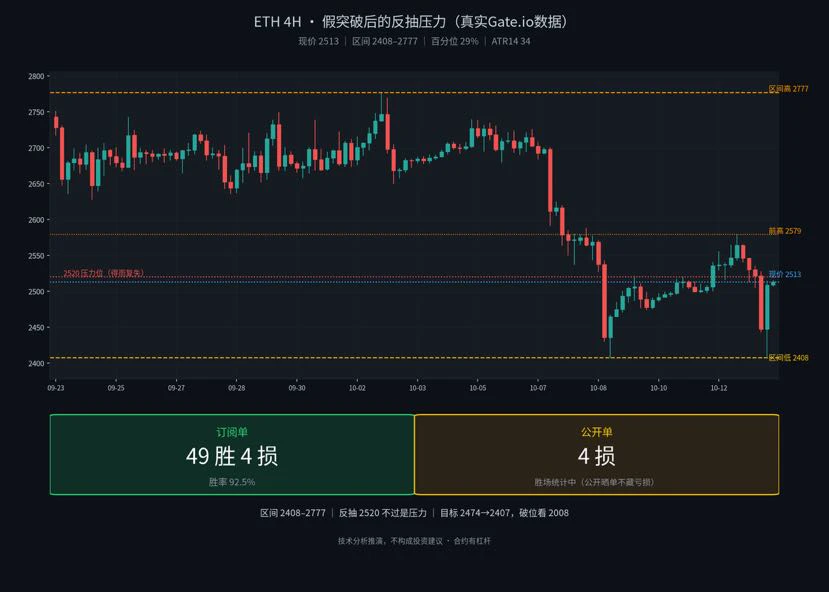
49 wins and 4 losses on subscription trades; 4 losses on public trades, with wins not counted
Shorted the top twice in a row (shorted 2748–2776 and 2574–2585)
Also, senior traders whose follower count is 8 times mine are welcome to follow and subscribe
Trading requires intense focus and is extremely mentally draining, but hard work definitely pays off. Balance work and rest.
Pushed up to 2579, then fell back to 2407 — don't chase longs. 2520 was reclaimed and then lost again; that's a false breakout.
The 4H range is 2408–2777. The rebound topped at 2579 and didn't even touch th
post-image
  • 3
#WillYouBuyDipInKoreanStocks Will You Buy the Dip in Korean Stocks
A market correction often creates a moment of uncertainty. Prices fall, investors become cautious, and the biggest question appears. Is this the beginning of a deeper decline, or an opportunity to enter the market at more attractive prices?
South Korean stocks have attracted attention from global investors because of the country's important position in the semiconductor, artificial intelligence, electronics, and technology industries. Companies connected to memory chips and advanced computing are playing an increasingly importa
  • 3
🔥 $HBAR
is showing signs of a potential bullish rebound after a sharp sell-off! Price dropped toward the $0.085 support zone before buyers stepped in and pushed it back above $0.088. If bullish momentum continues, HBAR could recover toward higher resistance levels. Watch for confirmation before entering! 🚀Take Profit : 0.10363Stoploss : 0.08518Long $HBAR 👇
post-image
HBAR-7.31%
BTC Technical Analysis Following Recent Correction
BTC experienced a sharp correction today, reaching a 24-hour low of 80,986.6 before rebounding. The current price is approximately 83,230.8, reflecting a 0.33% decrease over the last 24 hours.
Technical Data Analysis:
4-Hour Chart:
· Price Action: The rapid drop to 80,986.6 pushed the price below the Lower Bollinger Band (82,111.6), indicating oversold conditions. The price has since rebounded to the Middle Bollinger Band (83,098.5), which is currently acting as immediate resistance.
· Bollinger Bands (20,2): Upper Band: 84,085.3; Middle Band
BTC-0.29%
  • 1
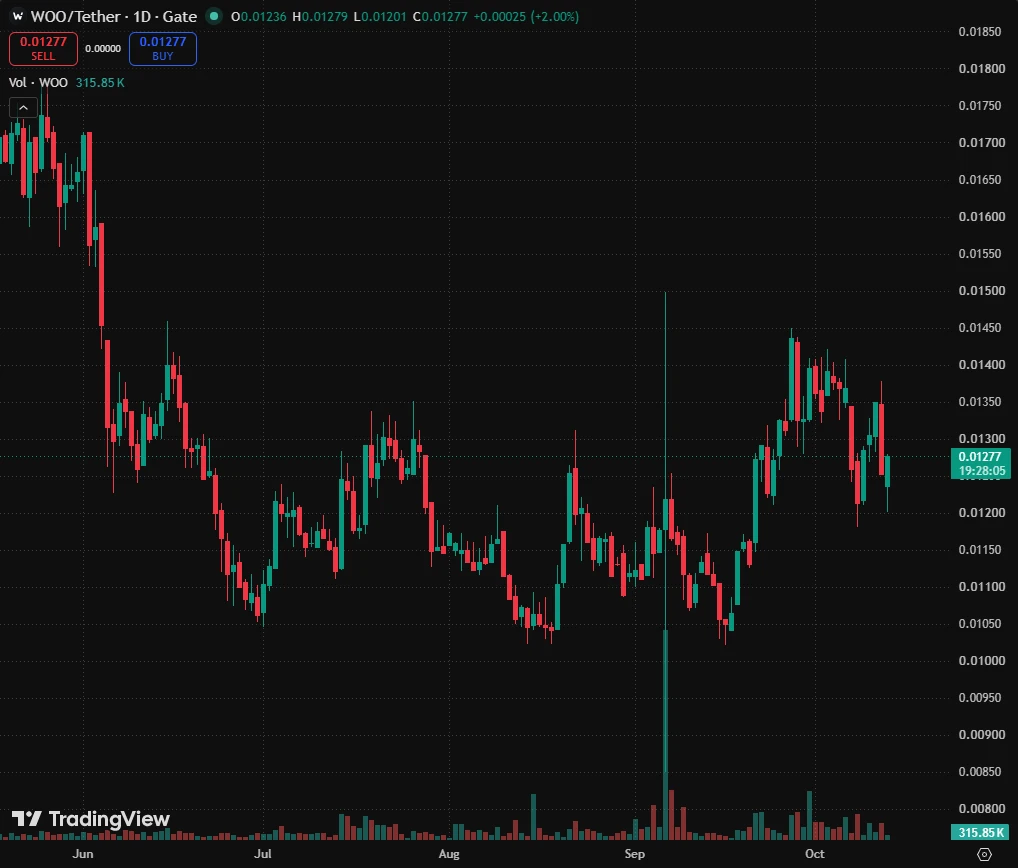
$WOO WOOUSDT: Pressing the 200 MA, Breakout Toward 0.02576 Next Leg
WOO keeps chewing through 0.013 and leaning on the daily 200 MA, like a dog pushing at a door that is about to give.
Fundamentals: WOO is a decentralized trading and liquidity network, now 99.3% below its all-time high. WOOFi TVL stands at $7.52M, up 2.6% over 30 days, while open interest is $1.34M, down 6% over 7 days.
WOO technicals: on the daily, price spent months inside a falling channel and has now pushed above its inner trendline. Right now it sits around 0.01273, grinding the 0.013 level and pressing into the 200 MA n
post-image
WOO-5.73%
Good morning, review
Continue holding the OP long and Nvidia short
Yesterday’s tech sell-off caused all markets to fall
Nvidia will soon recoup its losses
Stay the course
OP-4.01%
NVDA-1.27%
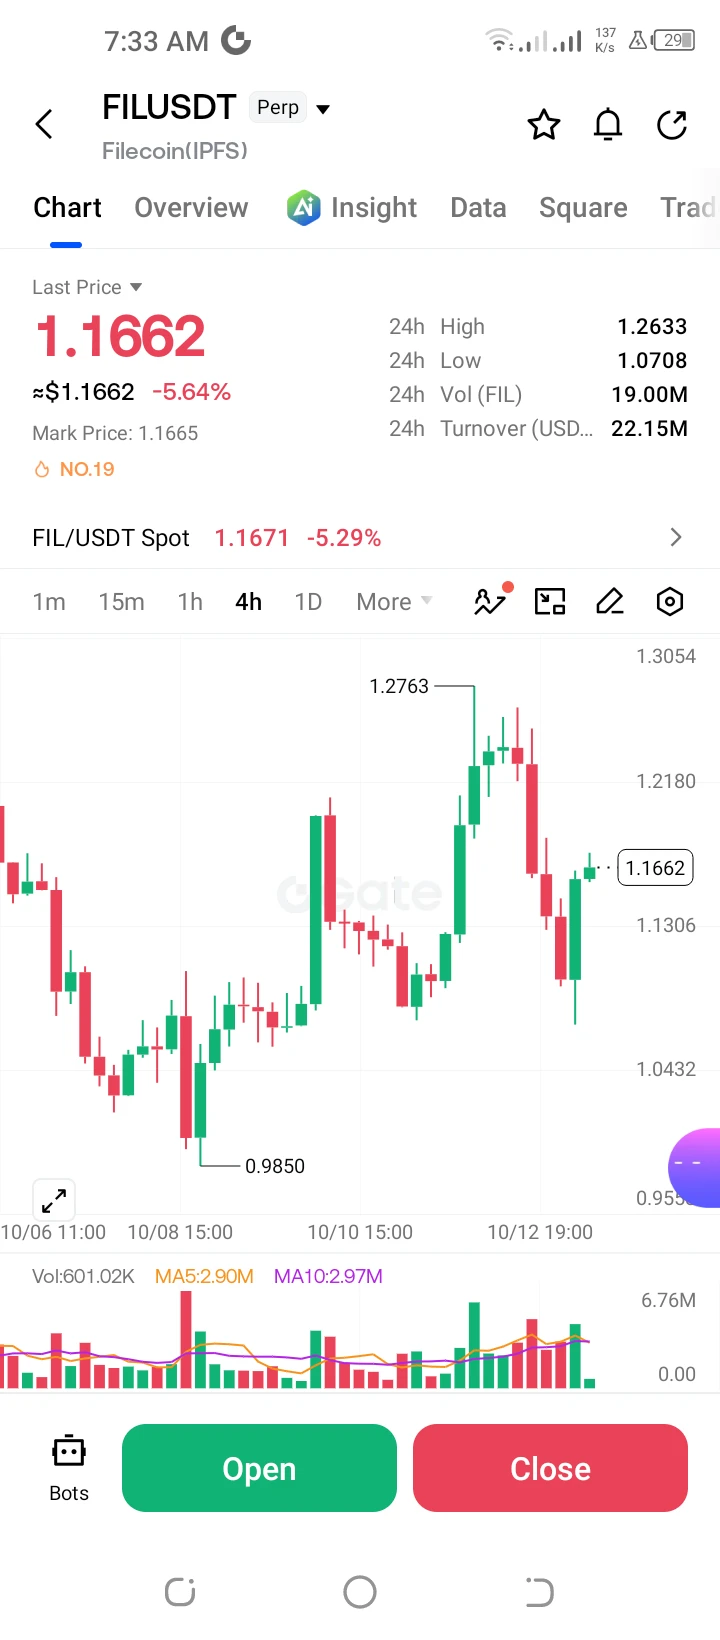
**$FIL /USDT Perp – "Sharp Rejection – Short"**
Trading Plan Short $FIL
Entry: 1.1800
SL: 1.2180
TP1: 1.1306
TP2: 1.0708
FIL is down -5.64% after a sharp rejection from the 1.2763 high. MACD is negative; targeting the 1.1306 low.
#ShareWeekly
post-image
FIL-6.10%
Gm chat - longs liquidated to start the day & now market will continue to pump hmm 🤔
post-image
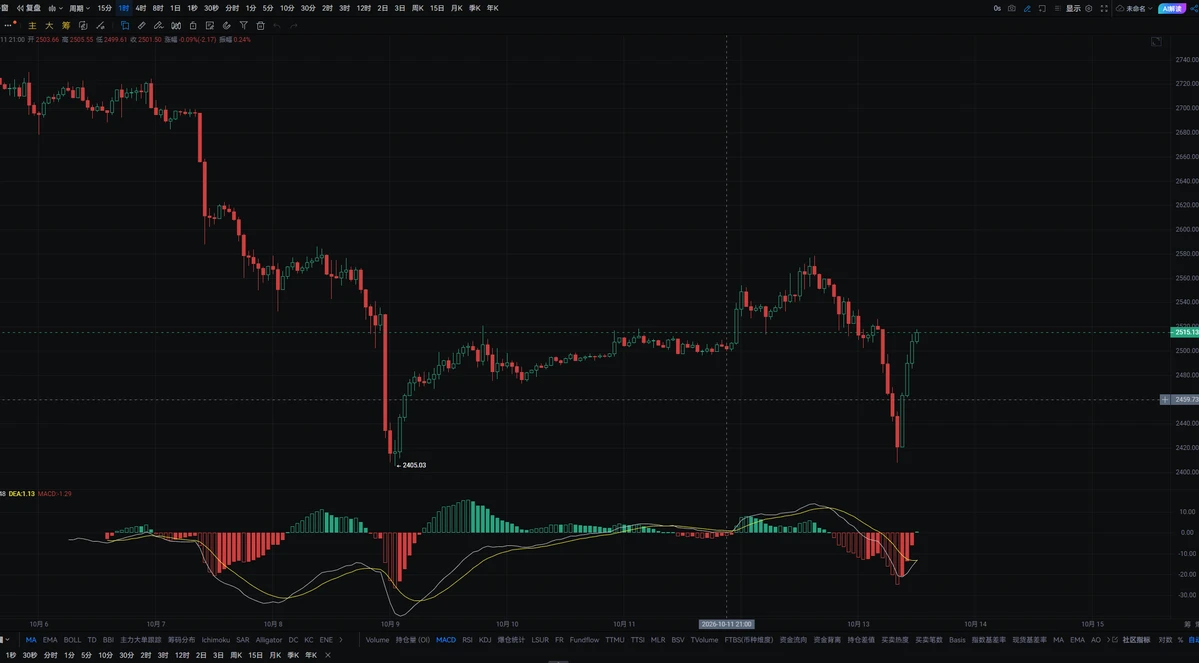
#ETH is currently priced at 2515, and its trend remains linked to BTC, moving sideways with fluctuations. Its independent momentum is relatively weak, and it has been moving slightly up and down intraday alongside Bitcoin. Short-term resistance is around 2570, which is the key pressure level for the recent rebound. To break upward, BTC needs to continue strengthening and capital needs to actively enter the market; ETH’s own buying pressure alone is unlikely to establish a firm position above this resistance. Support is around 2460. If BTC declines further, ETH is more likely to experience an a
post-image
ETH-1.13%
BTC-0.29%
Load More

Join 40 M users in our growing community

⚡️ Join 40 M users in the crypto craze discussion

💬 Engage with your favorite top creators

👍 See what interests you

Trending Topics

GateRanksTop2inCEXNetInflows

40.02k Views830 Discussing

According to DefiLlama, Gate ranked top 2 among global centralized exchanges by 24-hour net inflows at $12.21 million, with capital inflows remaining strong. What's your take? [👉 Read more](https://www.chaincatcher.com/article/2295824)

GateWCTCS9GlobalTradingCompetition

35.91k Views5.62k Discussing

SanDiskPlunges6%MemoryStocksFall

123.13k Views3.79k Discussing

View More