







Square
Following
Hot
News
Notifications
Profile
Share your thoughts
placeholder
Article
#BTCReboundFaces60KTest: What the Orderbook and Charts Are Telling Us

BTC bounced from the 55.1K low and is currently sitting around 59.2K. It briefly poked above 60K but couldn't hold it. Now the market is back to deciding what happens next.

Looking at the charts and the orderbook data, here is the current picture.

The path of least resistance isn't clearly upward right now. There are heavy sell walls stacked above the current price. According to CoinGlass, there is about 10,000 BTC in sell orders right at the 60,000 mark. If the price pushes through that, there is a much larger block arou
BTC-0.67%
  • 1
$AKT strong fundamental project with real demand and real revenue.

I'm DCAing akt for the long run.
buy and hold or put it in a bot until the market kicks off again.

other projects on my radar: $geod $fet #near ‌
AKT-0.10%
  • 1
  • 1
Trenches
IDOL
I
bade
b
IDOL
0x3b...ab07
Market Cap
$.
Change
.
24h Vol
$.
Holders
.
JAGENT
J
bade
b
JAGENT
0x8e...ae15
Market Cap
$.
Change
.
24h Vol
$.
Holders
.
PIEVERSE
P
bade
b
PIEVERSE
0x0e...25a9
Market Cap
$.
Change
.
24h Vol
$.
Holders
.
FIONA
F
bade
b
FIONA
B34n...pump
Market Cap
$.
Change
.
24h Vol
$.
Holders
.
mihao
m
bade
b
mihao
4Cxj...pump
Market Cap
$.
Change
.
24h Vol
$.
Holders
.
#GateAnnualGala 🎉 Gate Annual Gala Is Here!

The Gate Annual Gala is bringing the community together for a special celebration of another exciting year in crypto! 🚀

🏆 From memorable moments and achievements to creators, streamers, and community members, the Gala is a chance to celebrate everyone who has been part of the journey.

✨ Stay tuned for exciting highlights, recognition, rewards, and unforgettable moments from the event.

💙 Let’s celebrate the progress, passion, and future of the crypto community together!

#Gate #GateAnnualGala #Crypto #Web3
post-image
Vegas neon shines bright as Panzi once again goes Pole to Win, claiming victory at the Las Vegas Grand Prix! 🏆
The Gate-branded rear wing cuts through the night, racing from pole position all the way to the checkered flag.
Faster, stronger. 🏎️💨
  • 1
🔗 Campaign voting page: https://www.gate.com/zh/competition/Annual-Gala?ref_type=165&ch=Direct&ref=VVFEU1KOAG#Gate年度荣耀盛典
Thank you all for spotting the “Trading King Gao Yuliang” badge in the Square and casting your valuable vote for me. Let’s make the leaderboard together and move steadily forward in the market.
Meanwhile, our spot positioning has reached the final sprint—let’s position together!
post-image
  • 1
Now, every day the group says it’s “up” again!
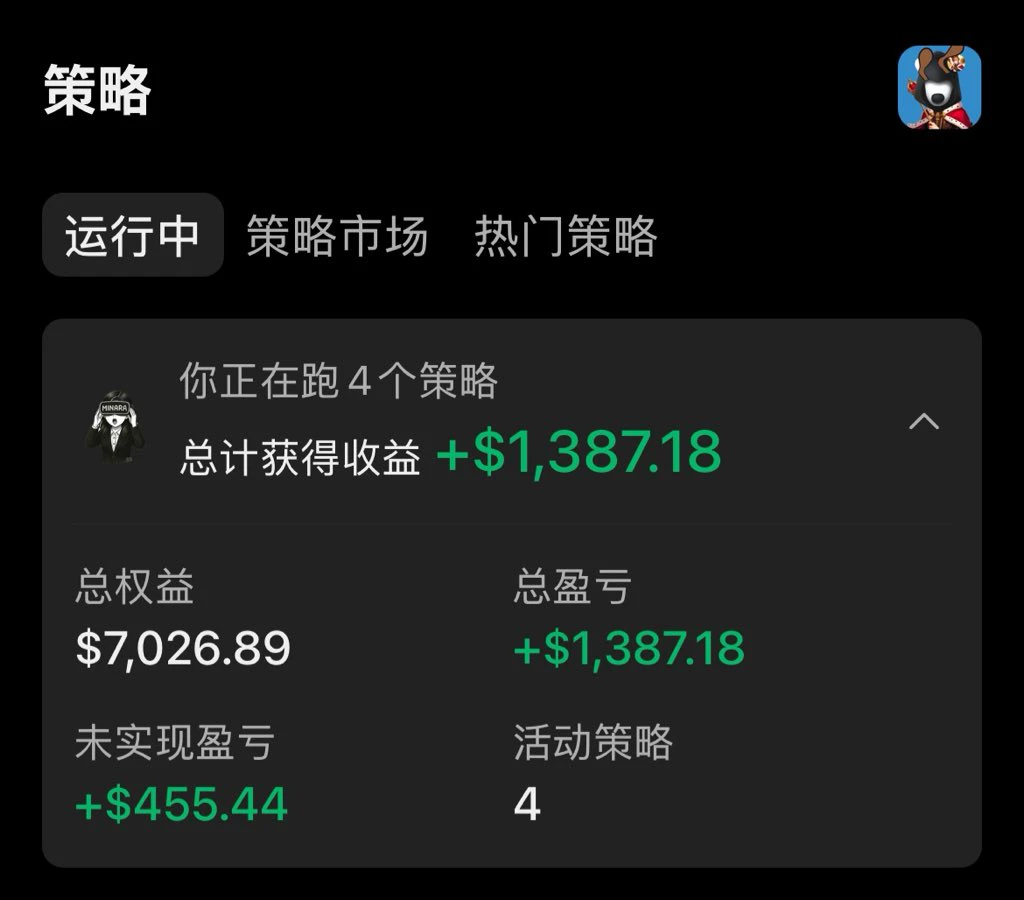
I haven’t traded manually in ages. AI has taken over my work and is even better at trading than I am. I just open my phone every day to check my profits!
I’ve got four AI strategies running right now, and they’re all profitable! But that’s not my end goal. Next, I’ll research new ways to make money, all using AI!
I’m going to make money with AI—that’s the only way to justify all the tokens I’m burning!
post-image
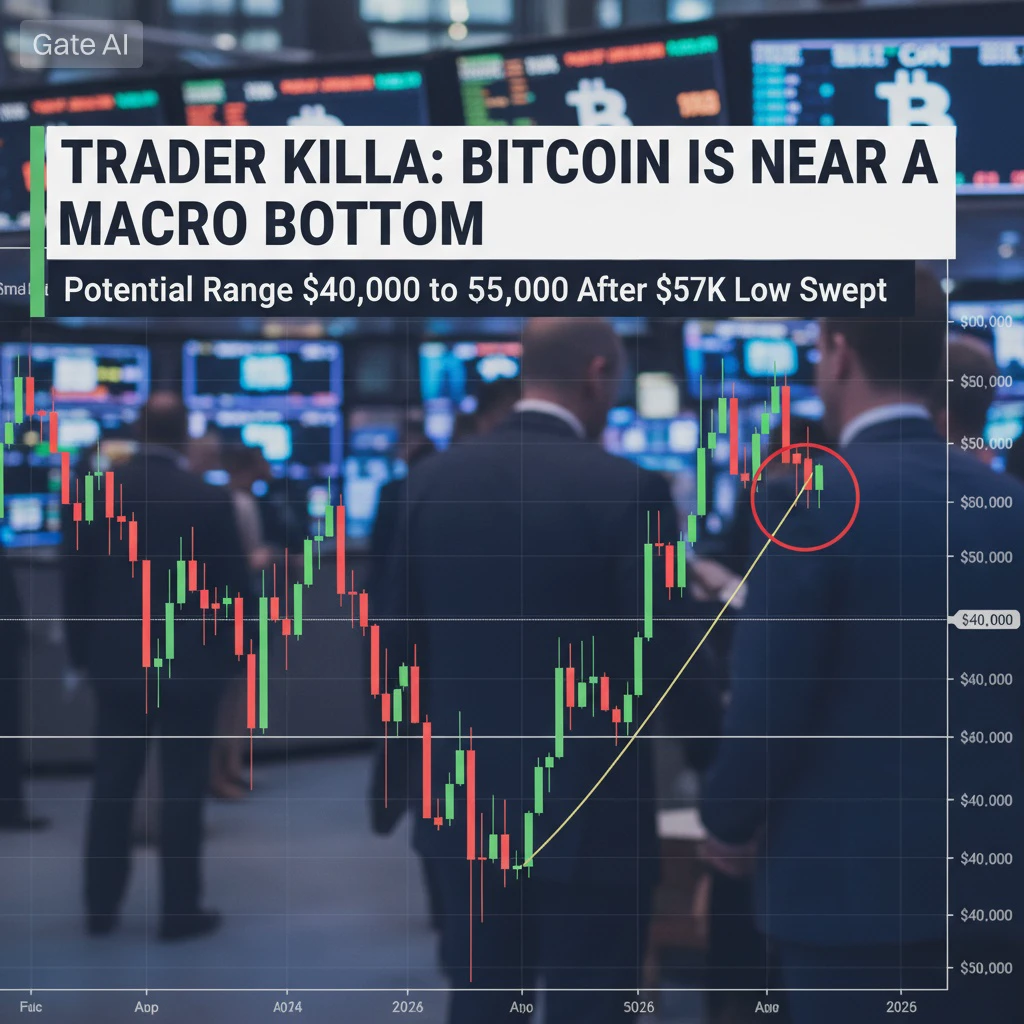
Trader Killa: Bitcoin Is Near a Macro Bottom — Potential Range $40,000 to $55,000 After $57K Low Swept
In the middle of one of Bitcoin’s sharpest drawdowns in recent years, quantitative trader Killa (@KillaXBT) has stepped forward with a clear, data-driven take that is cutting through the noise. Despite the current cycle running longer than previous ones, he argues Bitcoin is still tracking the classic four-year cycle pattern. More importantly, he says 81% of historical cycle metrics are now flashing that a macro bottom is close.

His key message: now that the $57,000 low has been swept, Bitc
post-image
BTC-0.67%
  • 1
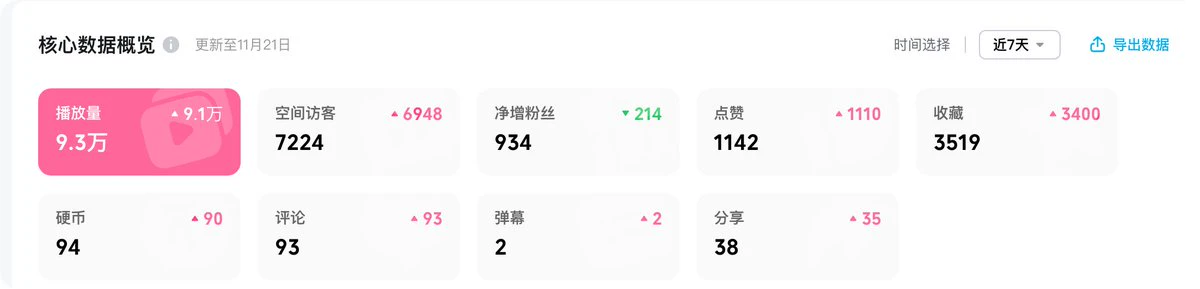
Working on growth really is satisfying; this positive feedback loop has me hooked.
post-image
I wanted to test the limits of Gemini 4 Neon and see if it could turn a classical Chinese poem into a world you can actually step into. First up: Ma Zhiyuan’s “Autumn Thoughts” from the “Tianjingsha” tune.

The small bridge and flowing stream aren’t just a background image—the water really flows, you can actually walk across the bridge, and dusk slowly gives way to moonlit night.

I built this with Gemini 4 Neon + Three.js.

I used to imagine poems as I read them. Now I want to step right inside.

What do you think of the recreation?

If you like it, I’ll open-source and deploy the website.
new market update
live-cover
LIVE2,449
BTC-0.67%
ETH-1.26%
USDC+0.01%
SOL-0.77%
Long $AIGENSYN , the 15-minute timeframe continues to rise strongly after repeatedly breaking through BOS structures, forming progressively higher highs and higher lows. Price is above EMA 20/50/100/200, indicating buyers are in control. Entry 1: 0.01494 – 0.01500 Entry 2: 0.01440 – 0.01450 Entry 3: 0.01410 – 0.01420 Take-profit 1: 0.01580 Take-profit 2: 0.01630 Take-profit 3: 0.01700 Stop-loss: 0.01380 Prioritize Entries 1 and 2, and wait for a price pullback and bullish confirmation signal. Entry 3 is a deeper buy zone and should only be triggered if price holds support and the bullish struc
post-image
AIGENSYN+1.18%
#USNOVJoblessClaimsBeatExpectations

WHY A 1,000-CLAIM TICK IN NOVEMBER CHANGES THE LABOR PICTURE

Earlier in the autumn of 2026, U.S. initial jobless claims dipped as low as 189,000—matching a multi-decade low—and kept headline fears about layoffs quiet. Now, following the U.S. Department of Labor report released on November 19, 2026, seasonally adjusted initial claims rose by 1,000 to 203,000 for the week ending November 14, above consensus estimates around 197,000 to 198,000. That small move from recent lows to a slightly higher-than-expected reading is the kind of shift markets watch clos
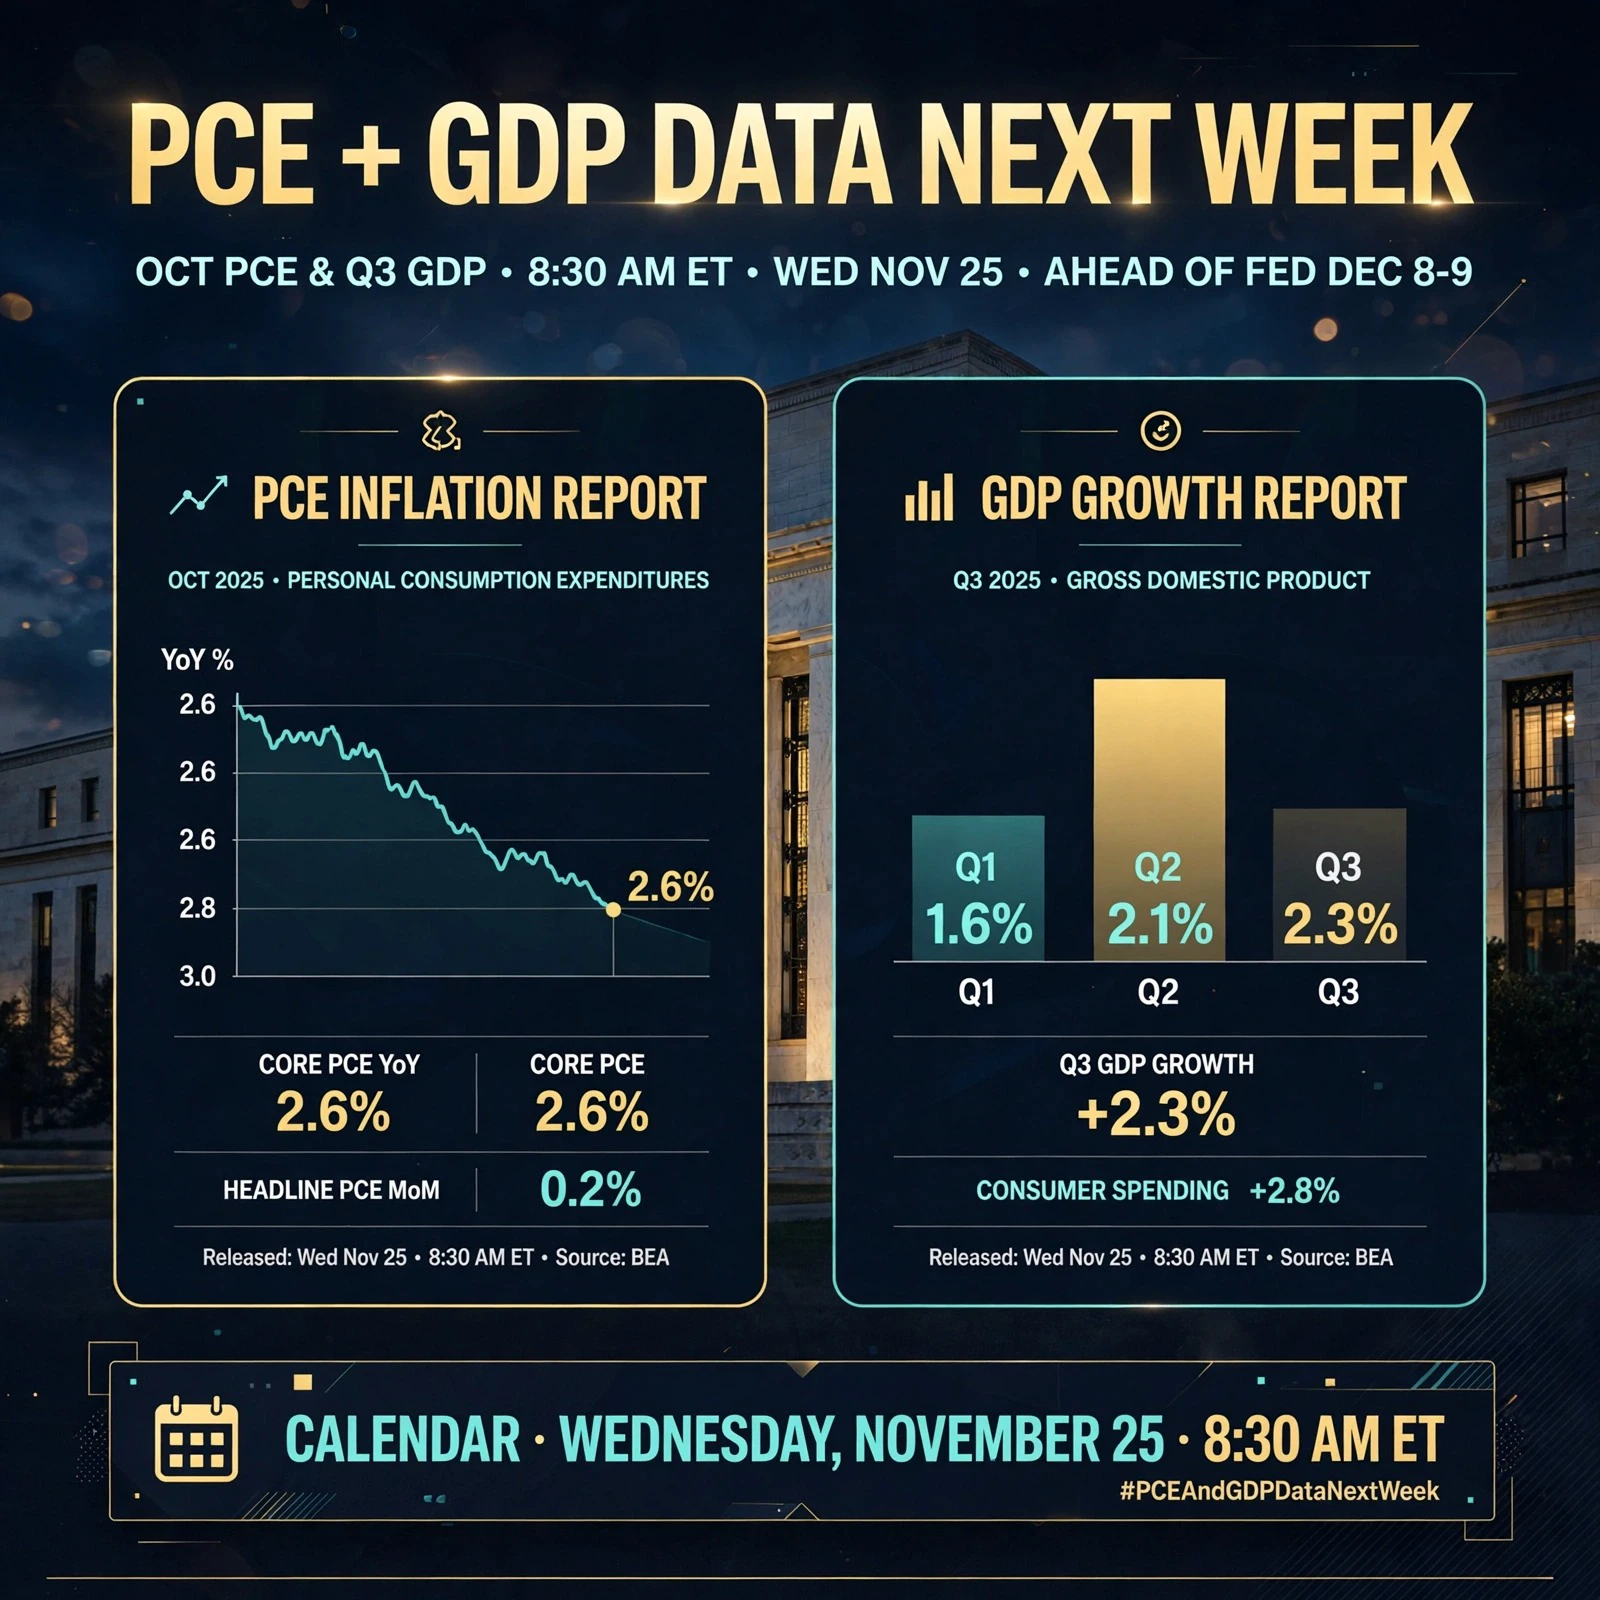
#下周PCE与GDP数据将揭晓
On Nov 25 at 21:30, US PCE, revised GDP, and personal spending are released simultaneously. There is little suspense over the direction of rate hikes; the focus is on the magnitude and path. Just watch these three columns: prices, growth, and asset correlations.

I. Information to watch
Next week has a set of data worth marking on the calendar in advance. According to CLS's investment calendar, on Nov 25 at 21:30, the US October Personal Consumption Expenditures Price Index, the revised annualized quarterly rate of real GDP for Q3, October personal spending, and durable goods
ANT-8.68%
BITCOIN MELTDOWN EXPLAINED: AI Stock Crash, Macro Storm & Gate.io Strategy!
live-cover
LIVE1,277
BTC-0.67%
$BTC
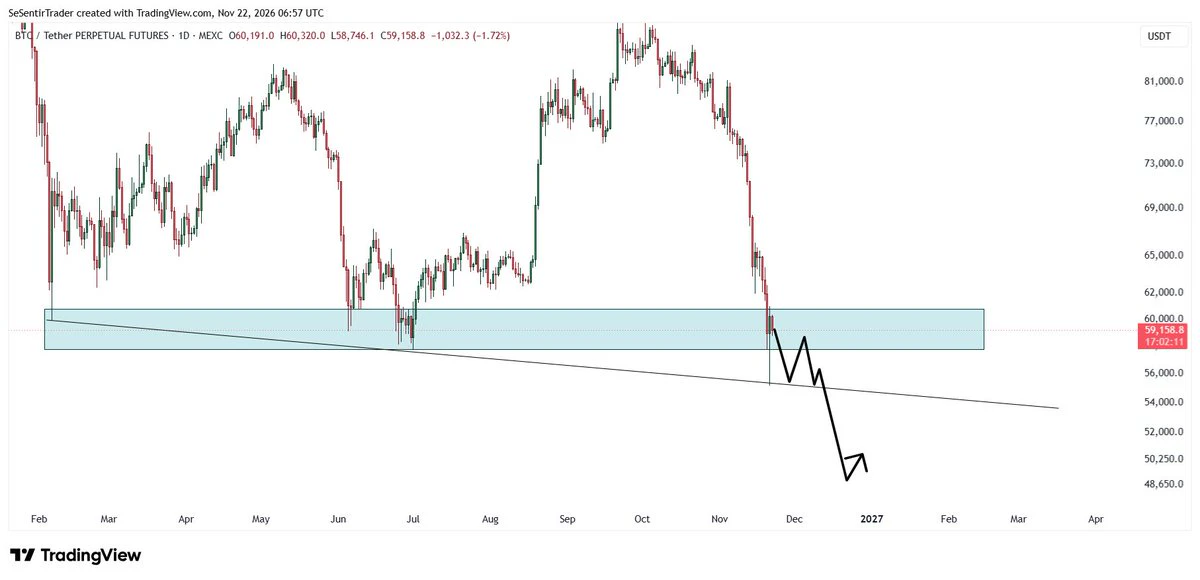
Bearish scenario
GM everyone, Bitcoin is now pretty likely to range between 55,000$ and 60,000$.
If we get back over 60,000$, this might indiate a potential revovery from here.
However, if Bitcoin has no reaction from here and stays under 60,000$, I will surely look for shorts.
post-image
BTC-0.67%
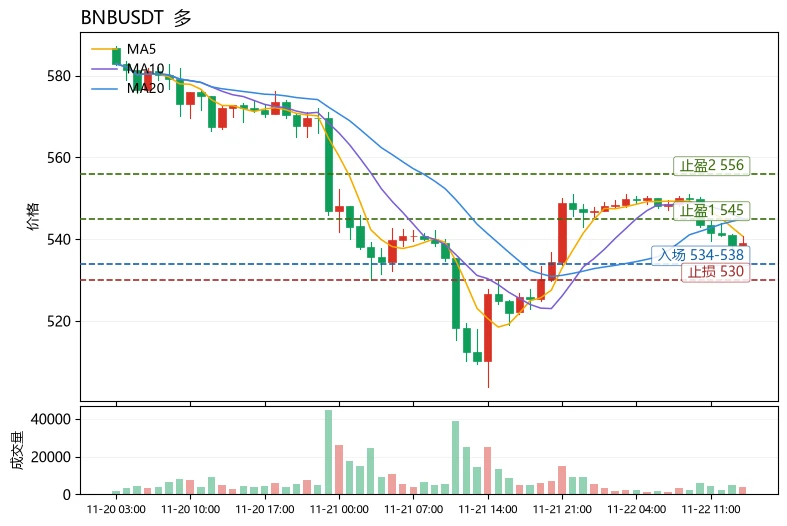
The most unusual detail in today's market is that $BNB rose 2.66% against the trend amid an extreme fear index reading of 11, while its funding rate hovered at 0.0000%—longs aren't willing to pay a premium, and shorts haven't gained an advantage either. This is a typical trading standoff, not a trend reversal. On the moving-average front, MA5=540.7 remains below MA20=545.0, the MACD histogram at -0.6163 remains bearish, and the RSI is just 42.9, indicating that the rebound is a recovery, not a reversal. However, the price is holding above the lower Bollinger Band at 533.8, and 24h trading vol
post-image
BNB-0.76%
ORCA-5.19%
ZEC+1.16%
#PCEAndGDPDataNextWeek
In the prior autumn stretch, U.S. real GDP grew at an annualized 3.4 percent in the advance Q3 reading while September headline PCE stood at 3.6 percent year-over-year and core PCE stood at 3.1 percent. Separating common myths from verified facts helps put both upcoming reports into clearer focus ahead of the Federal Reserve's December 8–9 meeting.
Admiral Markets
🔍 MYTH: A HOTTER ANNUAL INFLATION NUMBER ALWAYS MEANS PRICES JUST SPIKED

Myth: If a year-over-year inflation reading ticks higher, it proves consumer prices suddenly surged in that single month. Fact: A yea
post-image
BTC-0.67%
  • 3
#BTC反弹后再争6万美元关口 To be precise, this Bitcoin rebound looks more like a short-term recovery after a sharp drop and cannot yet be considered stabilization. $60,000 is the threshold for judging whether the rebound can continue, but whether to treat it as stabilization also depends on whether trading volume and capital flows follow through.

Why it should initially be viewed as a recovery
The rebound is driven mainly by passive factors: on November 21, Bitcoin bounced from a low of $55,127 to $60,523, with about $68.82 million in short liquidations in one hour, versus only $1.64 million in long liq
post-image
ThisIsTranslateContent:
#BTC反弹后再争6万美元关口 To be precise, this Bitcoin rebound looks more like a short-term recovery after a sharp drop than a sign of stabilization. $60,000 is the threshold for judging whether the rebound can continue, but whether it marks stabilization also depends on whether trading volume and fund flows follow through.
Why it should first be viewed as a recovery
The rebound is driven mainly by passive forces: On November 21, Bitcoin bounced from a low of $55,127 to $60,523. One-hour short liquidations totaled about $68.82 million, while long liquidations were only $1.64 million. The move was driven mainly by shorts closing positions, not by sustained buying from new buyers.
The funding picture has yet to strengthen: From November 2 to 17, U.S. spot Bitcoin ETFs saw cumulative net outflows of about $2.579 billion, while stablecoin market capitalization also contracted[8]. How to assess $60,000 alongside fund flows
$60,000 is just a threshold: Reclaiming it and then holding it on a retest would show that bears are temporarily unable to keep prices down. But reclaiming it could also be only a brief reprieve after short covering.
Trading volume needs to be strong and healthy: Rising volume during advances and declining volume during pullbacks would show that buyers are willing to step in at higher prices. If prices rise without volume following suit, the rally lacks a solid foundation.
Fund flows need to turn positive and stay that way: ETFs should shift from net outflows to net inflows for several consecutive days, with inflows gradually increasing; stablecoin market capitalization should stop falling and recover. A return to inflows for just one day followed immediately by a shift back to net outflows would indicate only a tentative move.
So: Only if Bitcoin holds above $60,000, ETFs see consecutive days of net inflows, and pullbacks come on lower volume can the move be considered a shift from a short-term recovery to stabilization. If it only reclaims $60,000, treat it as an oversold rebound for now.#WCTCS9 $BTC ‌

repost-content-media
BTC-0.67%
  • 2
Load More

Join 40 M users in our growing community

⚡️ Join 40 M users in the crypto craze discussion

💬 Engage with your favorite top creators

👍 See what interests you

Trending Topics

BTCReboundFaces60KTest

2.1M Views30.1K Discussing

BTC rebounded from around $55,300 on November 21, briefly reclaiming $60,000 before pulling back to around $59,300. The $60K level is back in focus as traders assess whether the recovery can last. Is this rebound a sign of stabilization or a short-lived recovery? Would reclaiming and holding $60K be enough, or do you need confirmation from trading volume and fund flows?

PCEAndGDPDataNextWeek

258.2K Views2.6K Discussing

GateDirectIPOPhase3ANTAllocates92100Shares

817.6K Views5K Discussing

View More