Square
Following
Hot
News
Notifications
Profile
Share your thoughts
placeholder
Article
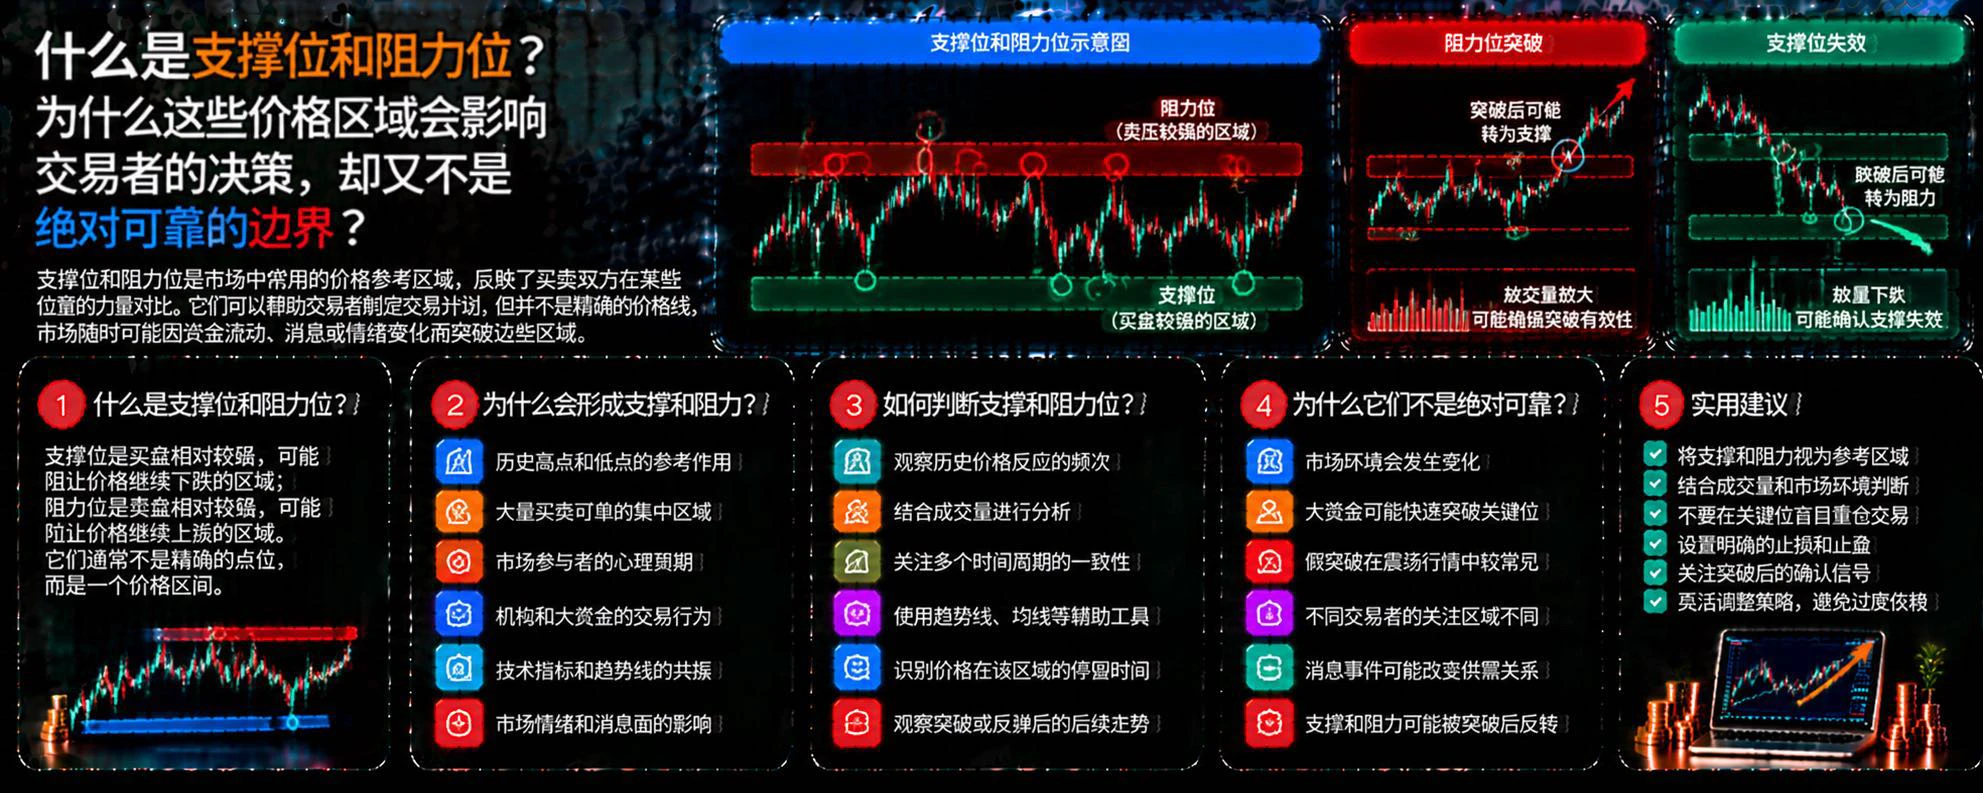
What are support and resistance levels? Why do these price zones influence traders’ decisions, yet are not absolutely reliable boundaries?

In crypto trading, prices often repeatedly bounce or pull back in certain zones. Traders usually call these zones support and resistance levels. They can help analyze market structure, but they do not guarantee that prices will bounce or reverse.

First, what are support and resistance levels?

A support level is a zone where buying pressure may increase and a price decline may temporarily slow; a resistance level is a zone where selling pressure may incre
post-image
#USJoblessClaimsBeatExpectations
US Jobless Claims Rise Above Expectations — A Cooling Labor Market Could Complicate the Fed’s Next Move

The latest US employment data introduces another important variable into an already complicated economic environment. Initial jobless claims increased to 200,000, exceeding market expectations of 194,000. Although the difference is relatively small, the reading adds to signs that the American labor market may gradually be losing some momentum.

However, the bigger picture requires careful interpretation. At 200,000 claims, unemployment filings remain histor
post-image
BTC-0.67%
SPX+0.33%
  • 1
  • 2
Trenches
mihao
m
bade
b
mihao
4Cxj...pump
Market Cap
$.
Change
.
24h Vol
$.
Holders
.
AGT
A
bade
b
AGT
0x5d...e274
Market Cap
$.
Change
.
24h Vol
$.
Holders
.
FOOD
F
bade
b
FOOD
FTu5...pump
Market Cap
$.
Change
.
24h Vol
$.
Holders
.
IDOL
I
bade
b
IDOL
0x3b...ab07
Market Cap
$.
Change
.
24h Vol
$.
Holders
.
AI
A
bade
b
AI
2T56...pump
Market Cap
$.
Change
.
24h Vol
$.
Holders
.
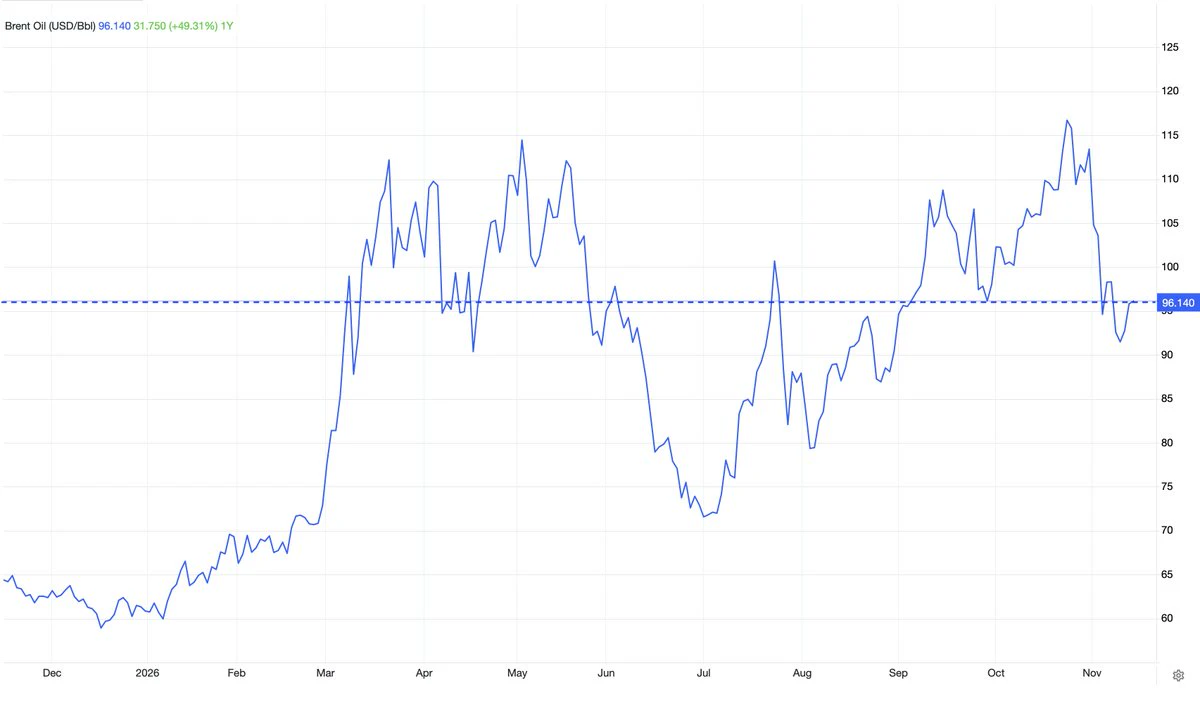
Brent rose to $96 as hopes for a U.S. Iran deal faded. Iran’s military reported that four tankers had struck mines in the Strait of Hormuz, while the Houthis reported attacks on Saudi oil facilities.
post-image
crypto market update btc
live-cover
LIVE2,433
GM #bitcoin gurus
How many 100k posts deleted today ?
$btc made simple 2 months ago
Join US on discord and avoid getting rekt following the X herd
#紅白歌合戦
post-image
BTC-0.67%
You have to pick up the bloodied chips, but it’s still early.
post-image
#BTCD #ALTCOIN
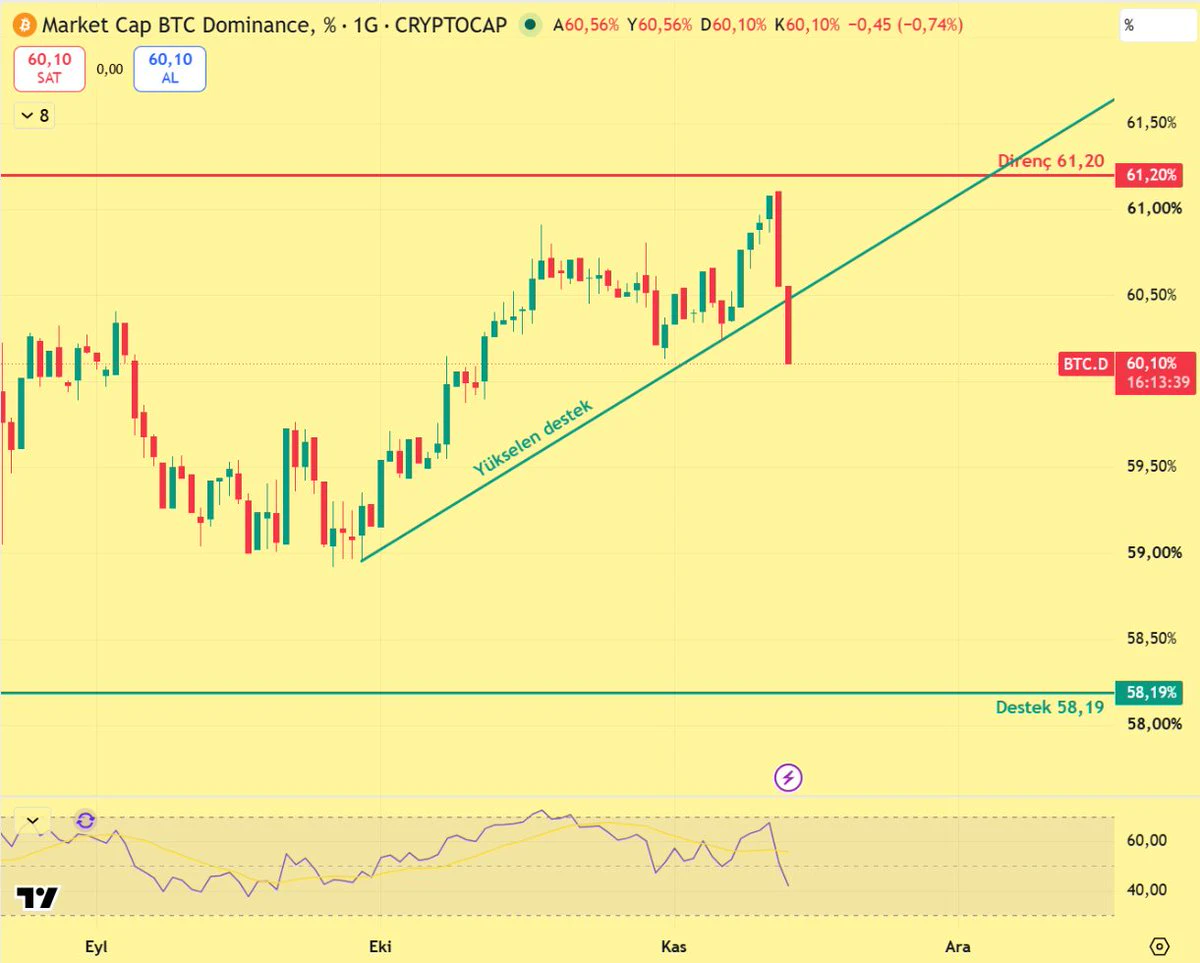
Bitcoin is falling, and dominance is falling too.
Friends, Bitcoin dominance bounced from 61.10 on Thursday and fell to 60.10 on Friday morning. It dropped below the rising support line in place since late September.
This means Bitcoin is falling, but altcoins are falling less than Bitcoin. On Friday morning, Bitcoin fell 3.6%, while Solana fell 1.8%, XRP fell 1.2%, and Pepe was in the green.
If the daily close comes below the line, the 58.19 level I marked on the chart will be the target. This means altcoins are strengthening against Bitcoin. It does not mean they are rising in
post-image
BTC-0.67%
SOL-0.77%
XRP-1.15%
PEPE+0.97%
What is statistical arbitrage? How can historical relationships between assets be used to identify trading opportunities, and why might historical correlations suddenly break down?

In the cryptocurrency market, some assets have displayed similar price movements over long periods. When their historical relationship temporarily diverges, traders may try to capitalize on that divergence. This is the basic idea behind statistical arbitrage, but historical patterns do not guarantee future repetition.

First, what is statistical arbitrage?

Statistical arbitrage is a type of trading strategy that u
post-image
The fear index plunged to 20, and the market couldn’t even manage one decent relief bounce.
$BTC wicked down to 68307, with the maximum intraday drawdown nearing 7%; $287 million in positions was wiped out within an hour, 97% of them longs. ETFs have seen net outflows for 6 consecutive days, with over $2 billion quietly pulled out. 69000 is now a hurdle; if it can’t reclaim that level, keep an eye on 67000 and 65000.
$ETH also failed to hold 2000, bottoming near 1922. It’s down nearly 15% over four weeks, and ETFs have bled for 5 consecutive days. 2000 has turned from a floor into a ceiling;
post-image
BTC-0.67%
ETH-1.26%
ZEC+1.16%
What Is the Long/Short Ratio? Why Doesn’t a Higher Number of Longs Mean the Market Will Definitely Rise?

In cryptocurrency trading, many people see the long/short ratio rise and assume bullish sentiment is strengthening, then choose to go long. But market sentiment does not always align with actual price movements. The long/short ratio can help us understand traders’ position bias, but it cannot directly determine how the market will move next.

First, what is the long/short ratio?

The long/short ratio measures the relative proportion of long and short positions in a particular market. Howev
post-image
New York Fed President John Williams sees further rate hikes as likely: the economy is strong and inflation remains persistent.
The U.S. budget deficit was $404 billion in October. Adjusted for November payments shifted into October, it was $285 billion, up 49% year over year.
post-image
Why can forced liquidations make a market decline even worse?

In crypto markets, prices sometimes just start to fall, then suddenly drop much further. A large number of positions are forcibly liquidated, more sell orders enter the market, and prices fall further, triggering a series of sharp moves.

Behind this may be a market mechanism known as a “liquidation cascade.”

First, leverage amplifies the impact of price movements on accounts.

When using leverage, traders only need to put up a portion of the margin to open a larger position. As a result, the same price movement typically has a gr
post-image
Do you know what makes us happy about being in the market? It’s when our thoughts and perspectives help people around us avoid losing money, avoid taking losses, and avoid handing their money over to others in the market. Honestly, those little thank-yous we receive really make my heart swell
Do you believe me when I say the next Bitcoin cycle will be the last one for making profits
Get ready to g-g-get rich together
[NEW STREAMER]market update
live-cover
LIVE4,439
putting all my money in bitcoin here so that I won't have to pay any unrealised gains tax anytime soon
post-image
BTC-0.67%
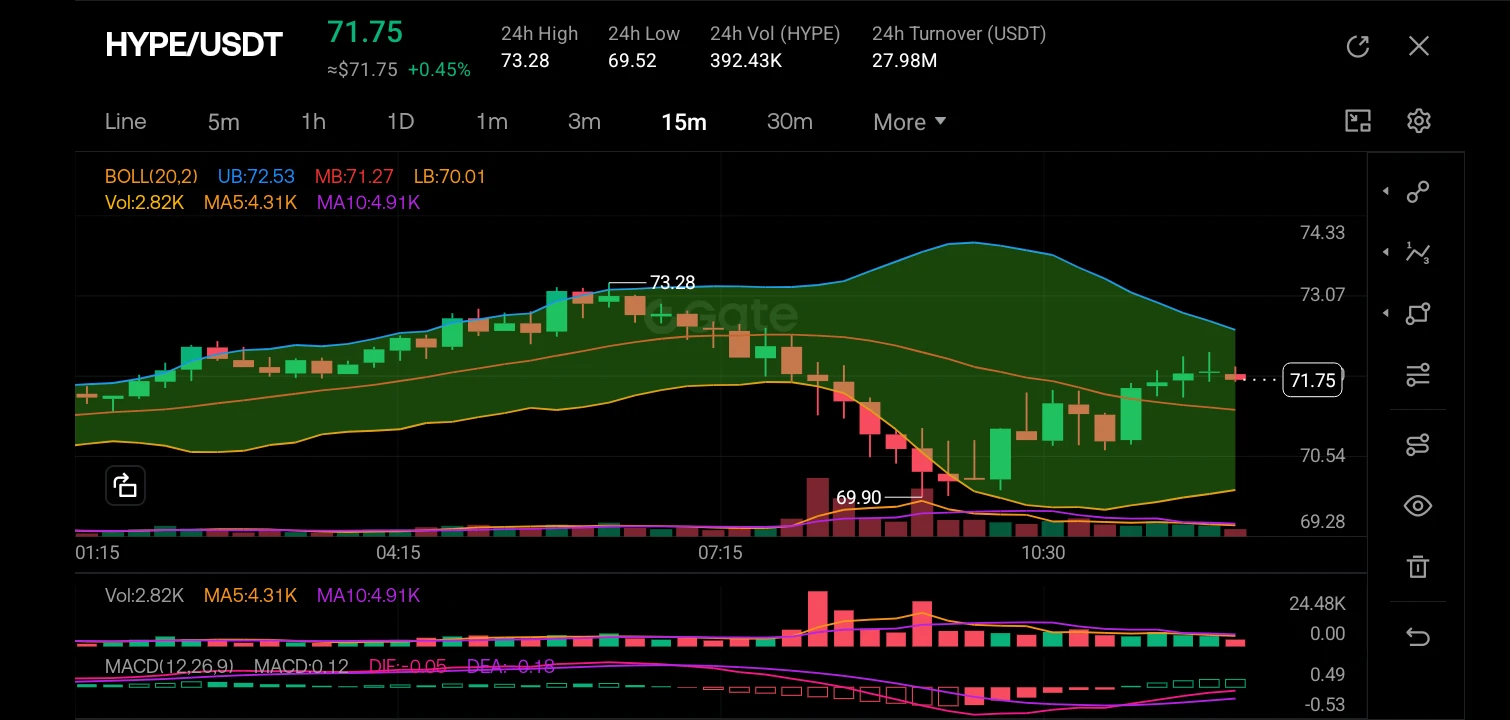
$HYPE
The market structure has recently shifted from a sustained bullish uptrend to a corrective bearish phase. Price formed a local peak at 73.28 and aggressively sold off, breaking below the middle Bollinger Band (MB: 71.27). However, the most critical structural event is the price action around 10:30, where the price pierced the lower Bollinger Band (LB: 70.01) and wicked down to a low of 69.90. Since that dip, the K-lines show a change in character: the price has rejected the lower boundary and is now printing higher lows, consolidating back toward the mid-band. The volume profile confirm
post-image
HYPE+0.24%
  • 2
  • 1
SOL’s downside thesis from this morning’s outlook played out across the board, with the market blowing straight through the take-profit target.
The morning call gave a high-short setup at 81.5–82.0. Price peaked at 81.07 before promptly pulling back, then fell to 77.83. The levels were pinpoint accurate, and the downside far exceeded expectations.
True market intuition means knowing the resistance and support levels inside out: where price will turn and where it will break—all under control. #sol #黄仁勋辞职
SOL-0.77%
  • 2
#BTC跌4%

In my view, the area **$70K is becoming an important zone** for observing Bitcoin's movements. I prefer to wait for confirmation rather than rush to buy while the price is still under bearish pressure.

My strategy is to accumulate gradually if a strong reversal signal appears around $70K. However, if BTC manages to hold above $73K again, that could be an early confirmation that bullish momentum is starting to return.

For me, protecting capital is far more important than chasing opportunities. Don't FOMO; stay disciplined with risk management.

**Patience is the key. Let the market
post-image
BTC-0.67%
  • 3
society if there was only one token per meme
post-image
TOKEN-0.16%
MEME-0.94%
Why Do Stop-Losses Keep Getting Hit? You May Be Overlooking Normal Market Volatility

Have you ever experienced this: you set a stop-loss, and the price quickly drops to trigger it; then, after you exit, the market starts moving in the direction you originally expected.

After this happens a few times, some traders start to wonder whether the market is deliberately targeting their stop-loss levels.

But what may be more worth examining is the stop-loss logic itself.

First, does the stop-loss distance match the level of volatility?

Price fluctuations vary significantly across different assets
post-image
Load More

Join 40 M users in our growing community

⚡️ Join 40 M users in the crypto craze discussion

💬 Engage with your favorite top creators

👍 See what interests you

Trending Topics

JensenHuangResigns

510.8K Views7.9K Discussing

Jensen Huang has resigned as NVIDIA CEO and stepped down from the board. CFO Colette Kress will serve as interim CEO while NVIDIA considers internal and external successors. $NVDA fell more than 10% in premarket trading following the announcement. With one of AI’s most influential leaders stepping aside, markets are now reassessing NVIDIA’s leadership stability, AI strategy, and long-term valuation.

GateIPOAccessAnthropic

277.4K Views2.6K Discussing

Dr.HanOxfordUnionSpeech

144.1K Views430 Discussing

View More