Square
Following
Hot
News
Notifications
Profile
Share your thoughts
placeholder
Article
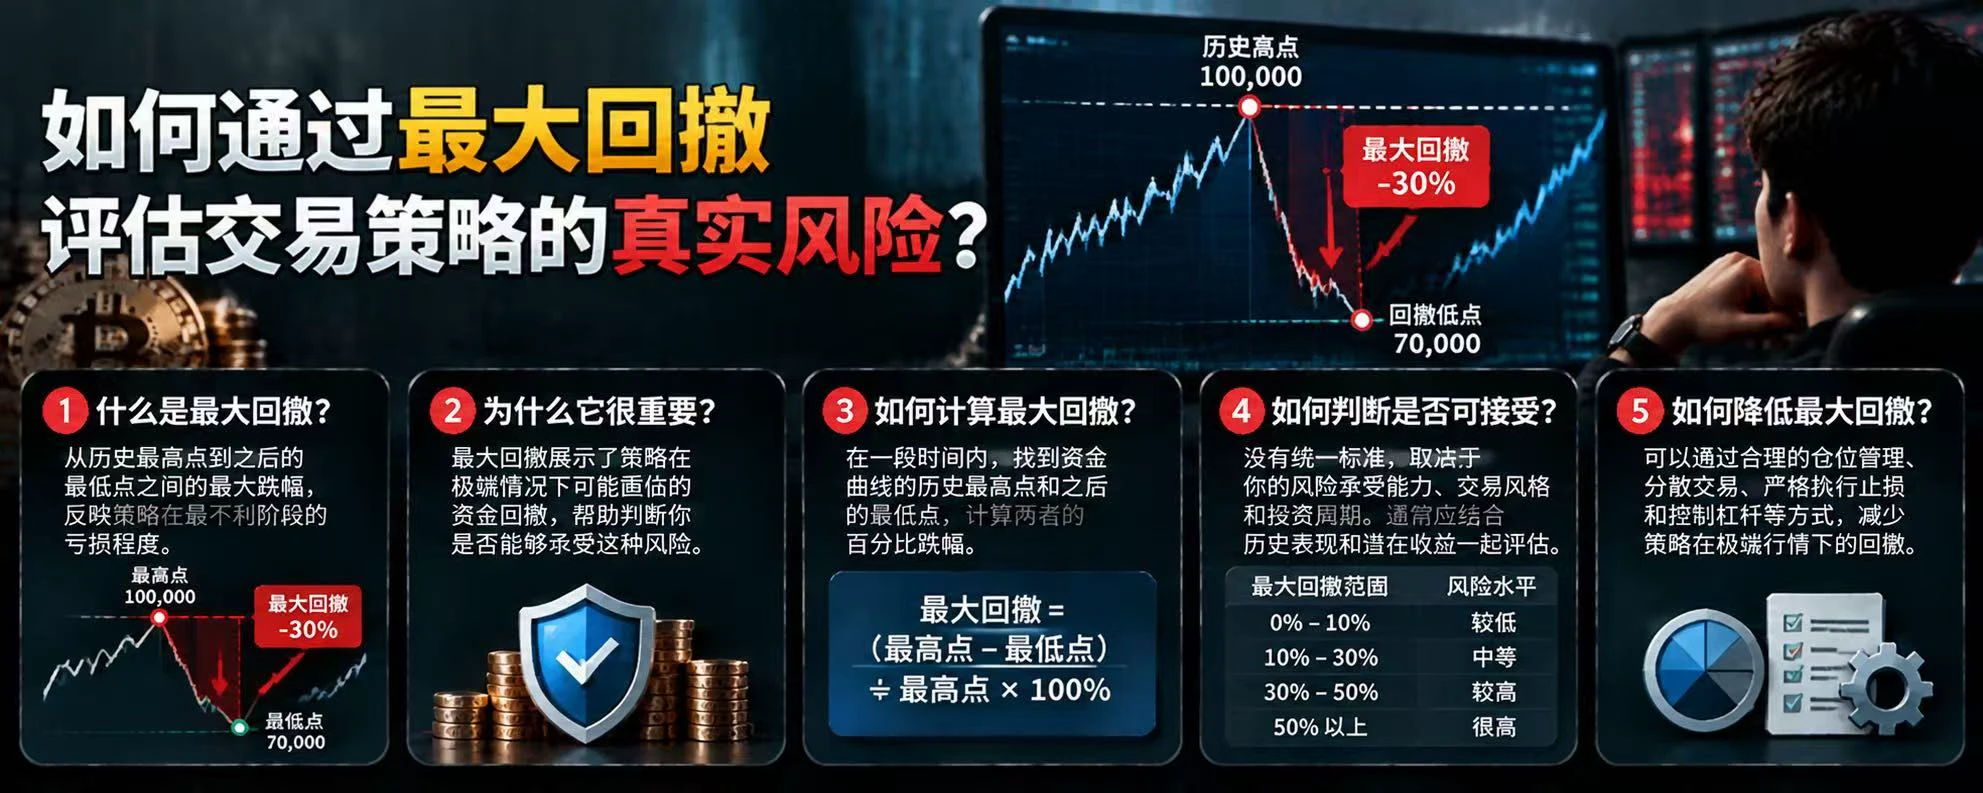
What Is Stress Testing? How Can You Check Whether a Trading Account Can Withstand Risk in Extreme Market Conditions?

In cryptocurrency trading, a strategy that profits under normal market conditions is not necessarily safe during a crash, a liquidity crunch, or a series of liquidations. Stress testing evaluates how much loss an account might withstand by simulating extreme but possible market scenarios.

First, what is stress testing?

It does not predict what will definitely happen in the market. Instead, it poses hypothetical questions: What would happen to your account if BTC suddenly fell
post-image
BTC-0.65%
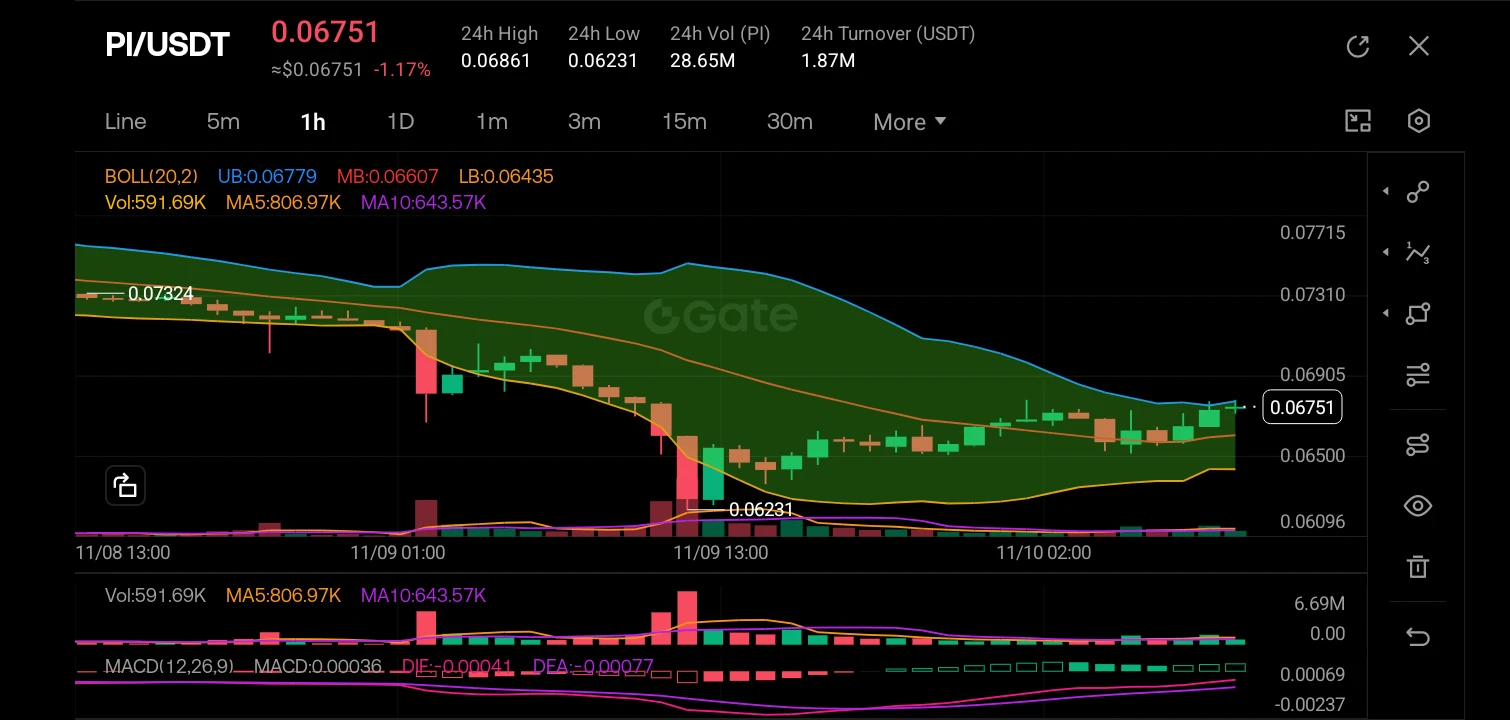
$PI ‌
The market structure on the 1-hour timeframe has recently shifted from a strong bearish impulse to a consolidation phase; after the sharp drop from the 0.07324 highs down to the 0.06231 liquidity grab, price has stabilized and is now printing higher lows, attempting to form a local bottom above the 0.06500 psychological level.

Price action is currently compressing, with the Bollinger Bands tightening significantly, indicating a volatility squeeze; the price is trading just above the middle band (MB) at 0.06607, acting as immediate dynamic support, while the MACD histogram is flattening
post-image
PI-0.60%
Trenches
牛逼
牛
bade
b
牛逼
0x96...7777
Market Cap
$.
Change
.
24h Vol
$.
Holders
.
PIEVERSE
P
bade
b
PIEVERSE
0x0e...25a9
Market Cap
$.
Change
.
24h Vol
$.
Holders
.
STONK
S
bade
b
STONK
6GmA...UNgx
Market Cap
$.
Change
.
24h Vol
$.
Holders
.
ON
O
bade
b
ON
0x0e...1d48
Market Cap
$.
Change
.
24h Vol
$.
Holders
.
FLOAT
F
bade
b
FLOAT
Bv1a...BMmr
Market Cap
$.
Change
.
24h Vol
$.
Holders
.
$20 to $ 10,000 Challenge : Day 3
live-cover
LIVE1,079
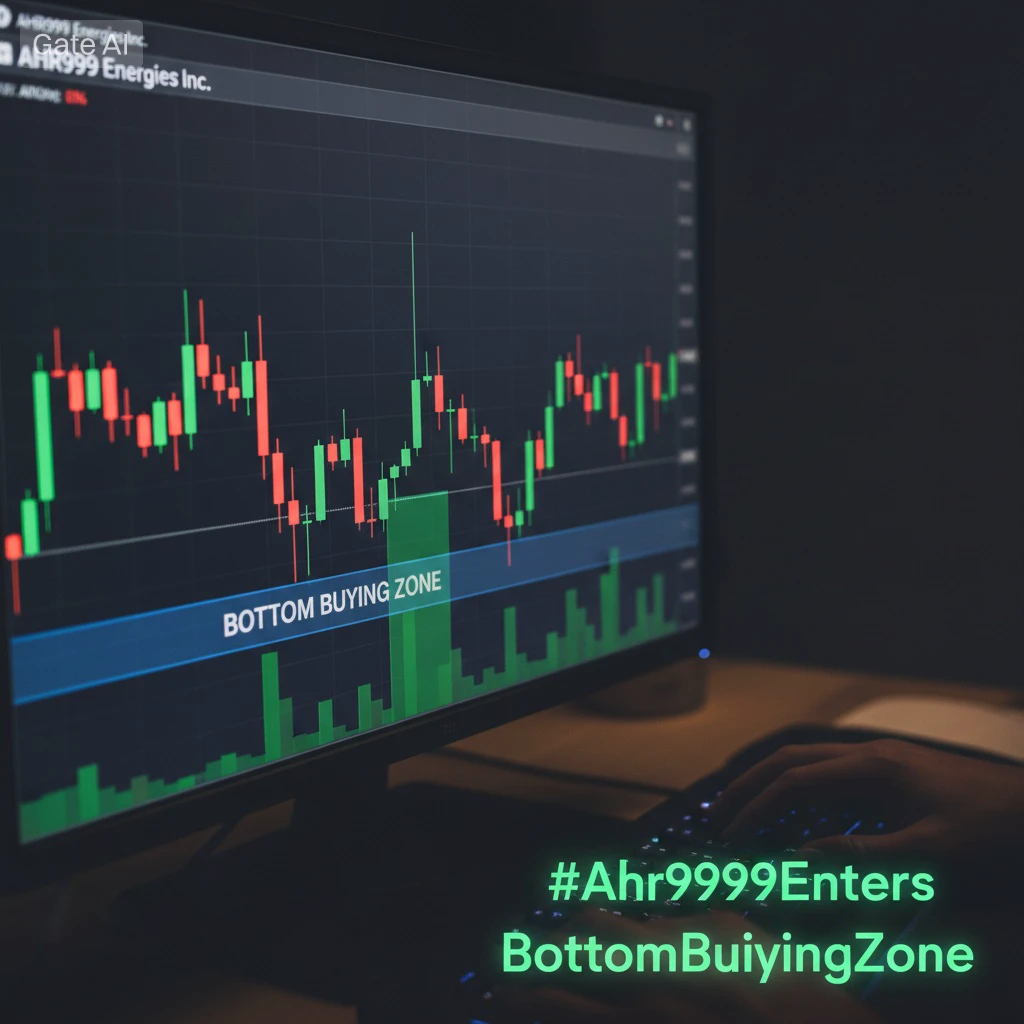
#Ahr999EntersBottomBuyingZone
THE MATHEMATICAL INDICATION OF SOVEREIGN VALUE: DECRYPTING THE AHR999 BOTTOM SIGNAL
The mathematical architecture governing digital scarcity is flashing its most definitive accumulation signal of the current market cycle. As Bitcoin ($BTC ) executes a highly technical mean reversion to trade at $74,778, registering a mild intra-session calibration of 0.67%, a premier programmatic valuation metric has crossed into territory historically reserved for institutional accumulation blocks.
The globally recognized Ahr999 Index has officially breached the critical 0.45 str
post-image
BTC-0.67%
INDEX+0.00%
  • 3
$PIEVERSE 2.274 is most likely the top. Trading volume keeps growing, but the price just can't climb—classic pumping while unloading. The biggest unlock is only a few days away. The shady market maker knows better than anyone that hundreds of millions of dollars in sell pressure are hanging overhead. Push the price too high and no one will dare buy; the shady market maker won't be able to unload and could even lose money
post-image
PIEVERSE+0.58%
BTC | ETH | Gold | Crude Oil
live-cover
LIVE1,012
Can PEPE Fly Again? These Price Targets Are Worth Watching!

#PEPE #DIDICHANEL
post-image
PEPE+0.97%
Altcoins are only suitable for small positions, with take-profit and stop-loss levels set; don’t get carried away, accept your losses, and don’t re-enter
The three major U.S. stock indexes all rose last night, with the S&P 500 up 2.3%, the Nasdaq up 2.7%, and the Dow Jones up 2.2%. The S&P 500 also posted its strongest single-day performance in seven months. Based on their usual correlation, a rebound in risk appetite of this magnitude should have prompted some reaction from crypto, but in reality, $BTC is currently stuck around 74900, up just 1.5% from this cycle's low; Ethereum, meanwhile, is hovering around 2120 and is actually down 1.3% on the day. Traditional and crypto markets are clearly going their separate ways this time.

First, let'
post-image
BTC-0.67%
🎁 New week, climb the leaderboard and win 150 USDT worth of merch!
The Gate Square comment challenge is still underway—start this week with an insightful comment 👇

🏆 Engage to top the weekly leaderboard and take home merch
The weekly leaderboard’s No. 1 winner gets exclusive Gate merch worth 150 USDT. Show off your commenting skills in the comments section this week!

🎉 Great rewards for your first comment—start chatting and get rewarded
After signing up, post your first valid comment under someone else’s post to receive a 10 USDT futures position trial voucher.

If something resonates wi
post-image
  • 2
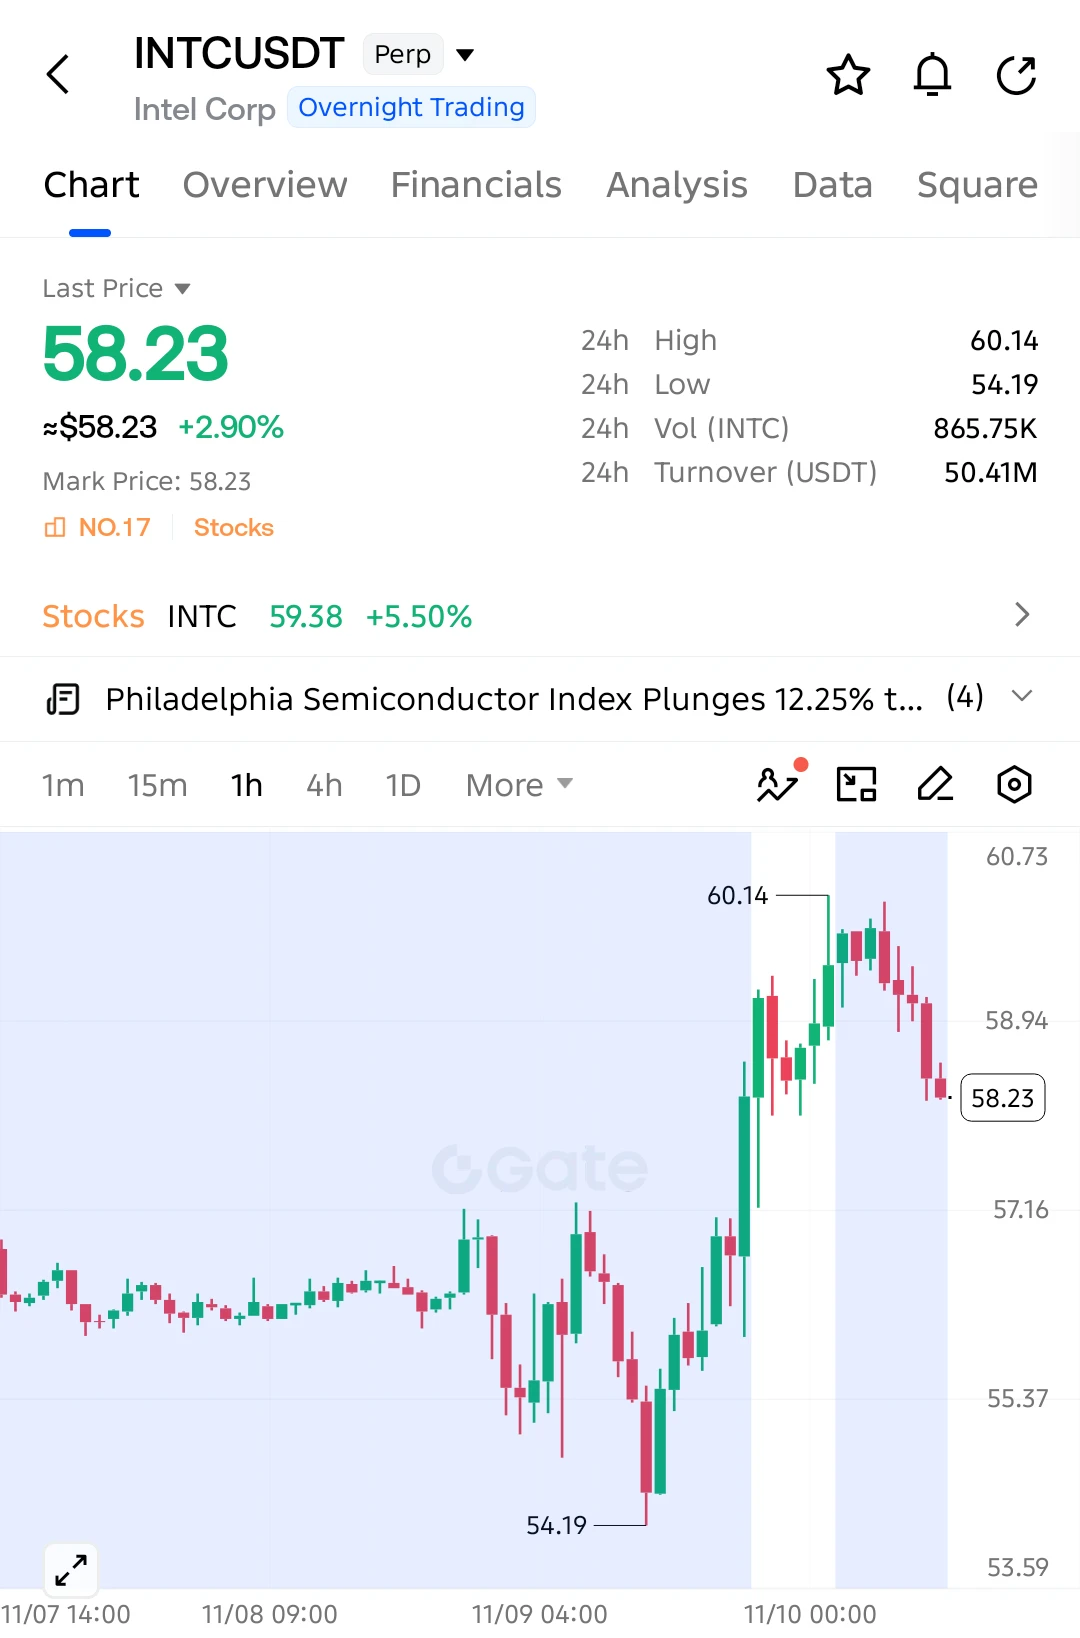
$INTC SHORT SETUP — SELLERS TAKING CONTROL!

$INTC has faced a sharp rejection from 60.14, and the latest candles show growing selling pressure. The pullback could extend further as buyers lose momentum!

Entry: 58.23
SL: 59.10

TP1: 57.40
TP2: 57.16
TP3: 56.30
Final Target: 55.37

$INTC is forming lower highs after failing to hold above 59.00. Sellers have pushed price below nearby support, opening the possibility of a deeper correction toward 57.16. A breakdown below that level could accelerate the decline.

Invalidation: Sustained recovery above 59.10.

Watch $INTC closely. Bears are gainin
post-image
INTC+0.05%
$AIOT BOOM🤑🤑 Tonight's trade is already in profit. The chart has been making lower highs, so I'm taking a coffee's worth of profit off the table first and continuing to hold, guys🙈💸$AIN $BR
post-image
AIOT-2.28%
AIN+3.85%
BR+6.00%
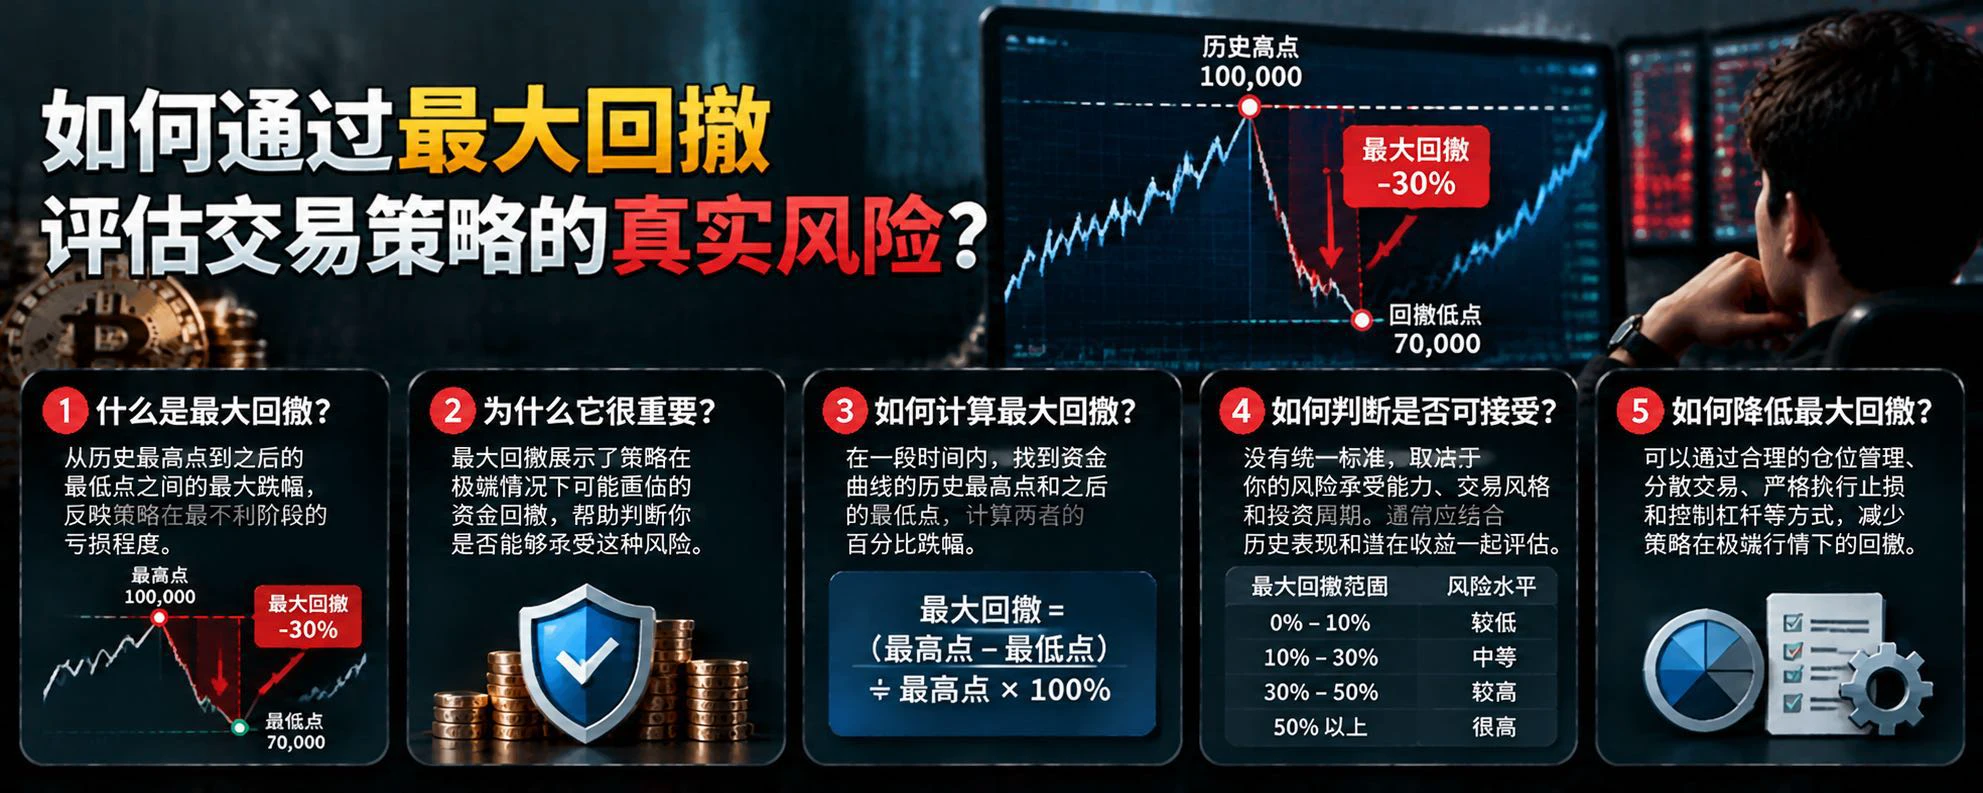
What Is Stress Testing? How Can You Check Whether a Trading Account Can Withstand Risk in Extreme Market Conditions?

In cryptocurrency trading, a strategy that is profitable under normal market conditions is not necessarily safe during a crash, a liquidity crunch, or a series of liquidations. Stress testing evaluates how much loss an account might be able to withstand by simulating extreme but plausible market scenarios.

First, what is stress testing?

It does not predict what will definitely happen in the market. Instead, it poses hypothetical scenarios: What would happen to an account if B
post-image
BTC-0.67%
What Is the Bid-Ask Spread? Why Can a Wider Spread Mean Higher Hidden Costs for Frequent Traders?

In crypto trading, many people focus only on fees and overlook the gap between the buying and selling prices. Even if an exchange advertises very low fees, a large bid-ask spread can add extra costs when traders open and close positions.

First, what is the bid-ask spread?

The bid-ask spread is the difference between the current best ask price and the best bid price. For example, if a coin’s best bid is 99.9 USDT and its best ask is 100.1 USDT, the spread is 0.2 USDT. Relative to the midpoint pr
post-image
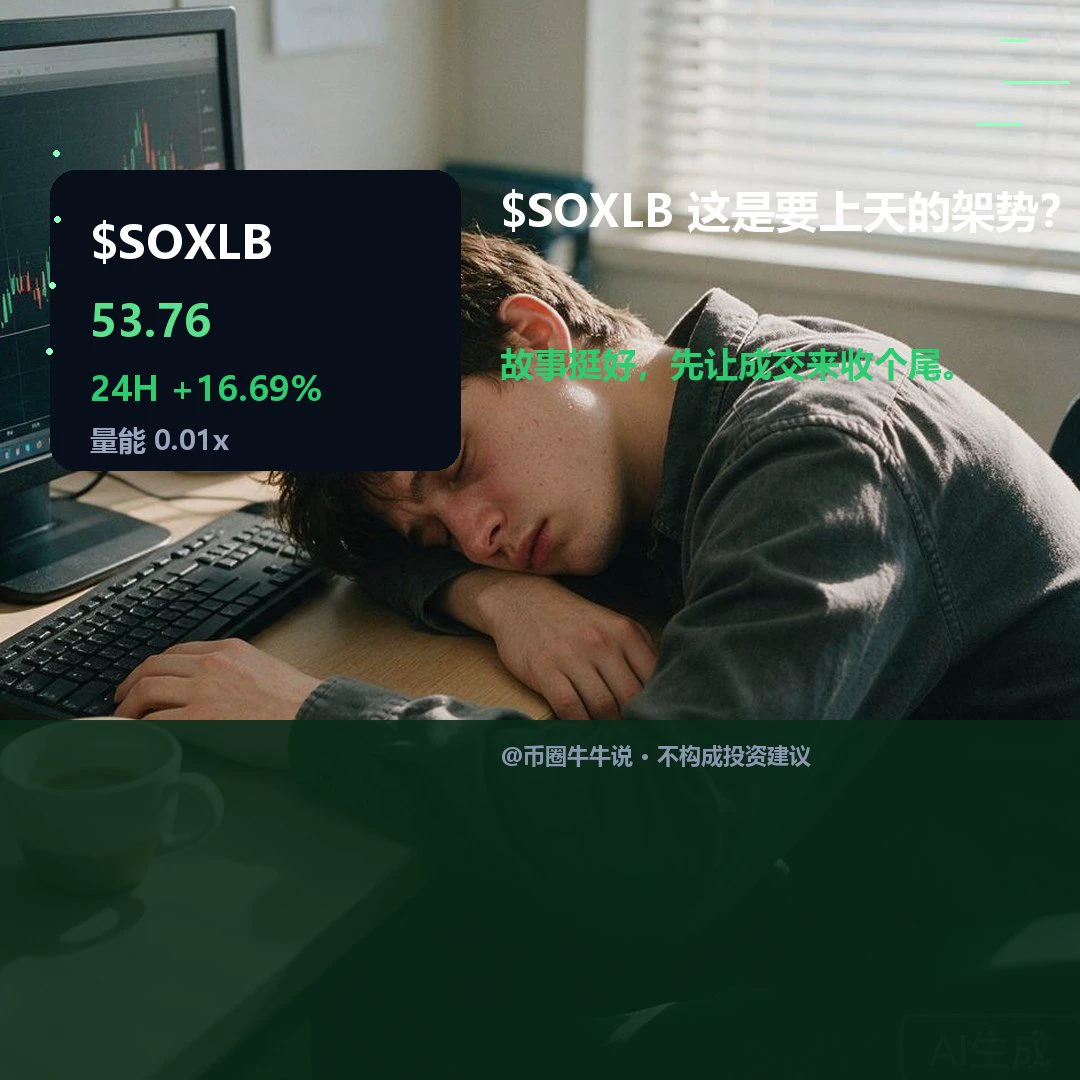
$SOXLB Currently trading at 53.76, up 16.69% over 24H. The 1H and 4H structures are both relatively strong, with price above the EMA20 on both timeframes. The 4H RSI at approximately 62.66 is slightly stronger than the 1H RSI at 53.39. However, volume is only 0.01 times the average of the past 20 bars, so the sustainability of the upward move is uncertain.

Conditions to watch: If price can hold above resistance at 57.76, the trend may continue; if it breaks below support at 41.32, watch for signs of weakness. In the next review, focus on whether volume can expand meaningfully if price holds a
post-image
What Is Order Book Depth? Why Can Severe Slippage Occur Even When the Buy and Sell Sides Look Crowded?

In cryptocurrency trading, judging whether a trading pair is easy to trade requires looking beyond its trading volume to its order book depth. Order book depth reflects the quantities of buy and sell orders placed at different price levels, helping traders understand the market’s capacity to absorb orders around different prices.

First, what is order book depth?

An order book consists of bids and asks. The bids show the prices and quantities at which traders are willing to buy, while the a
post-image
What Is Correlation Risk? Why Might Different Coins Fall Together During a Crash?

In the cryptocurrency market, many traders hold BTC, ETH, and multiple altcoins at the same time, hoping to reduce risk through diversification. But when the market suddenly crashes, they may find that different coins are falling almost simultaneously, and positions they thought were diversified are all losing value together. That is why correlation risk deserves attention.

First, what is correlation risk?

Correlation risk refers to the fact that different assets’ price movements are related, causing them to p
post-image
BTC-0.67%
ETH-1.26%
📣 Daily Standouts: Nominate a Post Worth Reading
Which recent post deserves more attention? 🔎
A well-supported market take, an honest trade recap or a useful tip—share it with us.

💬 Drop the Gate Square post link + one reason to read it.
Nominate your own post or another creator’s. Found something interesting? Open the original and join the discussion.

📌 We’ll check the comments when selecting posts to feature.
🎁 Selected creators get a 3-day traffic boost + featured placement.
Your nomination could be our next standout 👇
‍#DailyStandouts #GateSquare
post-image
  • 7
  • 5
Another record broken!
Global average temperatures from January to September 2026 were already about 1.47°C above pre-industrial levels—and that’s only an estimate for the first nine months
From 2015 to 2026, 12 consecutive years at the top as the hottest on record. Earth isn’t even pretending anymore
The WMO says El Niño has been strengthening since August and is expected to reach very strong levels in December. The WMO noted that El Niño could increase the risk of extreme heat, drought and heavy rainfall, with impacts potentially continuing into 2027
A WMO report says global average sea leve
post-image
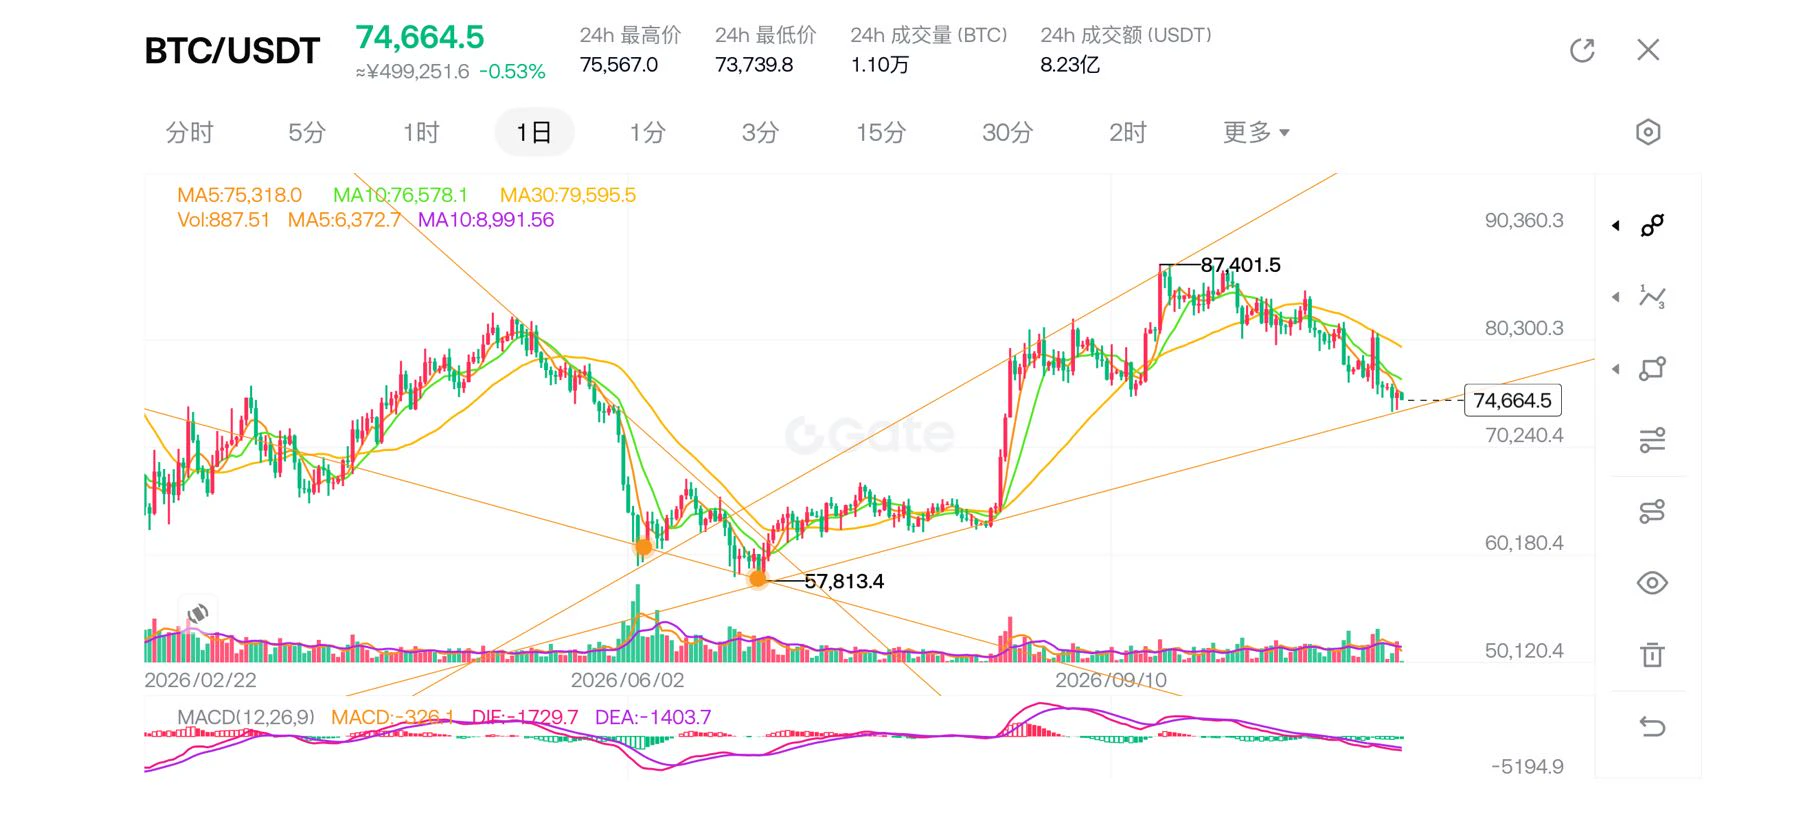
$BTC Guys, don't rush to buy the dip. It will most likely reach around 70240. Buy the dip in batches at this level; don't go all in.
post-image
BTC-0.67%
Load More

Join 40 M users in our growing community

⚡️ Join 40 M users in the crypto craze discussion

💬 Engage with your favorite top creators

👍 See what interests you

Trending Topics

USCPIDataIncoming

48.32k Views2.18k Discussing

The U.S. October CPI report will be released on November 10 at 8:30 a.m. ET. September CPI came in at 3.7% year over year, and markets will be watching closely for signs that inflation is cooling, especially in core CPI. A softer-than-expected reading could strengthen rate-cut expectations, while hotter inflation may pressure risk assets through higher Treasury yields and a stronger dollar. How do you think this CPI print will move $BTC, U.S. stocks and gold?

USIranTalksShowNewProgress

5.03k Views1.24k Discussing

KoreanStocksJumpOver5%

569 Views4.82k Discussing

View More