Square
Following
Hot
News
Notifications
Profile
Share your thoughts
placeholder
Article
You can practically smell how foul this water is through the screen.
I can't even imagine how bad it must stink in person...
$WLD Long momentum has clearly faded, and a gravity test is imminent. The 0.31 level is unlikely to hold. My outlook is bearish, and consider entering a short position in the near term.
Reference trading range: 0.3166–0.3182 First target: 0.3020 Second target: 0.2900 Stop-loss: 0.3277
Note that the market is currently range-bound, and it may first spike upward to test higher resistance before continuing its downward trend. Don’t go all in; size your position according to what your account can actually withstand.
Risk warning: The above is only my personal market view and does not constitute i
post-image
WLD-5.61%
Trenches
牛逼
牛
bade
b
牛逼
0x96...7777
Market Cap
$.
Change
.
24h Vol
$.
Holders
.
PIEVERSE
P
bade
b
PIEVERSE
0x0e...25a9
Market Cap
$.
Change
.
24h Vol
$.
Holders
.
STONK
S
bade
b
STONK
6GmA...UNgx
Market Cap
$.
Change
.
24h Vol
$.
Holders
.
ON
O
bade
b
ON
0x0e...1d48
Market Cap
$.
Change
.
24h Vol
$.
Holders
.
FLOAT
F
bade
b
FLOAT
Bv1a...BMmr
Market Cap
$.
Change
.
24h Vol
$.
Holders
.
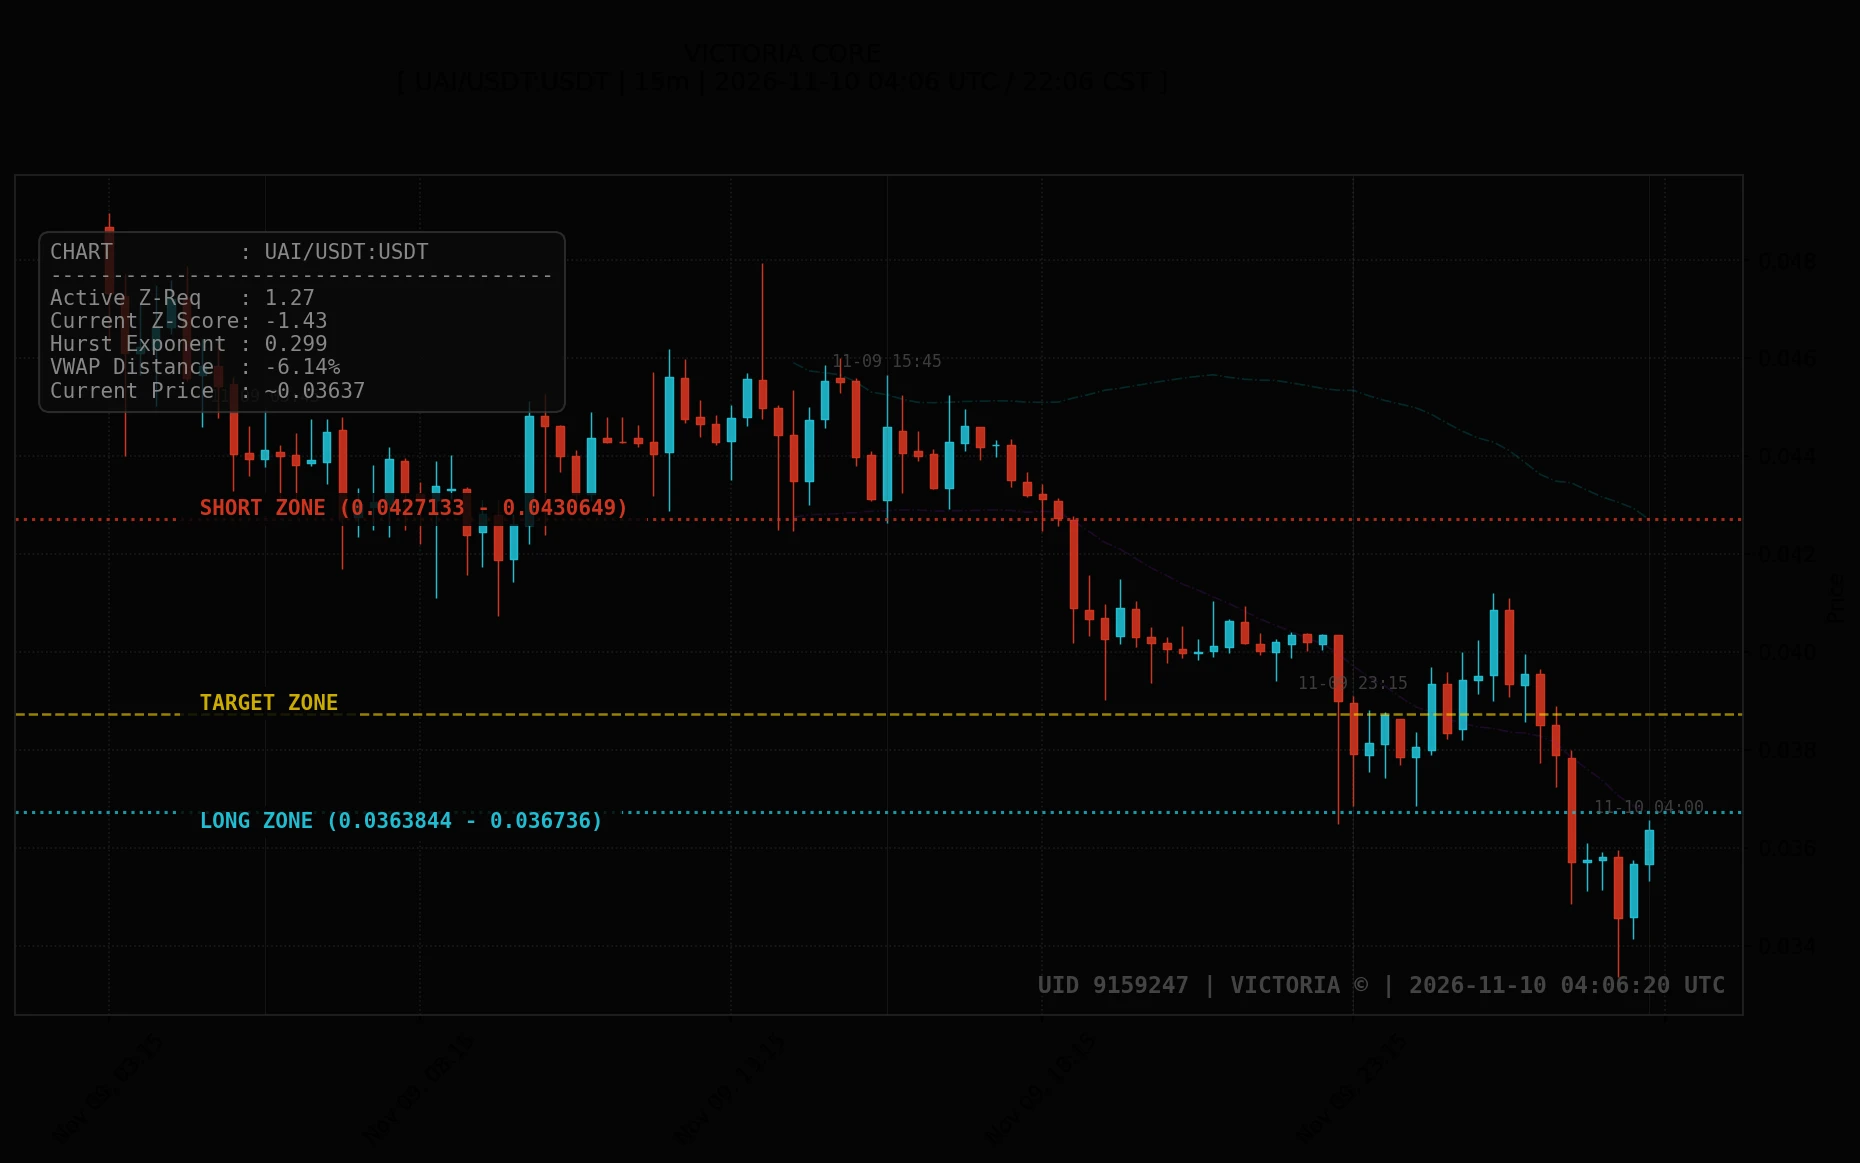
2026-11-10 04:06 UTC. UAI/USDT trades at ~0.03637 USDT, holding an active discount structure after buyers established demand down at 0.03337. Patience is key: respect risk parameters near LONG ZONE (0.0363844 - 0.036736 USDT) for a rotation to TARGET ZONE (~0.0387483 USDT), while watching SHORT ZONE (0.0427133 - 0.0430649 USDT) for resistance.

Secondary focus remains on BTC/USDT at ~74708 USDT (LONG ZONE: 74413.9 - 74464.5 USDT | TARGET ZONE: ~74875.1 USDT | SHORT ZONE: 75323.9 - 75374.4 USDT) and JCT/USDT at ~0.008464 USDT (LONG ZONE: 0.00893888 - 0.00909974 USDT | TARGET ZONE: ~0.00991676
post-image
UAI-7.58%
BTC-0.67%
$20 to $ 10,000 Challenge : Day 3
live-cover
LIVE1,115
$CYS ‌
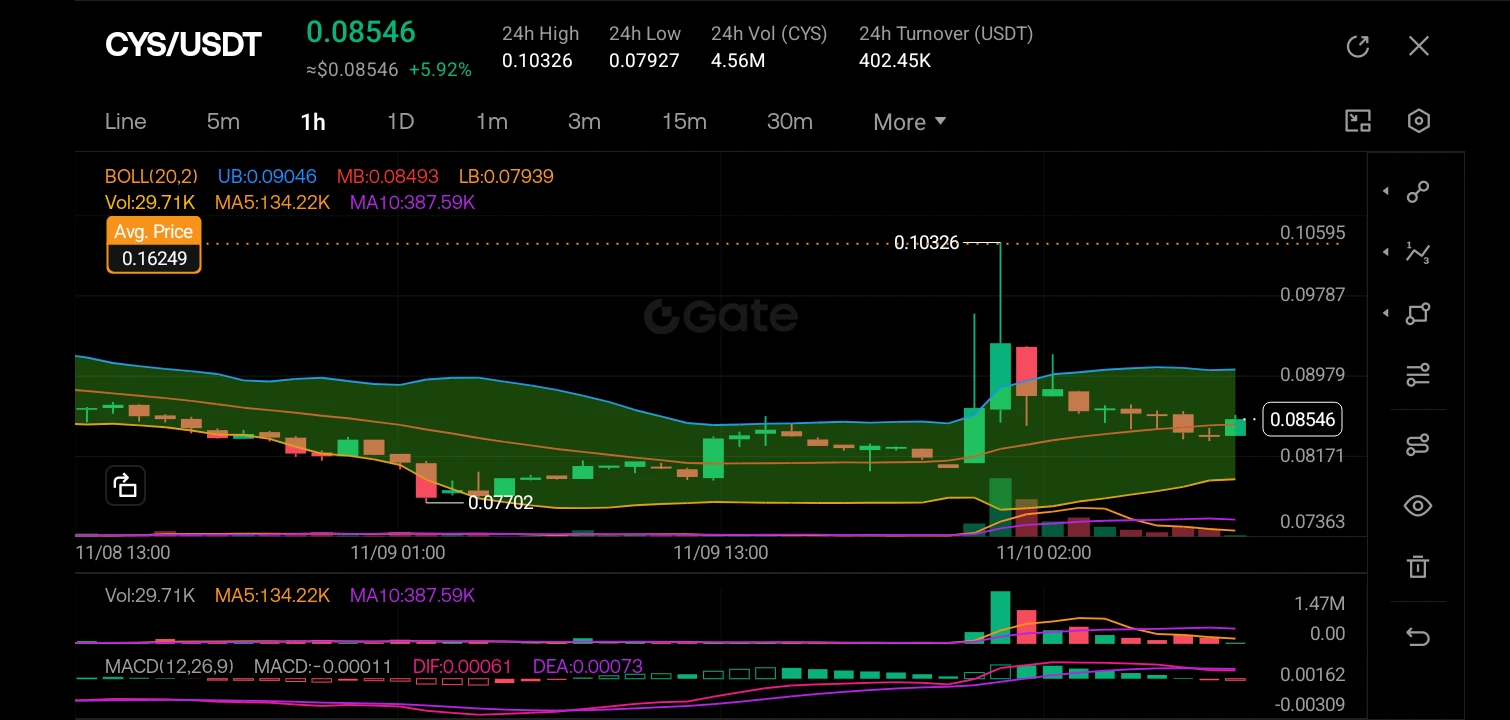
The market structure has shifted from a prolonged downtrend to a bullish reversal, as price broke above the previous consolidation zone and the midline of the Bollinger Bands, establishing a higher high near 0.10326 before retracing.

The K-lines show a strong impulsive green candle that pierced the upper Bollinger Band, followed by a series of smaller red and green candles indicating a healthy pullback and consolidation above the 0.08546 support level, with the MACD histogram showing diminishing bearish momentum.

Trading Plan: I plan to enter a long position near the current price of
post-image
CYS-0.35%
Bear Market is the time to build positions and accumulate assets with potential.
Bull Market is the time to maximize opportunities and seek the fastest compounding strategy.
Lock In.
post-image
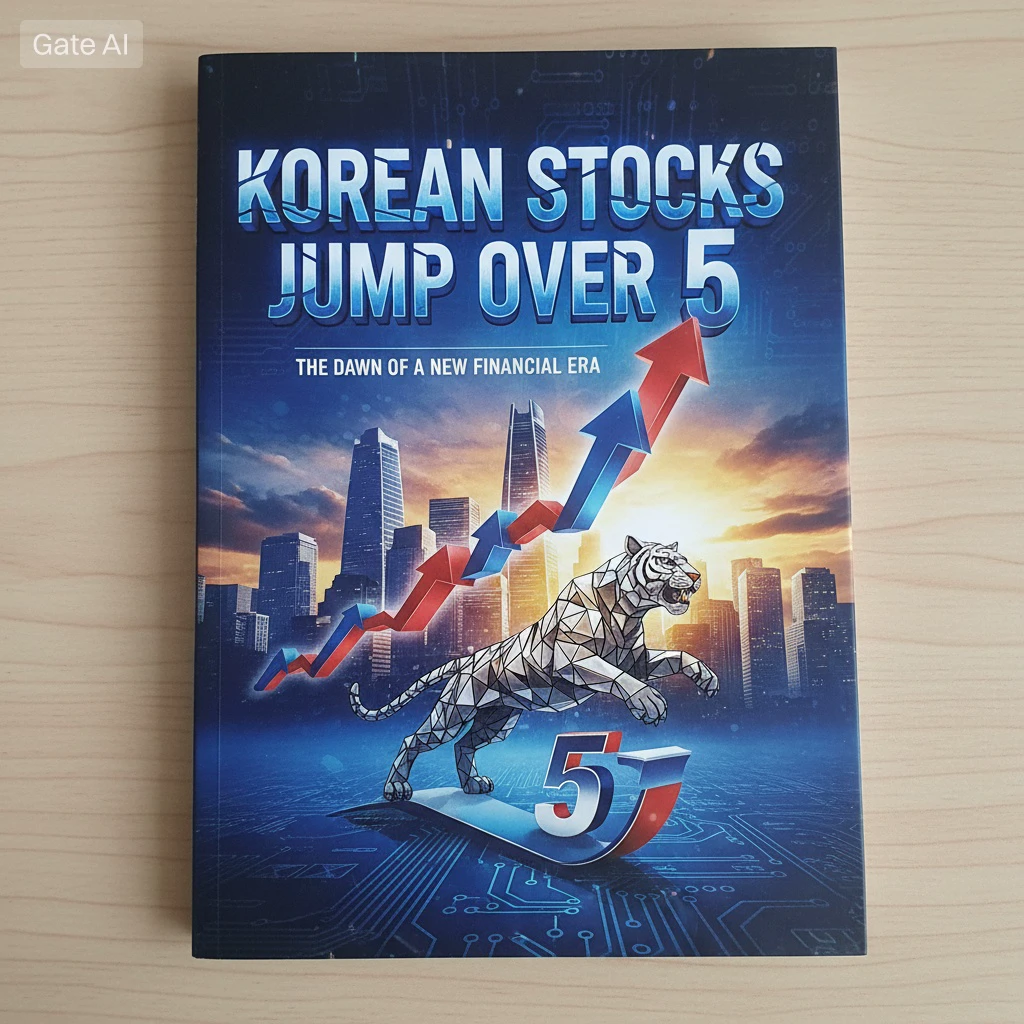
#KoreanStocksJumpOver5% 🇰🇷📈 #ShareWeekly #WCTCS9

South Korean Stocks Surge Over 5%: Is a New Market Rally Taking Shape?

South Korea's stock market has delivered a powerful rebound, with the benchmark index jumping more than 5% in early trading. What makes this move particularly interesting is that the rally was not limited to one sector. Major players across semiconductors and automobiles joined the advance, reflecting a broader improvement in investor sentiment.

📊 Key Market Developments:

- 🇰🇷 Korean benchmark index: Up 5.49% to 5,294.35
- Samsung Electronics: +5.85%
- SK Hynix: +8.
post-image
It’s almost 7 a.m. I was planning to get up early and slack off while taking a quick look at the charts and liquidation heatmap. Good grief, those bright yellow bands filling the screen woke me right up. This calm morning is full of landmines the market makers laid for us overnight!

$BTC is hovering around 75000, with price action thrashing wildly. Look closely at the heatmap: overhead, there’s a thick, glowing yellow line from 75500 to 76000, packed with fearless shorts. But look lower, and 73000 to 73500 is also a very thick line of defense for the longs. Once the morning session’s money c
BTC-0.65%
ETH-1.23%
SOL-0.74%
Testing a new strategy and updated the display in the livestream room. It now shows real-time profit and loss across different areas.
Welcome to tune in~

‍$ONDO $NVDA $BTC
ONDO-0.29%
NVDA-4.34%
BTC-0.67%
BTC Market update
live-cover
LIVE1,084
☀️ GM! U.S. stocks are recovering, while BTC is still waiting for a signal. ☕
The Nasdaq surged 2.74% overnight, but BTC is still hovering near lows. U.S. October CPI is due tonight at 21:30. 👀

📌 Today’s featured topic: This cup of CPI coffee—do you think it’ll be hot or cold?
🔥 Hot inflation: Will BTC and U.S. stocks come under pressure again?
🧊 Cooling inflation: Can it drive a market rebound?
👀 Trading strategy: Position ahead of time, or wait for the data?

🎁 Share your CPI forecast and trading ideas on Gate Square. Get a red packet reward just for posting, with larger red packets d
post-image
BTC-0.67%
NDAQ+1.29%
Let's gooo Humanity 🚀🫶
post-image
H-2.00%
🔥 What are we discussing today? Gate Square trending topics have been updated!

🔹 #美国10月CPI即将公布
Will inflation continue to cool, or will it disrupt rate-cut expectations again?

🔹 #标普500创7个月最大涨幅
U.S. stocks have rebounded strongly. Is this a technical recovery, or are AI and tech stocks taking the lead again?

🔹 #美伊谈判出现新进展
Geopolitical tensions are showing signs of easing, crude oil is retreating, and risk assets are rebounding. How long can this last?

Quality content can receive traffic support + featured recommendations.

💰 Have an opinion? Come join the discussion:
https://www.gate
post-image
  • 4
  • 4
#标普500创7个月最大涨幅 #WCTCS9 #Gate股票畅聊季 This latest U.S. stock rally looks more like a technical rebound after a sharp sell-off, with the AI theme simply following along. Whether tech stocks can lead again depends on earnings and regulatory risks. On November 9, the S&P 500 rose 2.35%, its biggest single-day gain since April 8; the Nasdaq rose 2.74%. The previous day's losses were steep, so this rally was first and foremost a recovery from oversold conditions.

Why this looks more like a technical rebound
The drop was sharp: On November 5, the S&P 500 fell 4.36% and the Nasdaq fell 5.52%, while the
SPYX+0.01%
SPX+0.33%
NVDA-4.34%
  • 1
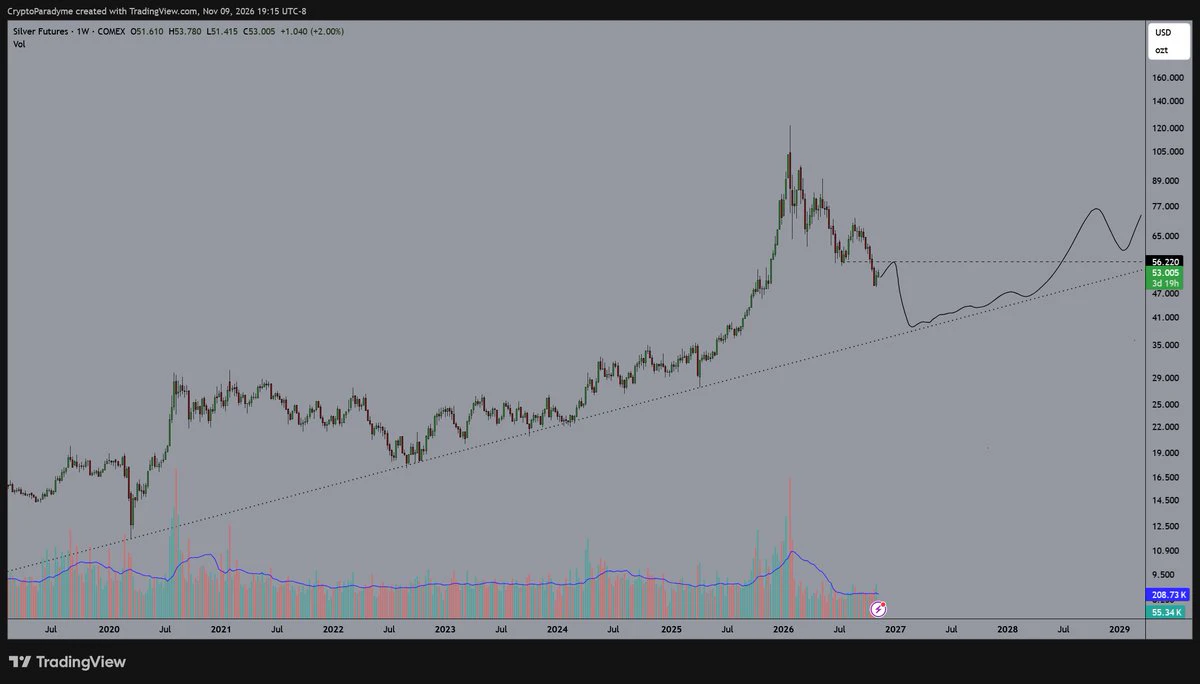
gonna fud silver so hard that no one notices it's a log scale trend line.
post-image
XAG+0.47%
Damn, our country has a B-21 stealth bomber now too. It’s pretty similar to the Americans’ $2.5 billion-a-piece one, though ours looks cooler.
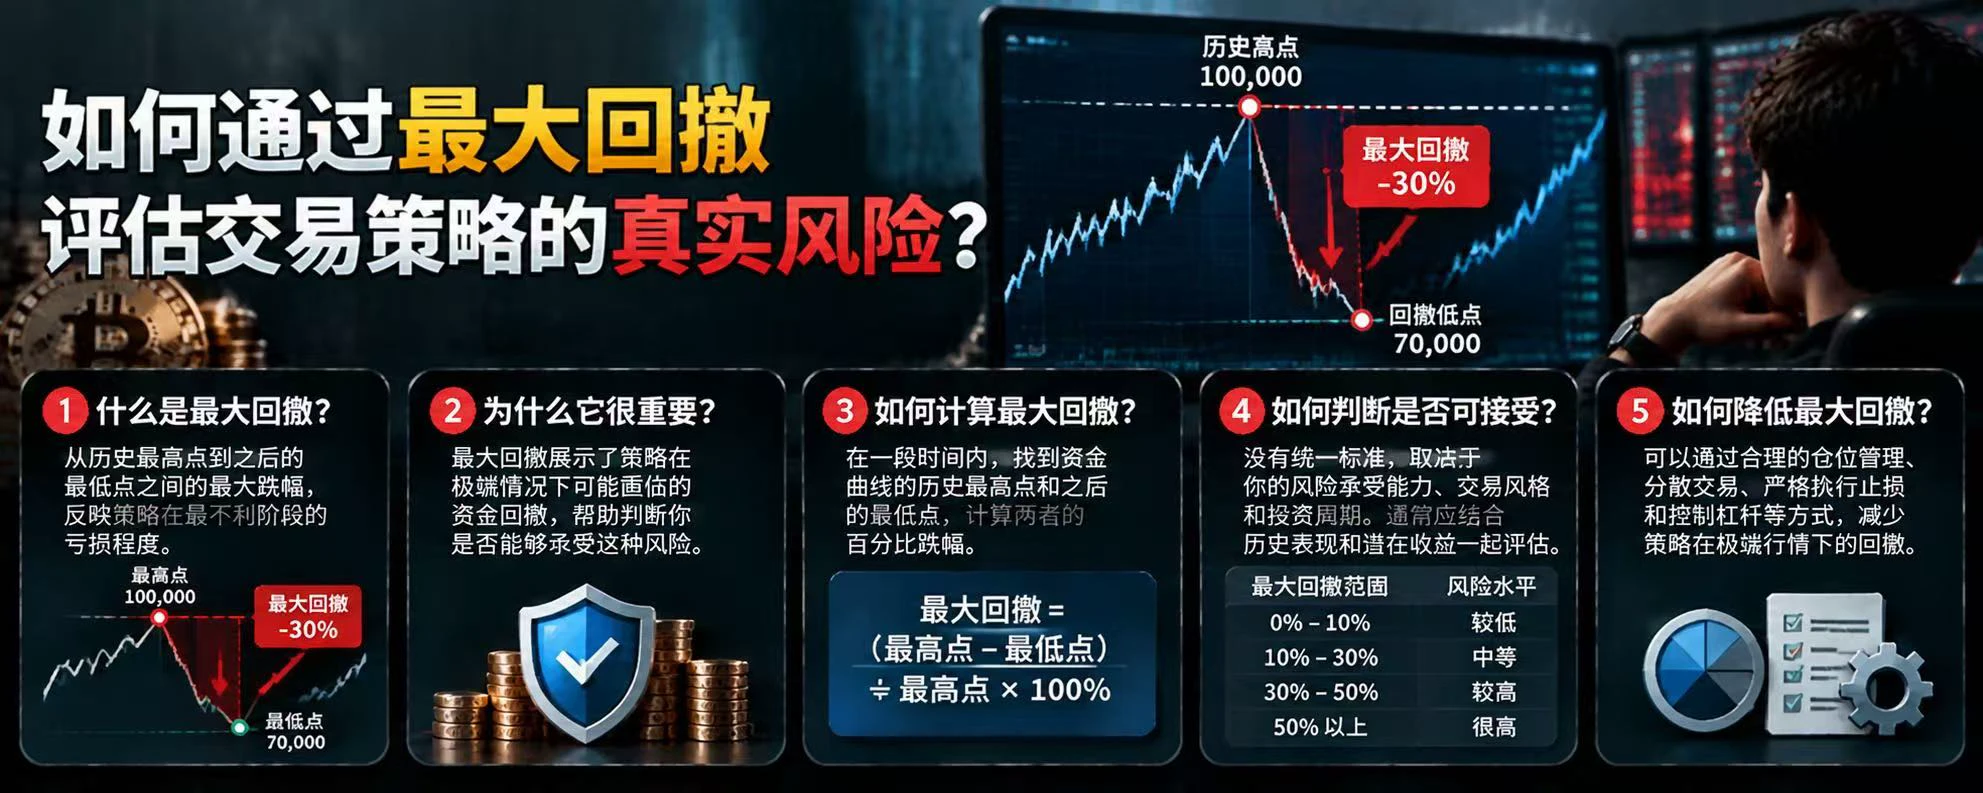
What Is Stress Testing? How Can You Check Whether a Trading Account Can Withstand Risk in Extreme Market Conditions?

In cryptocurrency trading, a strategy that is profitable under normal market conditions is not necessarily safe during a crash, a liquidity crunch, or a series of liquidations. Stress testing evaluates how much loss an account might sustain by simulating extreme but plausible market scenarios.

First, what is stress testing?

It does not predict what will definitely happen in the market. Instead, it asks hypothetical questions: What would happen to the account if BTC suddenly f
post-image
BTC-0.65%
🏎️ Both cars on the podium, talking about the future off track—Gate × Red Bull keeps delivering

🇧🇷 Great news from the Brazilian Grand Prix!

🏆 Max Verstappen fought his way from P21 to P2
🥉 Isack Hadjar took P3

Red Bull Racing put both cars on the podium, once again showcasing its speed and team strength. 💙

Meanwhile, Gate Founder and CEO Dr. Han was invited to visit the headquarters of the UK-based Red Bull Racing team for the Racing the Future Vol.5 event, where he had an in-depth discussion with team CEO Laurent Mekies.

From F1 rule changes to the new landscape of the crypto indu
  • 4
  • 3
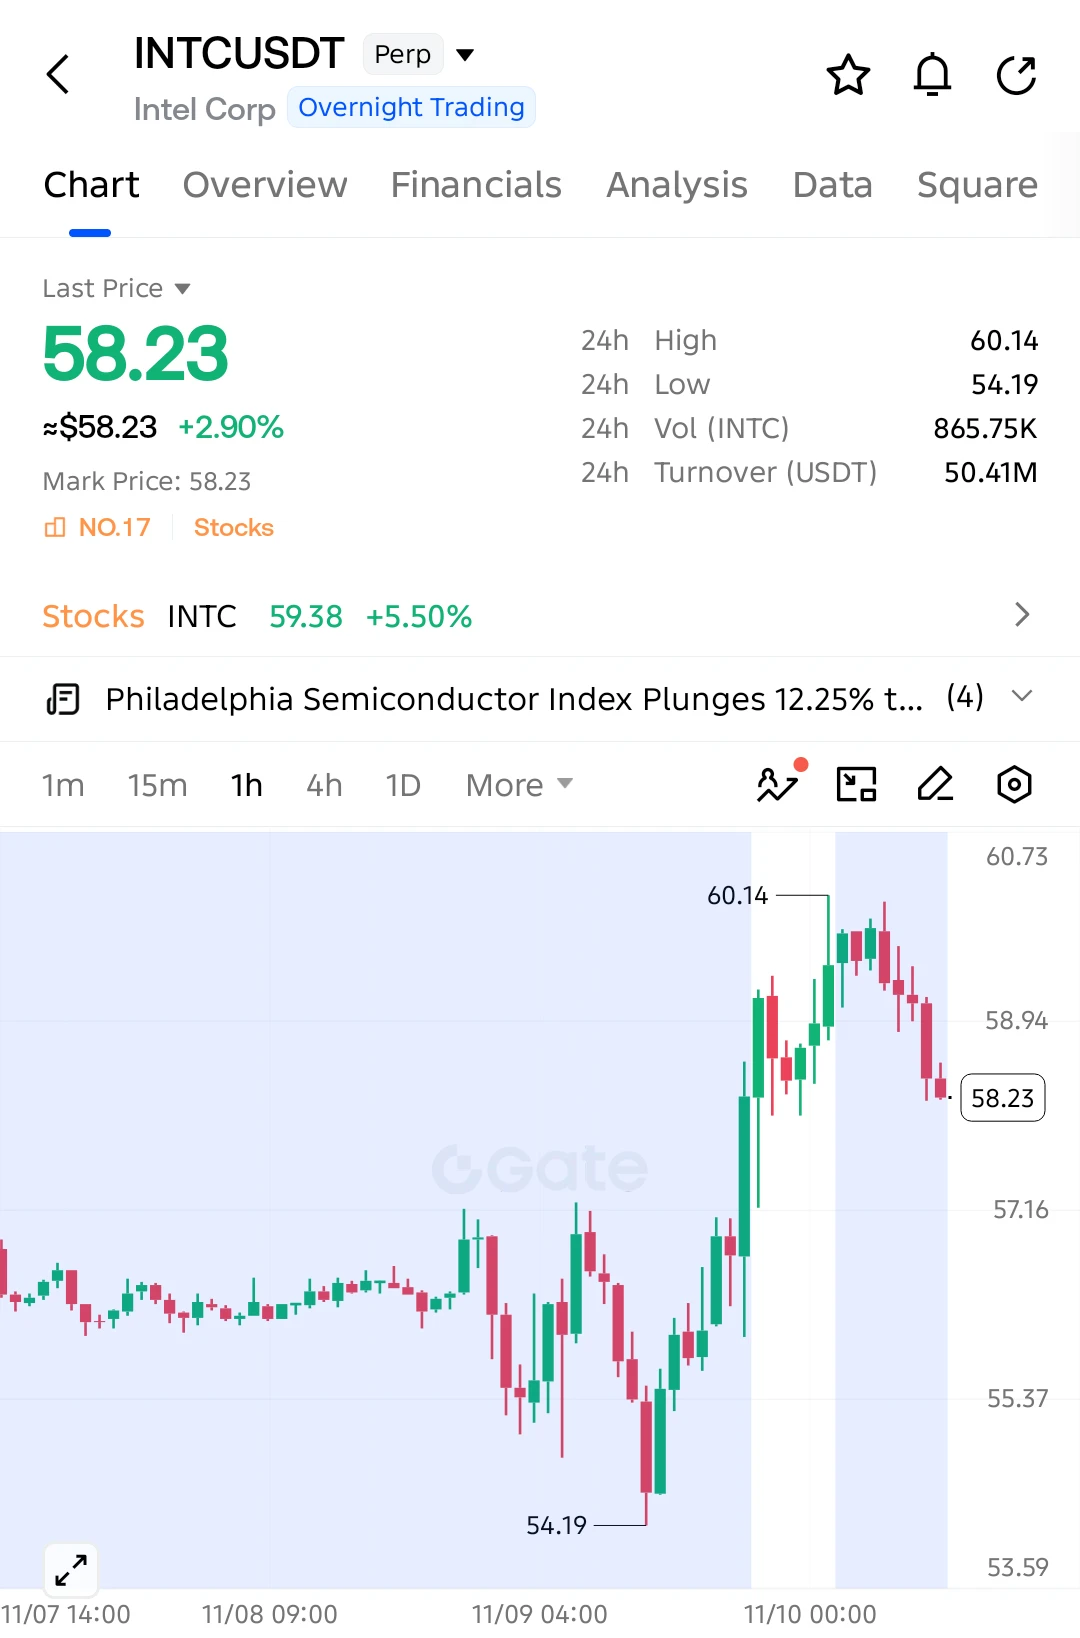
$INTC SHORT SETUP — SELLERS TAKING CONTROL!

$INTC has faced a sharp rejection from 60.14, and the latest candles show growing selling pressure. The pullback could extend further as buyers lose momentum!

Entry: 58.23
SL: 59.10

TP1: 57.40
TP2: 57.16
TP3: 56.30
Final Target: 55.37

$INTC is forming lower highs after failing to hold above 59.00. Sellers have pushed price below nearby support, opening the possibility of a deeper correction toward 57.16. A breakdown below that level could accelerate the decline.

Invalidation: Sustained recovery above 59.10.

Watch $INTC closely. Bears are gainin
post-image
INTC+0.05%
Load More

Join 40 M users in our growing community

⚡️ Join 40 M users in the crypto craze discussion

💬 Engage with your favorite top creators

👍 See what interests you

Trending Topics

USCPIDataIncoming

48.32k Views2.19k Discussing

The U.S. October CPI report will be released on November 10 at 8:30 a.m. ET. September CPI came in at 3.7% year over year, and markets will be watching closely for signs that inflation is cooling, especially in core CPI. A softer-than-expected reading could strengthen rate-cut expectations, while hotter inflation may pressure risk assets through higher Treasury yields and a stronger dollar. How do you think this CPI print will move $BTC, U.S. stocks and gold?

USIranTalksShowNewProgress

5.03k Views1.24k Discussing

KoreanStocksJumpOver5%

569 Views4.83k Discussing

View More