









#美股AI板块遭遇重挫 #作手分析
🔥 AI stocks rebound after a sharp sell-off: Has the industry thesis changed? Could Anthropic's IPO become a turning point?
Trading watch: $NVDA $AMD $GOOGL $BTC
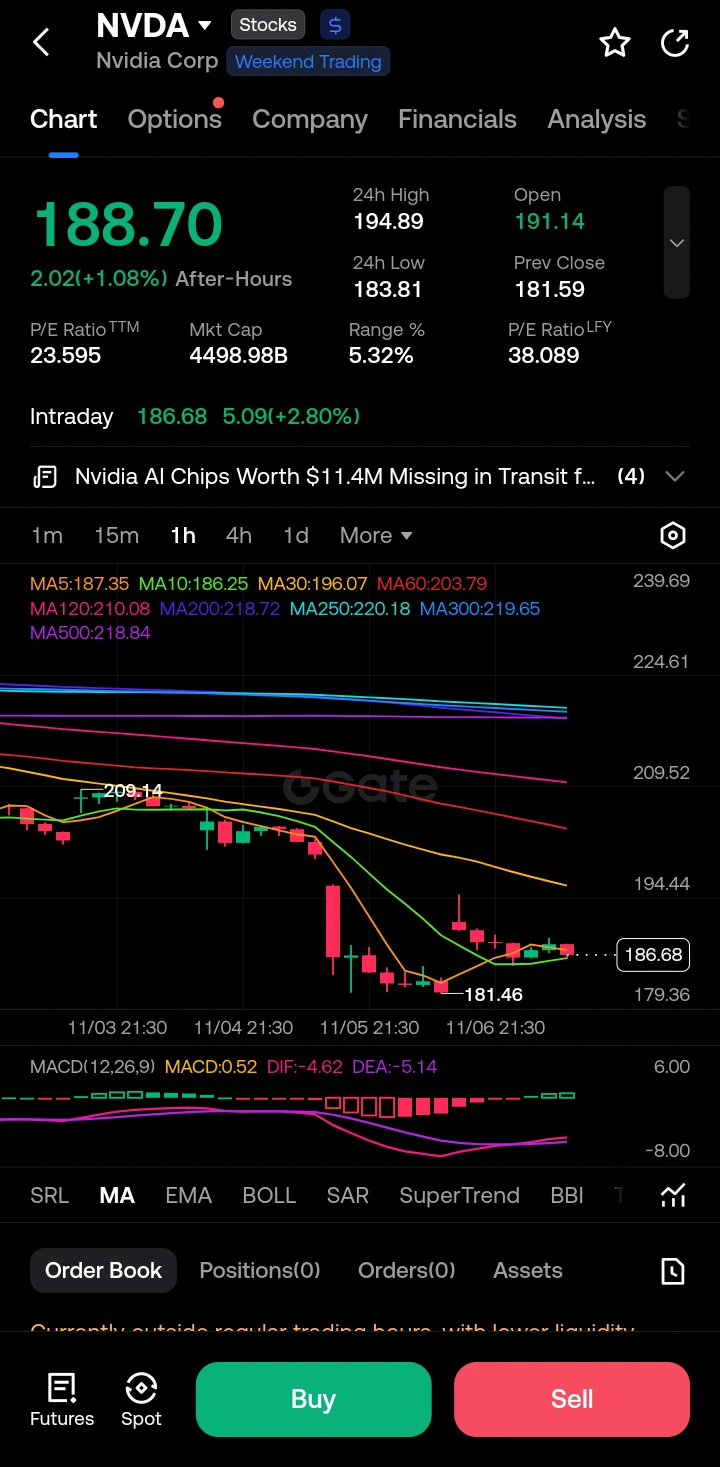
On November 5, U.S. AI stocks suffered a sharp sell-off: the Nasdaq fell 5.5%, the Philadelphia Semiconductor Index dropped about 12.2%, Nvidia fell 9.3%, and AMD plunged 17.3%.
Does this reflect a change in the AI industry's underlying thesis, or a concentrated repricing of high valuations and heavy capital spending?
I. The long-term AI trend is unchanged, but short-term valuations need a fresh look
After the U.S. midterm elections, Democrats took control of both chambers of Congress. The market began to worry that data center construction, energy supply, and AI regulation could face tighter restrictions, potentially affecting investment in AI infrastructure.
But I don't think this sell-off can simply be interpreted as the U.S. giving up on AI.
AI is a key direction for the next wave of industrial transformation. Both the U.S. and China continue to increase investment in AI. The U.S. may strengthen regulation and curb uncontrolled expansion, but it is unlikely to willingly abandon the global AI race.
Moreover, regulation does not mean the end of the industry. Over the long term, compliance capabilities, technological barriers, and financial strength could instead become competitive advantages for leading AI companies.
Of course, getting the industry direction right doesn't mean every AI stock is worth buying at any price. What the market really needs to reassess now is the payback period for AI investments, capital spending, and companies' profitability.
II. October nonfarm payrolls beat expectations on November 6, lifting U.S. stocks, but a bottom is not yet confirmed
U.S. nonfarm payrolls increased by 165,000 in October, well above the market expectation of about 65,000; the unemployment rate fell from 4.2% to 4.1%.
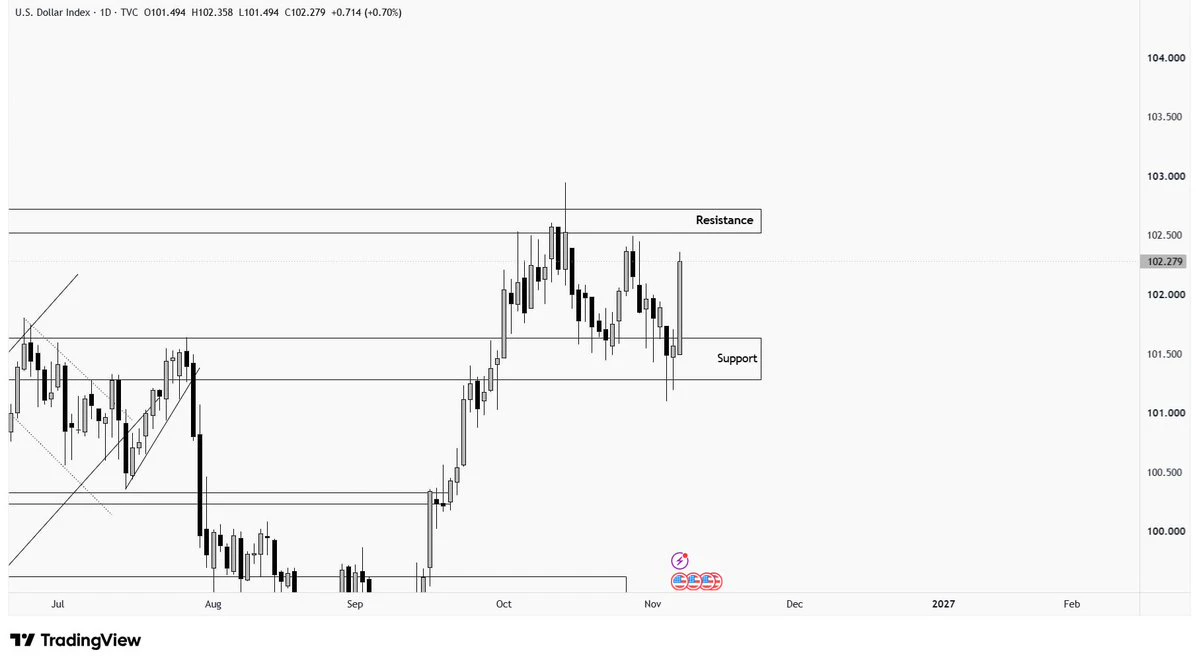
Stronger-than-expected employment data suggests the U.S. economy has not yet shown the pronounced deterioration the market feared, but it could also make the Fed more cautious about cutting rates.
After the data was released, U.S. tech stocks rebounded: the Nasdaq rose about 1.09%, the S&P 500 gained about 0.32%, while the Dow fell about 0.46%.
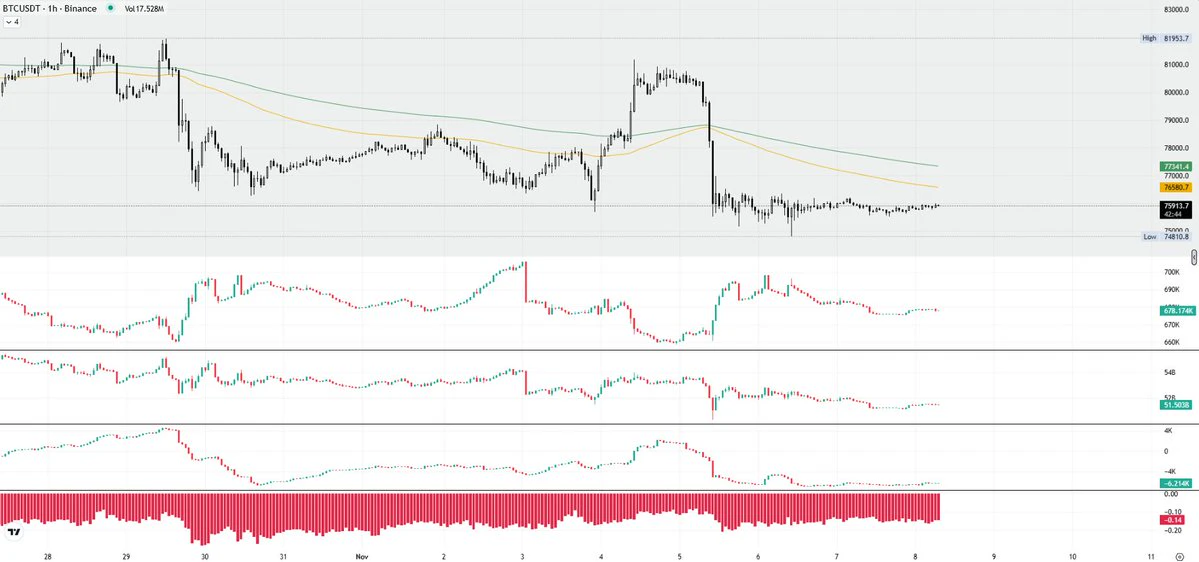
Notably, BTC had still been dragged down by selling in AI risk assets, falling more than 5% at one point on November 5, while liquidations in the crypto market exceeded $1 billion.
So my assessment is that some of the earlier panic may have eased, but that doesn't mean all the bad news is fully priced in, let alone that the market has definitively bottomed.
III. Anthropic's IPO: A major catalyst, but with risks that cannot be ignored
Anthropic has filed IPO registration documents with the SEC, and plans to list on Nasdaq under the ticker ANT.
According to the company's latest disclosure, revenue was about $16.96 billion in the third quarter of 2026 and about $33.24 billion in the first nine months, reflecting very rapid business growth.
But the other side is also worth noting: the company reported a net loss of about $23.29 billion in the third quarter and disclosed commitments to AI computing capacity and infrastructure spending totaling as much as $895.4 billion, including about $69.8 billion over the next 12 months.
This shows that Anthropic's commercial growth is very strong, but its computing investment and funding needs are equally staggering.
The roadshow is currently rumored to be planned for the week of November 9, but a November 5 Reuters report said some potential investors considered the previously discussed $1.5 trillion valuation too high. Market volatility could also affect the timing and pricing of the offering.
Therefore, Anthropic's IPO could indeed become a major catalyst for AI stocks, but a listing doesn't mean the share price will necessarily rise, nor does it mean all AI assets will rally in tandem.
IV. Trader's trading strategy
I remain bullish on the long-term development of the AI industry and continue to follow related assets such as Anthropic, GOOGL, NVDA, and AMD.
But my trading principles won't change because of one sharp drop or one rebound:
1️⃣ Spot: Don't use leverage. Monitor fundamentals and valuations in stages, and avoid going all-in to buy the dip.
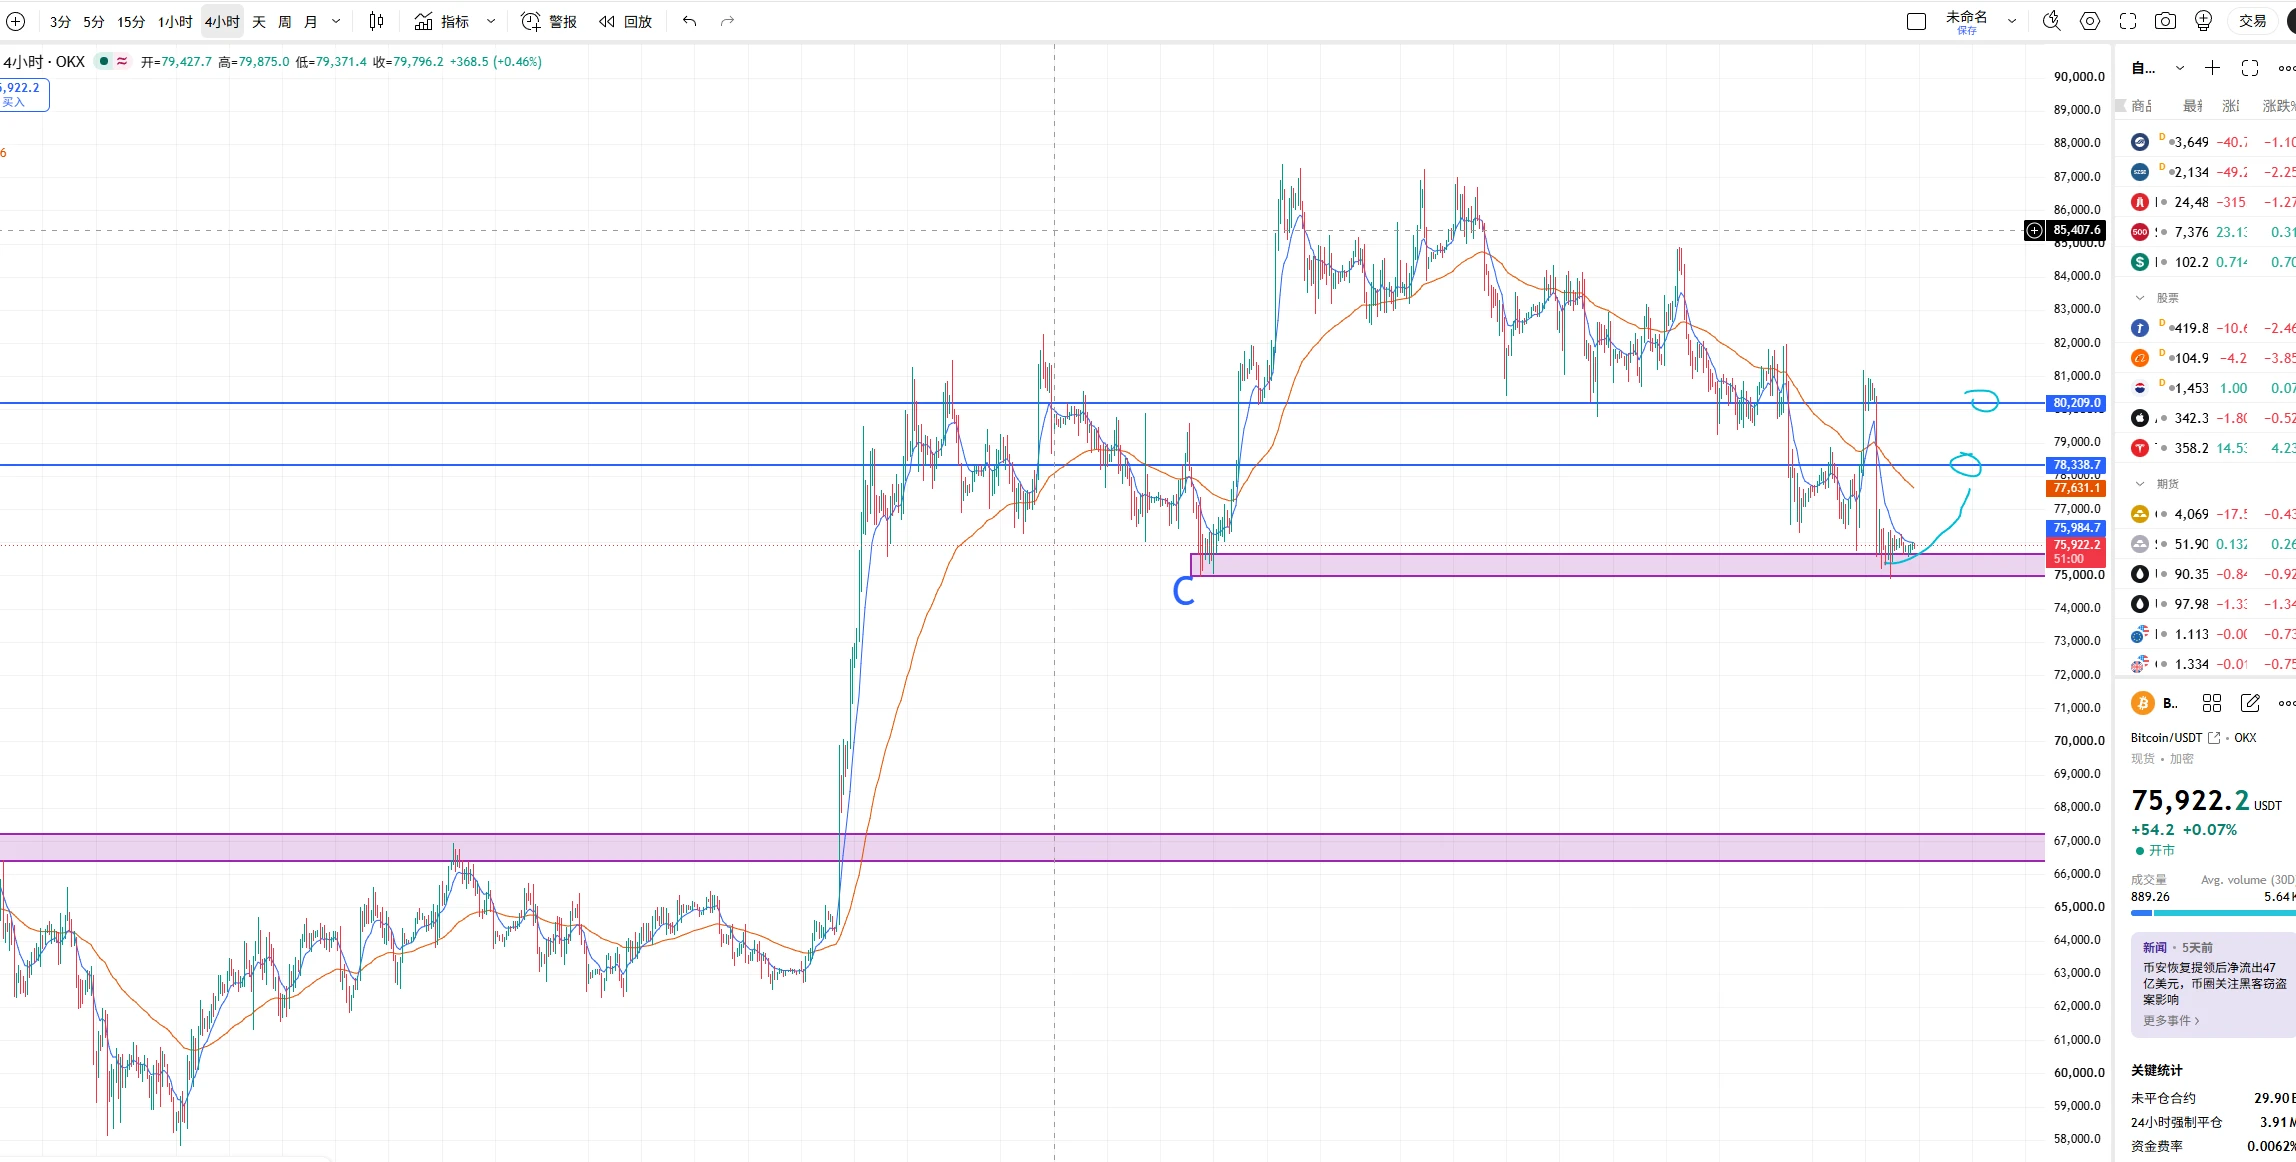
2️⃣ Futures: Don't guess the bottom or chase the first big rebound candle. Wait for a price breakout and a confirmed retest before considering a follow-up entry.
3️⃣ Risk management: If the rebound fails to form a valid structure, or the price falls below a key low again, reassess rather than blindly adding to the position.
I always stick to one principle:
Data is a catalyst; price structure is the trading signal. Let the market provide the answer instead of trying to predict it.
The long-term direction of AI may be unchanged, but in the short term, the market still needs price action to confirm it.
Where do you think the AI sector will go next after this correction?
A. The long-term AI thesis is intact; remain bullish 🚀
B. Valuations are still high; further correction is needed 📉
C. Anthropic's IPO will drive an AI rebound 💡
D. Wait for a breakout and retest before entering 🛡️
Share your views in the comments! 👇
(The above reflects personal views and a review of market activity, is for discussion only, and does not constitute investment advice.)
🔥 AI stocks rebound after a sharp sell-off: Has the industry thesis changed? Could Anthropic's IPO become a turning point?
Trading watch: $NVDA $AMD $GOOGL $BTC
On November 5, U.S. AI stocks suffered a sharp sell-off: the Nasdaq fell 5.5%, the Philadelphia Semiconductor Index dropped about 12.2%, Nvidia fell 9.3%, and AMD plunged 17.3%.
Does this reflect a change in the AI industry's underlying thesis, or a concentrated repricing of high valuations and heavy capital spending?
I. The long-term AI trend is unchanged, but short-term valuations need a fresh look
After the U.S. midterm elections, Democrats took control of both chambers of Congress. The market began to worry that data center construction, energy supply, and AI regulation could face tighter restrictions, potentially affecting investment in AI infrastructure.
But I don't think this sell-off can simply be interpreted as the U.S. giving up on AI.
AI is a key direction for the next wave of industrial transformation. Both the U.S. and China continue to increase investment in AI. The U.S. may strengthen regulation and curb uncontrolled expansion, but it is unlikely to willingly abandon the global AI race.
Moreover, regulation does not mean the end of the industry. Over the long term, compliance capabilities, technological barriers, and financial strength could instead become competitive advantages for leading AI companies.
Of course, getting the industry direction right doesn't mean every AI stock is worth buying at any price. What the market really needs to reassess now is the payback period for AI investments, capital spending, and companies' profitability.
II. October nonfarm payrolls beat expectations on November 6, lifting U.S. stocks, but a bottom is not yet confirmed
U.S. nonfarm payrolls increased by 165,000 in October, well above the market expectation of about 65,000; the unemployment rate fell from 4.2% to 4.1%.
Stronger-than-expected employment data suggests the U.S. economy has not yet shown the pronounced deterioration the market feared, but it could also make the Fed more cautious about cutting rates.
After the data was released, U.S. tech stocks rebounded: the Nasdaq rose about 1.09%, the S&P 500 gained about 0.32%, while the Dow fell about 0.46%.
Notably, BTC had still been dragged down by selling in AI risk assets, falling more than 5% at one point on November 5, while liquidations in the crypto market exceeded $1 billion.
So my assessment is that some of the earlier panic may have eased, but that doesn't mean all the bad news is fully priced in, let alone that the market has definitively bottomed.
III. Anthropic's IPO: A major catalyst, but with risks that cannot be ignored
Anthropic has filed IPO registration documents with the SEC, and plans to list on Nasdaq under the ticker ANT.
According to the company's latest disclosure, revenue was about $16.96 billion in the third quarter of 2026 and about $33.24 billion in the first nine months, reflecting very rapid business growth.
But the other side is also worth noting: the company reported a net loss of about $23.29 billion in the third quarter and disclosed commitments to AI computing capacity and infrastructure spending totaling as much as $895.4 billion, including about $69.8 billion over the next 12 months.
This shows that Anthropic's commercial growth is very strong, but its computing investment and funding needs are equally staggering.
The roadshow is currently rumored to be planned for the week of November 9, but a November 5 Reuters report said some potential investors considered the previously discussed $1.5 trillion valuation too high. Market volatility could also affect the timing and pricing of the offering.
Therefore, Anthropic's IPO could indeed become a major catalyst for AI stocks, but a listing doesn't mean the share price will necessarily rise, nor does it mean all AI assets will rally in tandem.
IV. Trader's trading strategy
I remain bullish on the long-term development of the AI industry and continue to follow related assets such as Anthropic, GOOGL, NVDA, and AMD.
But my trading principles won't change because of one sharp drop or one rebound:
1️⃣ Spot: Don't use leverage. Monitor fundamentals and valuations in stages, and avoid going all-in to buy the dip.
2️⃣ Futures: Don't guess the bottom or chase the first big rebound candle. Wait for a price breakout and a confirmed retest before considering a follow-up entry.
3️⃣ Risk management: If the rebound fails to form a valid structure, or the price falls below a key low again, reassess rather than blindly adding to the position.
I always stick to one principle:
Data is a catalyst; price structure is the trading signal. Let the market provide the answer instead of trying to predict it.
The long-term direction of AI may be unchanged, but in the short term, the market still needs price action to confirm it.
Where do you think the AI sector will go next after this correction?
A. The long-term AI thesis is intact; remain bullish 🚀
B. Valuations are still high; further correction is needed 📉
C. Anthropic's IPO will drive an AI rebound 💡
D. Wait for a breakout and retest before entering 🛡️
Share your views in the comments! 👇
(The above reflects personal views and a review of market activity, is for discussion only, and does not constitute investment advice.)