Square
Following
Hot
News
Notifications
Profile
Share your thoughts
placeholder
Article
Genuine question: Are girls’ dorm rooms all this messy these days?
post-image
$ARX Down 10.68% in a day, with the current price at 0.2158—just a hair above the 24-hour low of 0.2143. This isn’t a pullback; the bulls’ defenses are being tested inch by inch. Trading volume of 3.4M suggests selling pressure isn’t particularly heavy; this looks more like a slippage-driven selloff in thin liquidity. If a candle body closes below 0.2143, there’s basically a vacuum below. My approach: don’t catch a falling knife. Wait for a high-volume, 1-hour candle showing the decline has stalled near 0.2143 before considering a small long position, capped at 5%, with a stop-loss at 0.2080 (
ARX-2.47%
Trenches
ZIG
Z
bade
b
ZIG
0x8c...1145
Market Cap
$.
Change
.
24h Vol
$.
Holders
.
BTC
B
bade
b
BTC
C5xp...pump
Market Cap
$.
Change
.
24h Vol
$.
Holders
.
José
J
bade
b
José
87CQ...1UJT
Market Cap
$.
Change
.
24h Vol
$.
Holders
.
STONK
S
bade
b
STONK
6GmA...UNgx
Market Cap
$.
Change
.
24h Vol
$.
Holders
.
IDOL
I
bade
b
IDOL
0x3b...ab07
Market Cap
$.
Change
.
24h Vol
$.
Holders
.
$IDOL I went from being down 40% to recovering my losses this time, all because I didn’t cut my losses at 0.023. Let’s get straight to the point.
Up 36.55% in 24h, currently at 0.0348. It briefly hit 0.0456 before getting dumped back down. Trading volume came in at $400 million—that’s explosive for a small-cap coin. But note that the turnover rate is already absurdly high, which means tokens are changing hands on a massive scale, not that there’s one-way accumulation.
On fundamentals, I’ve looked through IDOL’s contracts. The token’s utility is focused on ecosystem governance and node staking,
IDOL-6.71%
👀 THE NEXT VIRAL #MEMECOIN COULD BE HIDING IN PLAIN SIGHT! 🚀
Who's holding a low-cap gem before it gets the spotlight? 💎
Shill your strongest 1000X candidate below! 👇🔥
Let's discover the next big community together.
#Memecoins #Crypto #1000XGems #Altseason
post-image
MEME-0.94%
More and more people are waking up. I don't know if that's a good thing or a bad thing.
What do you mean, your social security is hitting you?
I don't even know how to respond to that 🙈
post-image
$YB SHORTYB hasn't managed to defend its earlier price levels. Sellers still have an opportunity to push this market lower.entry: 0.05113tp1: 0.05021tp2: 0.04928stop: 0.05266
post-image
YB+2.91%
$Bull Run is staging a strong bullish rebound, up more than 10% and nearing the $0.0600 resistance level! If the breakout is confirmed, the rally could extend to $0.0630. Trading plan (long): Entry: $0.0585 – $0.0593 Target levels: $0.0600 / $0.0615 / $0.0630 Stop-loss: $0.0570
post-image
牛来-1.82%
🚀 Let's grow together on X!
🤝 Followed? I’ll follow back!
❤️ Like, comment, and share.
🔁 Retweet to show your support!
Nobody grows alone here. Together, we’re stronger! 💪
#SDV #FollowForFollow #LeftFollowsLeft
post-image
Live: Where is the Market Heading Today?
live-cover
LIVE453
$XRP On the 4-hour chart, bears are still firmly in control, with the price stuck near 1.16 while the 4-hour EMA50 has slipped to 1.24; trading below the moving average indicates that sellers are still setting the pace. My plan is to open a short in the 4-hour resistance zone, with an entry range of 1.161–1.163. As long as 1.16 is not decisively broken, I’m looking at three successive targets below: 1.157, 1.153, and 1.148. I’ll set the stop-loss at 1.171; if the price breaks above 1.17, this bearish thesis is invalidated, and I’ll exit without hesitation. Based on the risk calculation, the s
post-image
XRP-1.15%
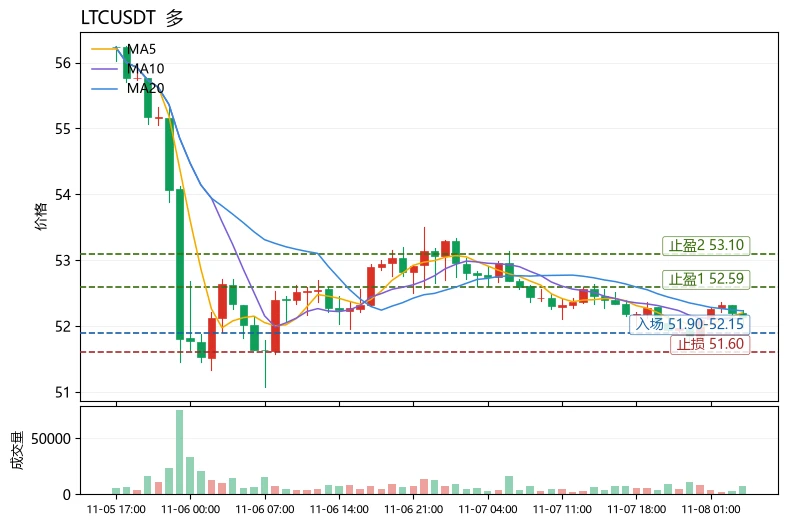
$LTC Current price: 52.14. The first resistance above is the Bollinger upper band at 52.59, and support below is the Bollinger lower band at 51.87. These two levels are where bulls and bears are currently locked in a short-term battle. Why give the price levels before explaining the logic? Because the first step in reading a chart is always to establish your bearings, not to predict.

Using LTC as an example, here's a reusable way to assess trend health: moving averages show direction, MACD shows momentum, and RSI shows positioning. A healthy trend requires all three to align. Currently, MA5=5
post-image
LTC-0.09%
PEPE+0.97%
$ONE and $KOMA have both seen their upward momentum weaken noticeably after a rapid rally, with signs of exhaustion emerging in the market. I personally think a pullback is likely next, and I’ve already started building short positions.
$ONE futures short plan: Entry at 0.00240, first target at 0.00156, with defense at 0.00269.
$KOMA futures short plan: Entry at 0.01648, target at 0.01423, stop-loss at 0.01710.
The above is only a personal trading idea and does not constitute investment advice. Futures leverage carries extremely high risk, so please manage your position carefully.
post-image
KOMA-3.91%
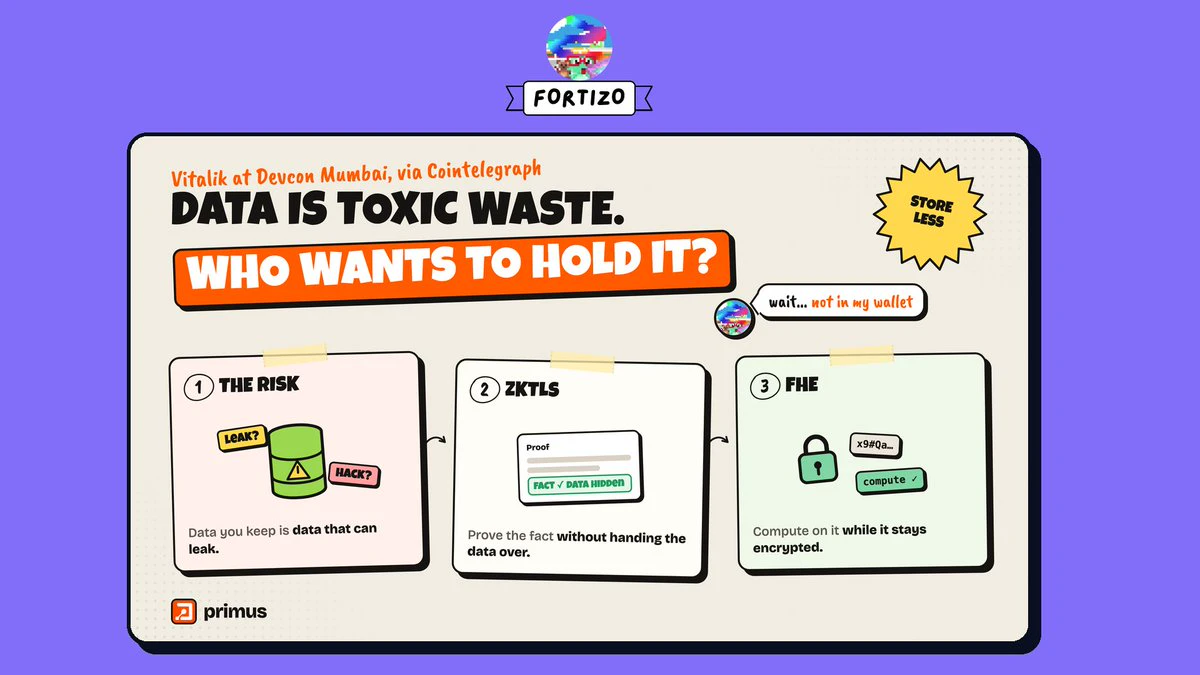
Vitalik says treat data as toxic waste. So who wants to hold it?
Institutions still have to prove things.
@primus_labs' answer: zkTLS proves the fact, FHE computes on it encrypted. Store less, expose less, still verify.
➙
post-image
FHE-3.50%
I don't day trade.
I don't sell covered calls.
I don't sell cash secured puts.
I don't buy weekly options.
I don't run spreads.
I don't watch screens all day.
I don't trade on the news.
I don't care what the market does day to day.
What I do:
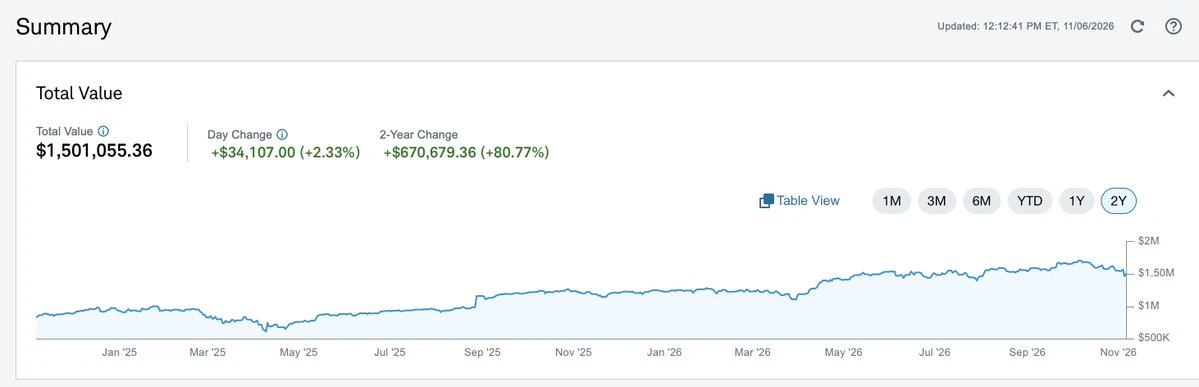
$3M+ in $VOO + $Q + Elite companies that never gets sold.
1+ year portfolio secured puts on great companies below fair value, secured by that base.
Every premium goes back into the base.
Ratios in check so a 50% crash can't force my hand.
$25k+ a month. 10 minutes a day. Don't complicate it.
post-image
VOO+0.33%
Guys, I'm opening a long position on $ZEC here‼️ Take profit: $1,290 / $1,310 / $1,340 Stop loss: $1,238.62 Be sure to manage risk and wait for a confirmation signal.
post-image
ZEC+1.16%
St-Irenaeus was the first to show how apostolic succession had been institutionalized in the line of bishops in every church and that his list of Popes, complied around 170AD is the earliest witness we have to the immediate successors of St-Peter.
@grok Am I right?
post-image
OANDO
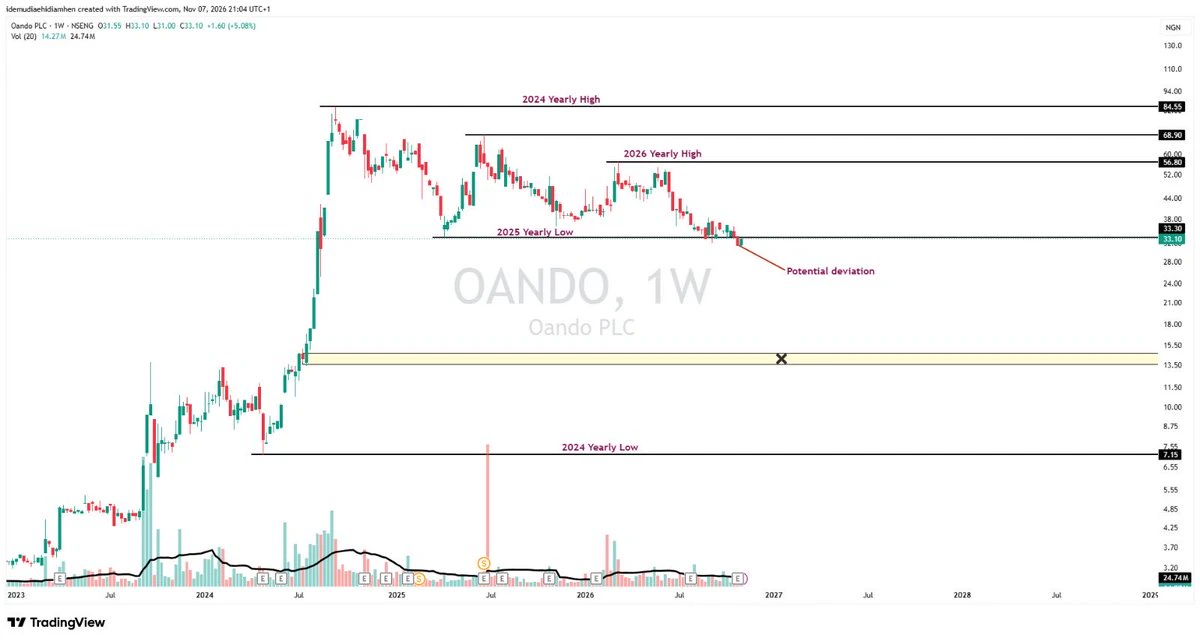
Warning: OANDO's fundamentals are shite; I am gonna only focus on technicals.
Last week, we formed a potential deviation, and I expect a potential bounce to come next week. All I wanna see is the bulls reclaiming the 2025 yearly low of N33.1/share.
Failure to reclaim the 2025 yearly low; then the next zone is the X market zone in the region of N13.6-N14.7 per share, which I doubt the market makers of OANDO will want to happen.
Personally, I will never trade this company till I see the right momentum, but this is a memestock
#NFA
post-image
Allowlisted for @torpornet (tier A). Applicant 24904. 4,444 frogs, built to sit. Check yours:
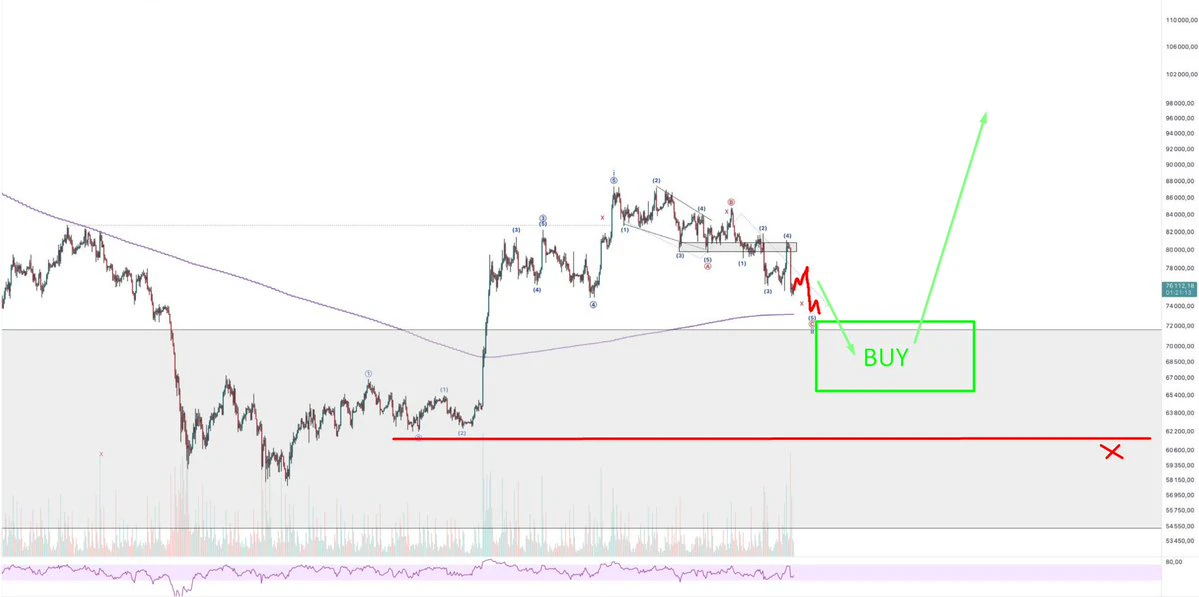
$BTC
My mid-term setup for #BTC: still waiting for one more dip down into the target zone before looking for long entries.
Bullish setup is invalidated on a clean close below 62k
post-image
BTC-0.67%
[NEWSTREAMER]market update
live-cover
LIVE1,658
Load More

Join 40 M users in our growing community

⚡️ Join 40 M users in the crypto craze discussion

💬 Engage with your favorite top creators

👍 See what interests you

Trending Topics

USAIStocksHitHard

21.1k Views3.67k Discussing

U.S. stocks sold off sharply on Thursday, November 5 (UTC). The Nasdaq closed down around 5.5%, entering correction territory, while the Philadelphia Semiconductor Index plunged roughly 12%, with chip stocks including $NVDA and $AMD posting steep losses. Beyond profit-taking, investors are growing concerned about the pace of AI data center construction, capital spending, and future returns on investment. The key question now is whether the AI sector’s lofty growth expectations need to be repriced. Where do you think the next opportunities will emerge: chip stocks, tech giants, or other sectors?

USNonfarmPayrolls

34.41k Views4.34k Discussing

StakeOnLaunchpoolToShare450KVLX

9.9k Views828 Discussing

View More