



Square
Following
Hot
News
Profile
Share your thoughts
placeholder
Article
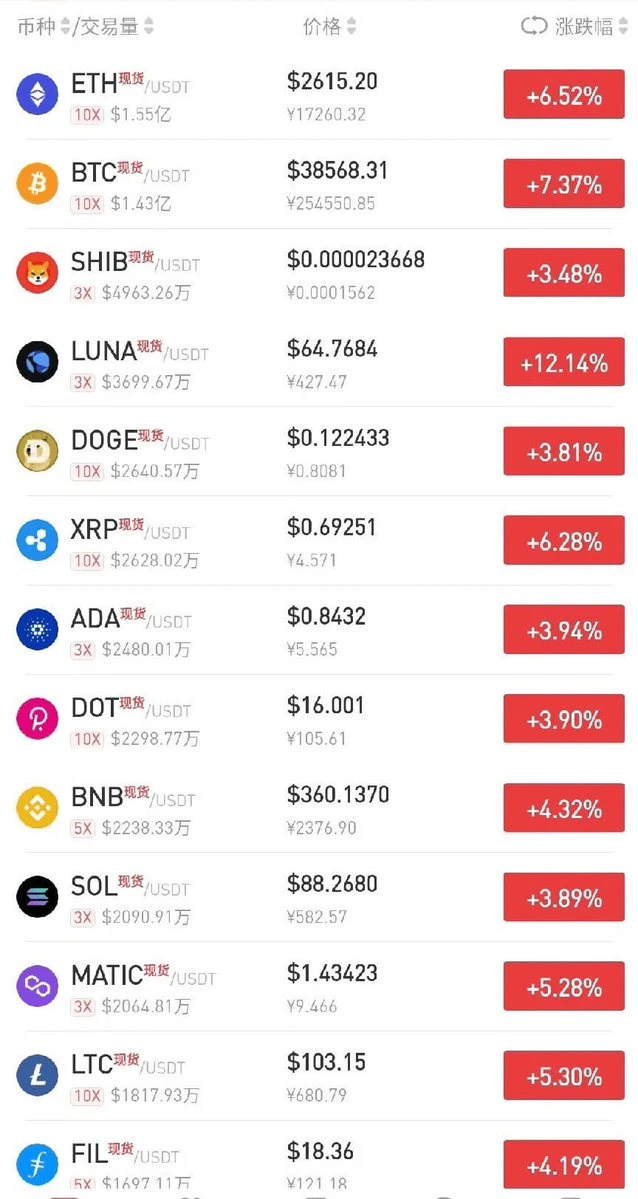
Look at the 2023 screenshot—Ethereum traders aren't allowed to mock A-share traders anymore 😂
post-image
ETH-1.26%
  • 1
daily market review
live-cover
LIVE2,377
Trenches
ZIG
Z
bade
b
ZIG
0x8c...1145
Market Cap
$.
Change
.
24h Vol
$.
Holders
.
STONK
S
bade
b
STONK
6GmA...UNgx
Market Cap
$.
Change
.
24h Vol
$.
Holders
.
AMD
A
bade
b
AMD
DDmG...pump
Market Cap
$.
Change
.
24h Vol
$.
Holders
.
BTC
B
bade
b
BTC
C5xp...pump
Market Cap
$.
Change
.
24h Vol
$.
Holders
.
AGT
A
bade
b
AGT
0x5d...e274
Market Cap
$.
Change
.
24h Vol
$.
Holders
.
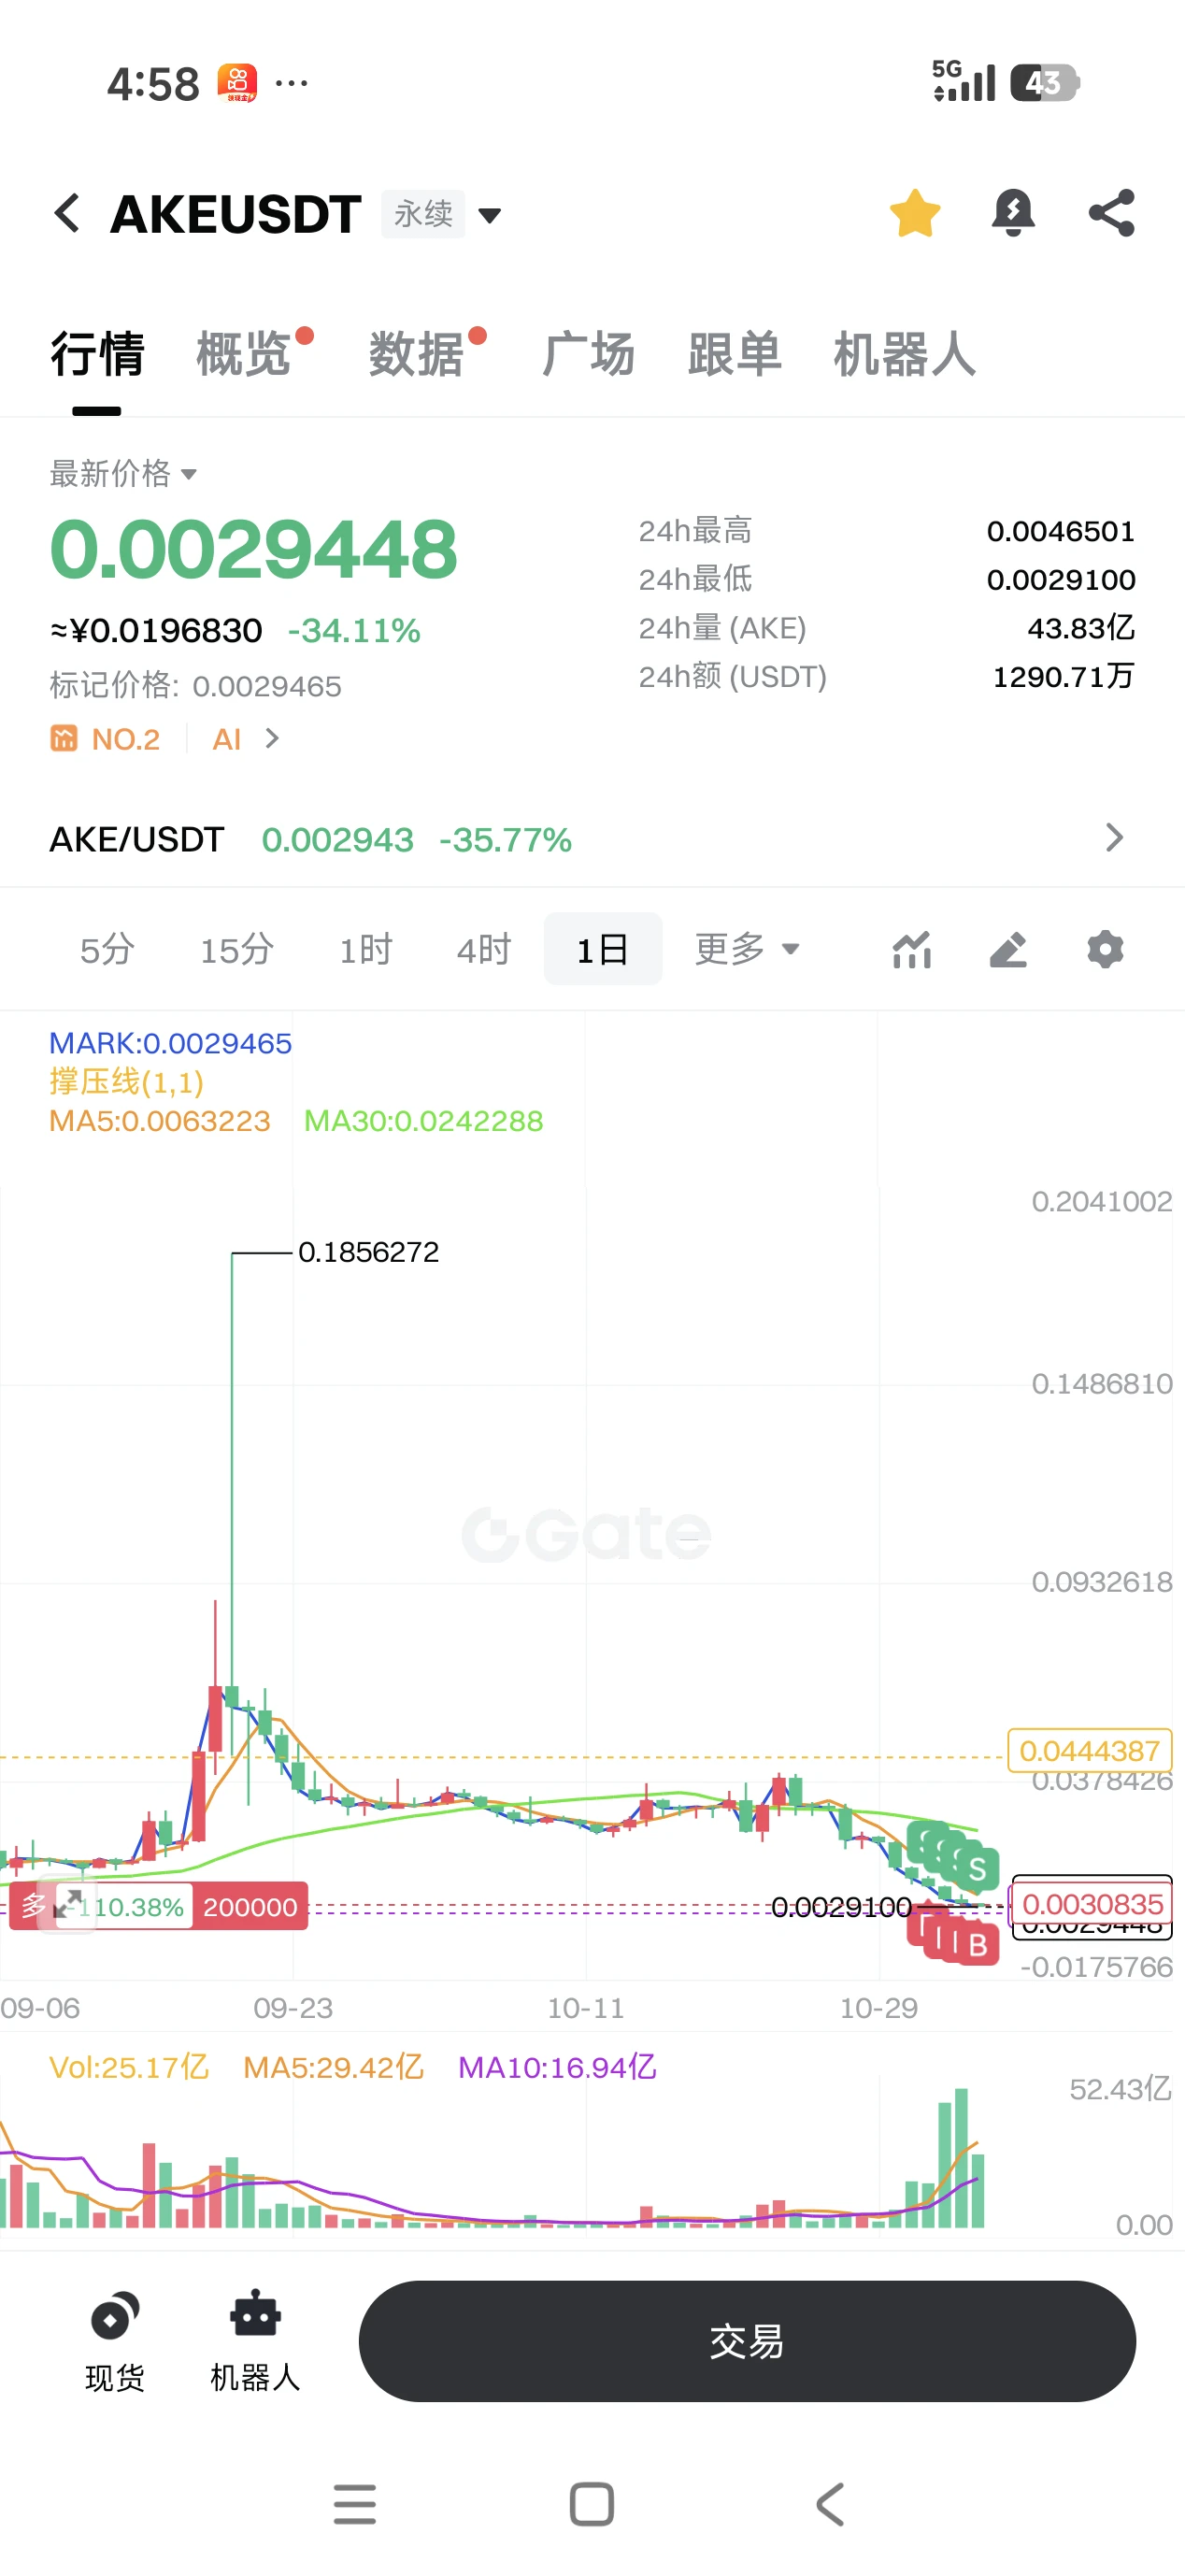
#AKE There is no bottom, only lower; that damn market maker should have their whole family skinned alive
post-image
AKE+6.07%
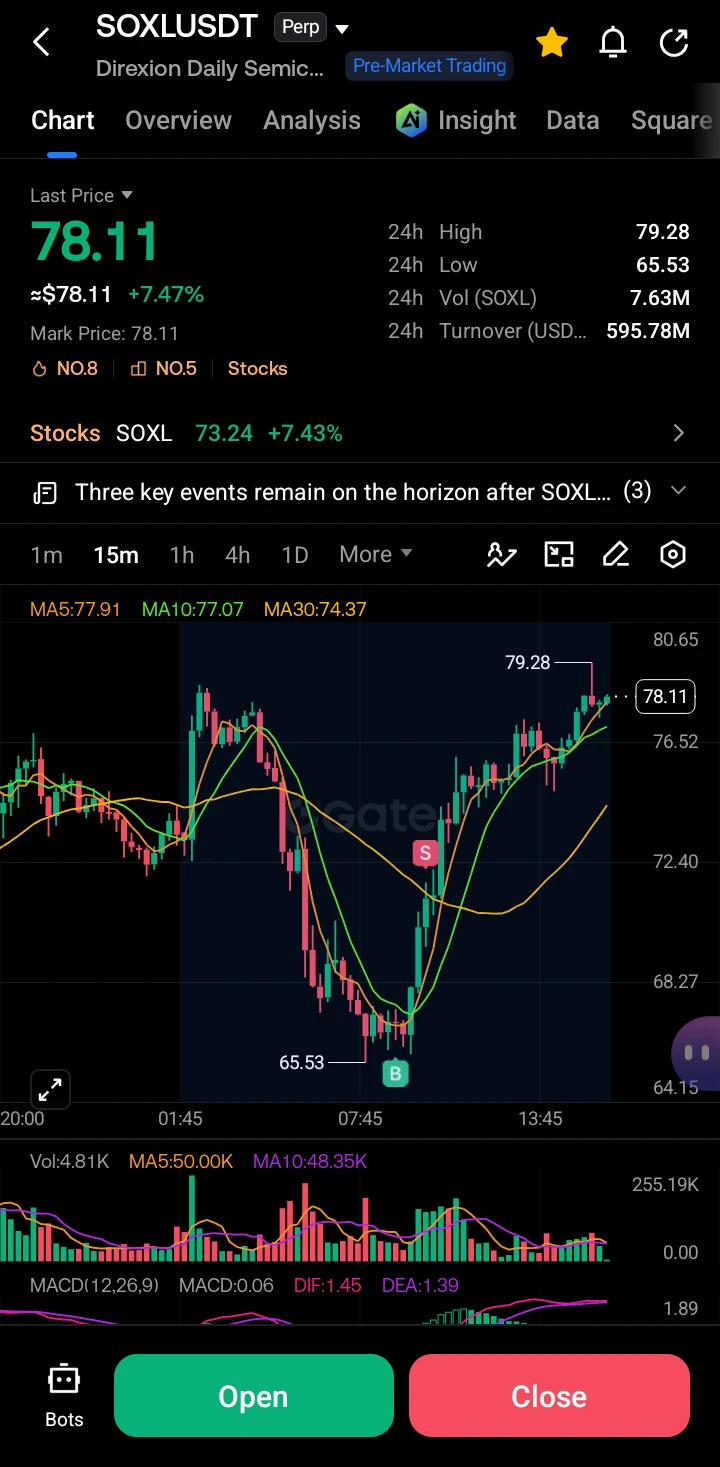
$SOXL ‌
SOXL is showing strong short-term bullish momentum, currently trading at 78.11 (+7.47%) after a sharp V-shaped recovery from the daily low of 65.53. Price is trading well above the short-term moving averages (MA5, MA10, MA30), indicating buyers are in control, though it is currently pulling back slightly from the 24h high of 79.28.
· Resistance: 79.28 (24h High) and 80.65 (upper chart boundary).
· Support: 77.07 (MA10) and 74.37 (MA30).
The price action displays a strong impulsive upward wave followed by a consolidation phase near the highs. The moving averages are fanned out in a bul
post-image
SOXL-1.16%
  • 8
  • 1
Identity politics has gone so far that no one can even say what country she’s from. Voters only realize the bill has come due after they’ve cast their ballots. Those of us watching from the East all have the same reaction: keep the gates tightly guarded. Let’s check back next week to see if that assessment was right.
post-image
  • 11
  • 1
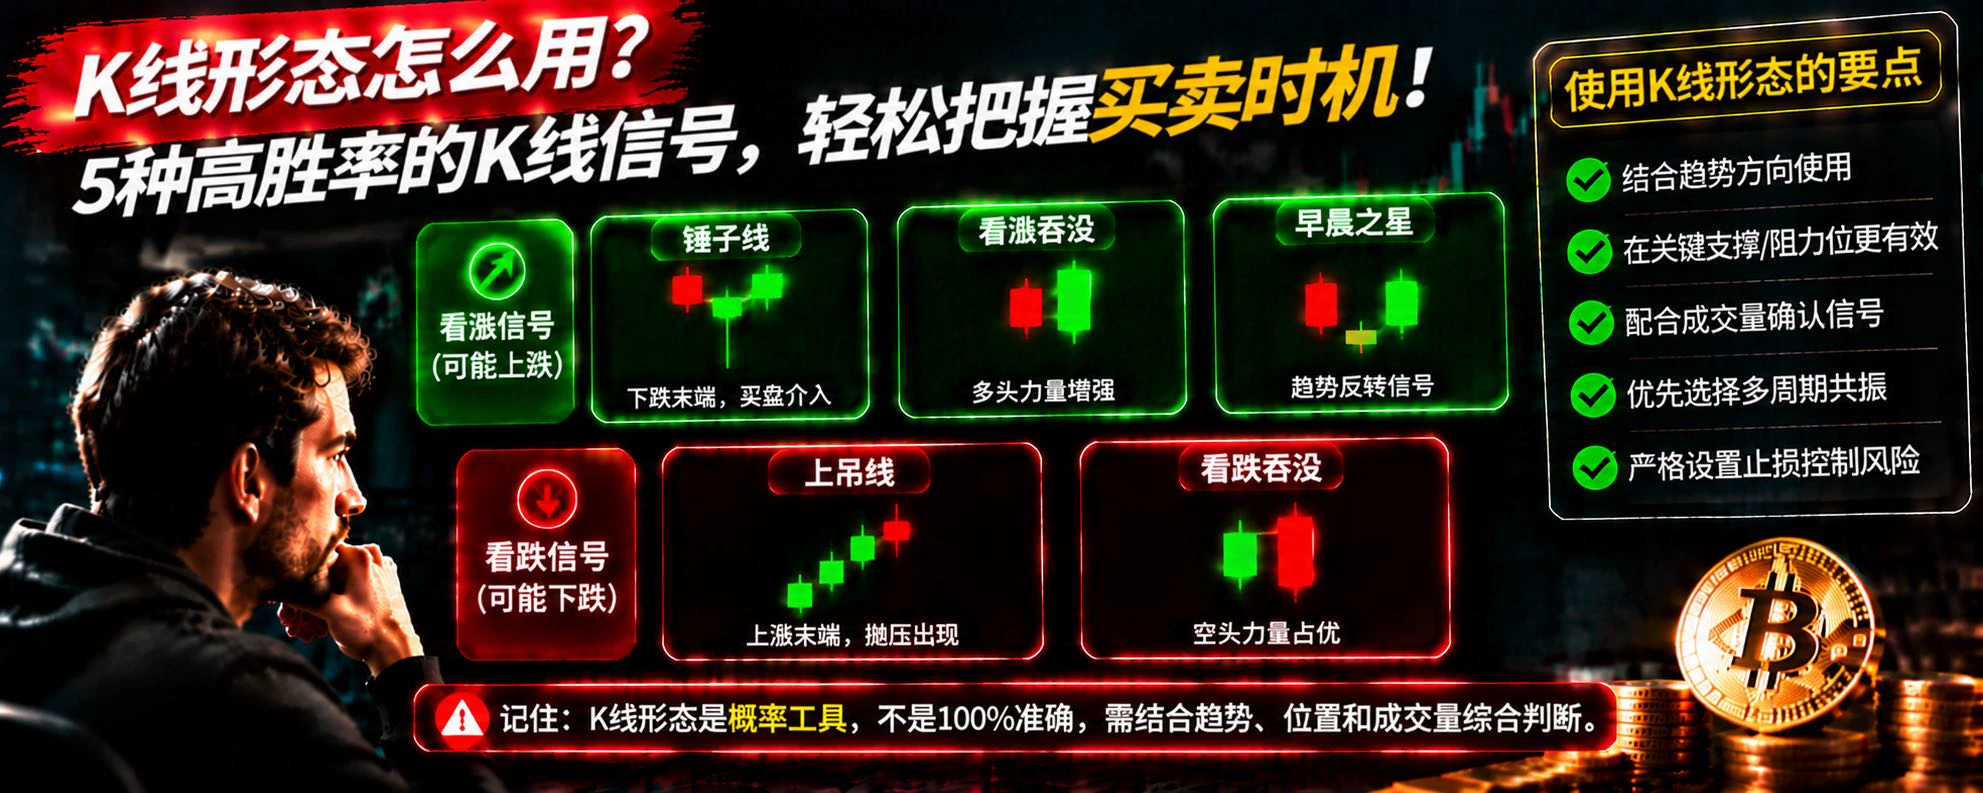
How to Use Candlestick Patterns? 5 Common Signals to Help Identify BTC Buying and Selling Opportunities
In crypto trading, many people look at candlestick charts every day, but few truly understand the market sentiment behind them.
Why does BTC rise rapidly after some candlesticks appear? Why does the price continue falling after some patterns appear?
Today, we’ll introduce 5 common candlestick patterns.
First, the hammer. It usually appears in a downtrend, with a long lower wick and a relatively small body. It indicates that buyers stepped in after the price fell and may signal a short-term r
post-image
BTC-0.67%
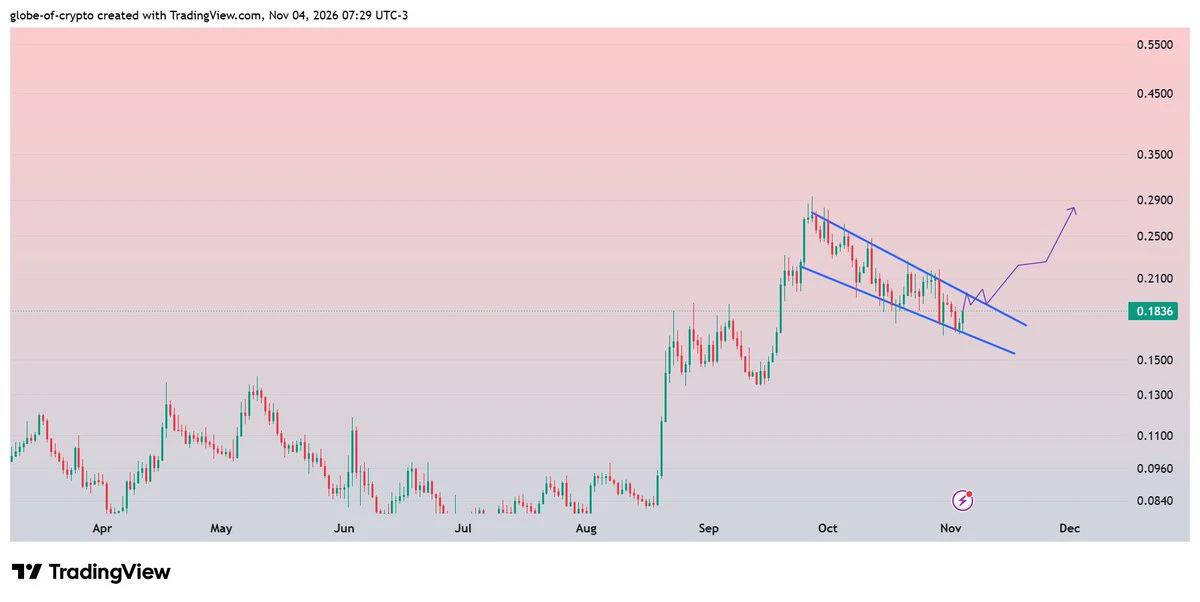
$ENA #ENA
Rising within the range of Bullish Flag.
Breakout could resume the bullish momentum with 50-60% rise✍️
post-image
ENA+8.04%
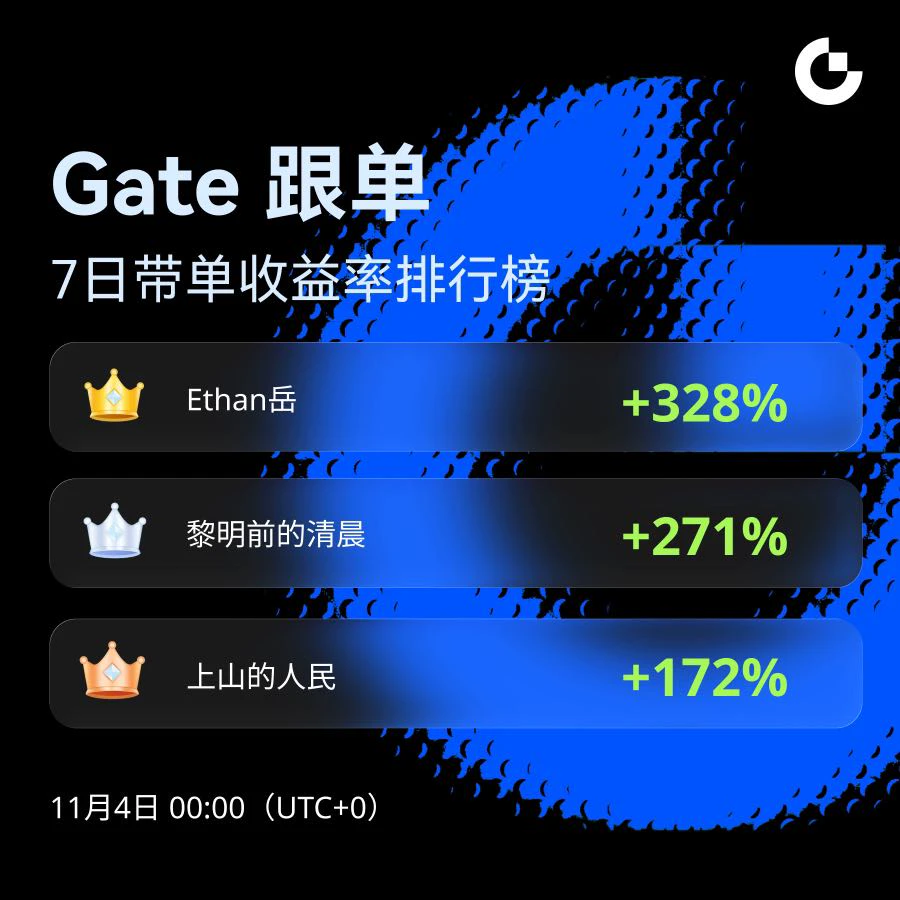
📈 Witness the real returns of top traders!
Top Copy Traders by 7-Day Returns
🥇 Ethan Yue: +328%
🥈 Dawn Before Sunrise: +271%
🥉 People Climbing the Mountain: +172%
Instead of blindly feeling your way around, copy success directly. Copy in one tap and let your returns run!
🔗 Follow Now: https://www.gate.com/copytrading
#跟单 #交易高手 #收益
CopyTrading
📈 Witness the real returns of top traders!
Top Copy Traders by 7-Day Returns
🥇 Ethan Yue: +328%
🥈 Dawn Before Sunrise: +271%
🥉 People Climbing the Mountain: +172%
Instead of blindly feeling your way around, copy success directly. Copy in one tap and let your returns run!
🔗 Follow Now: https://www.gate.com/copytrading
#跟单 #交易高手 #收益
repost-content-media
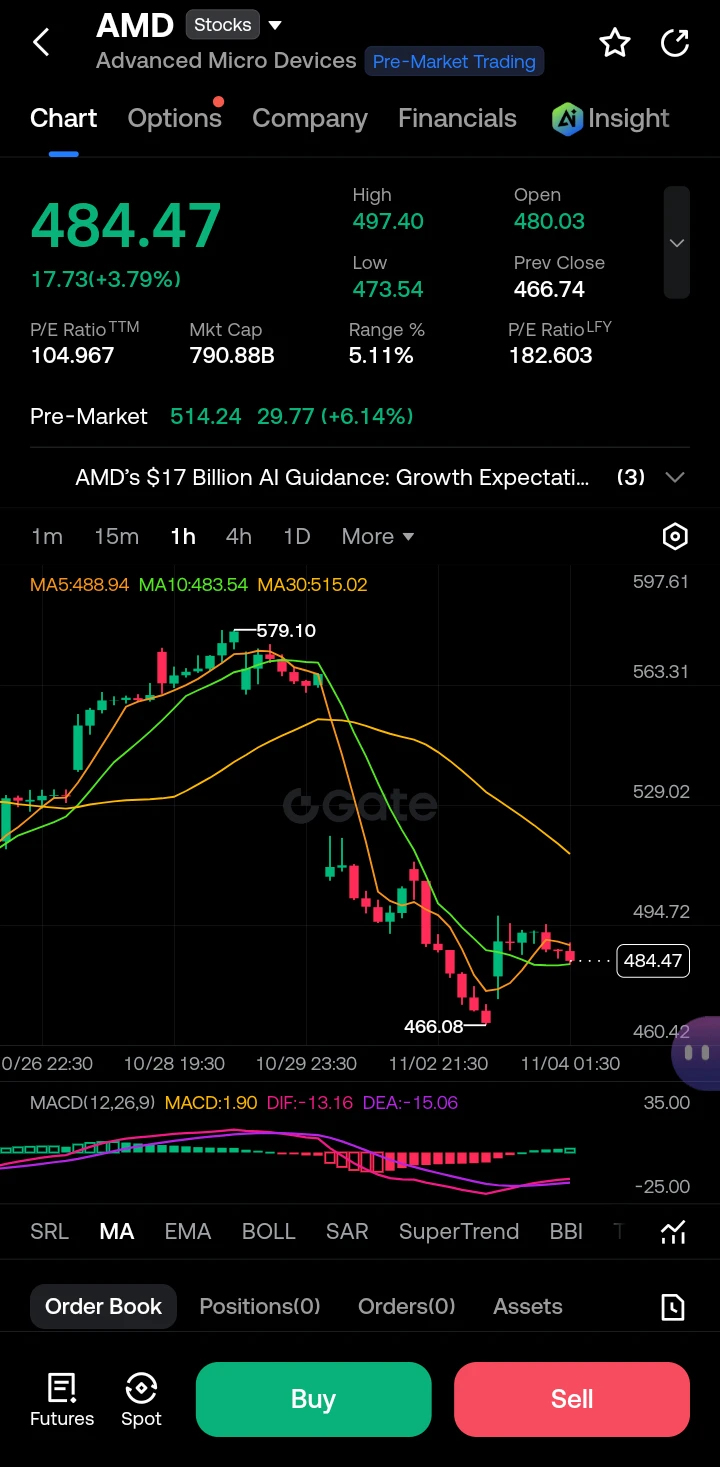
AMD is staging a powerful gap-up recovery after Q3 earnings crushed estimates, but price is now testing a heavy resistance cluster that will decide whether this is a true trend reversal or just a violent bounce.
$AMD ‌
📊 Current Market Situation
AMD closed at 483.47 (+3.79%) before earnings, then exploded in pre-market to 514.24 (+6.14%) after Q3 revenue hit $13.38B** (+45% YoY) and Q4 guidance of **$17B blew past the $16.2B consensus . Data Center revenue nearly doubled (+97% YoY), now 64% of total sales . However, the chart shows price is still below the 20-day ($553.92) and 50-day ($548.7
post-image
AMD+3.79%
  • 9
  • 3
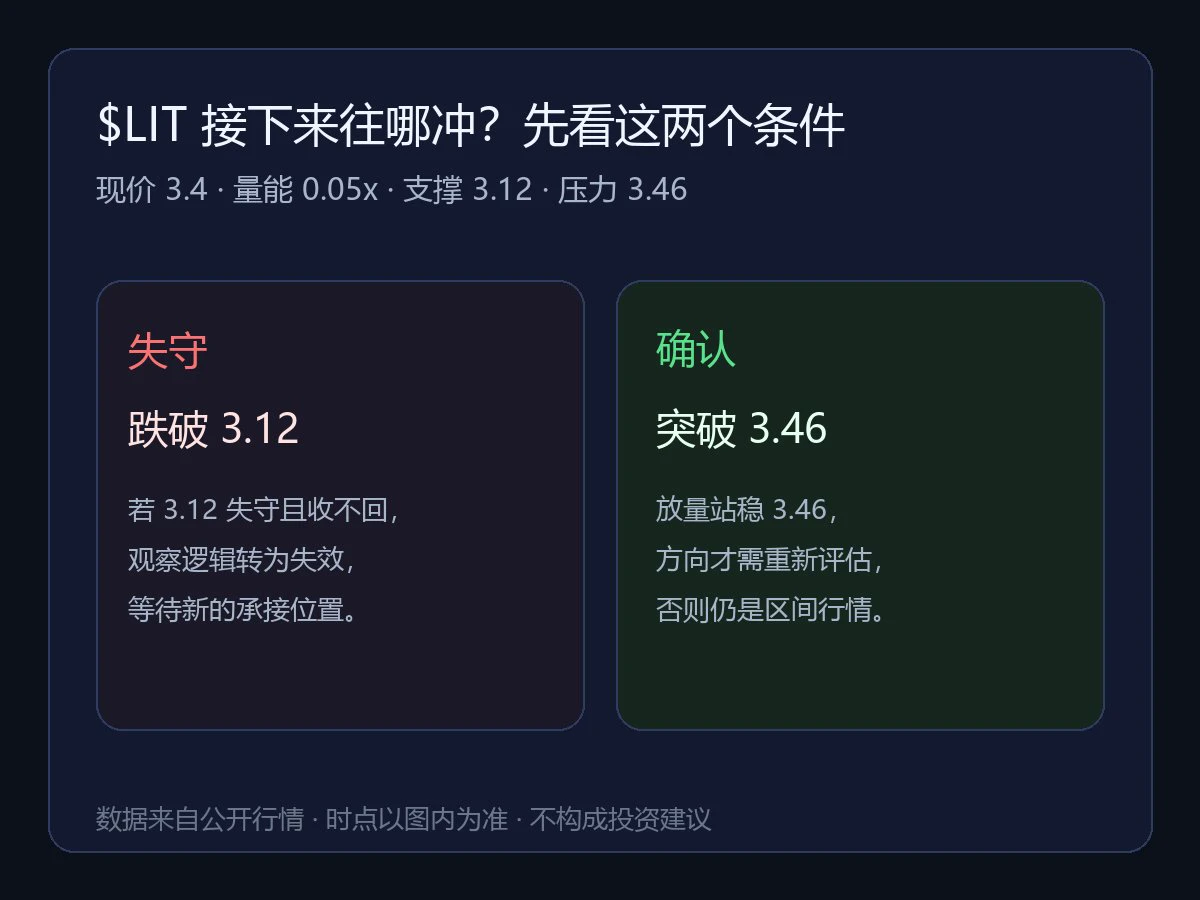
LITUSDT Short-Term Bias Is Strong: Key Levels to Watch Amid Low Volume
$LIT The current price is 3.3955, with a 24-hour change of 7.7970729229499325%, an intraday high of 3.4571, and a low of 3.1173. In the short term, the 1-hour trend is strong, and the 4-hour trend is also strong. Both timeframes are aligned, indicating a strong bias. However, alignment alone does not confirm a trend; actual trading activity still needs to validate it. Within a multi-timeframe analysis framework, there is no divergence between the short- and medium-term directions. This kind of alignment generally suggests t
post-image
LIT-4.56%
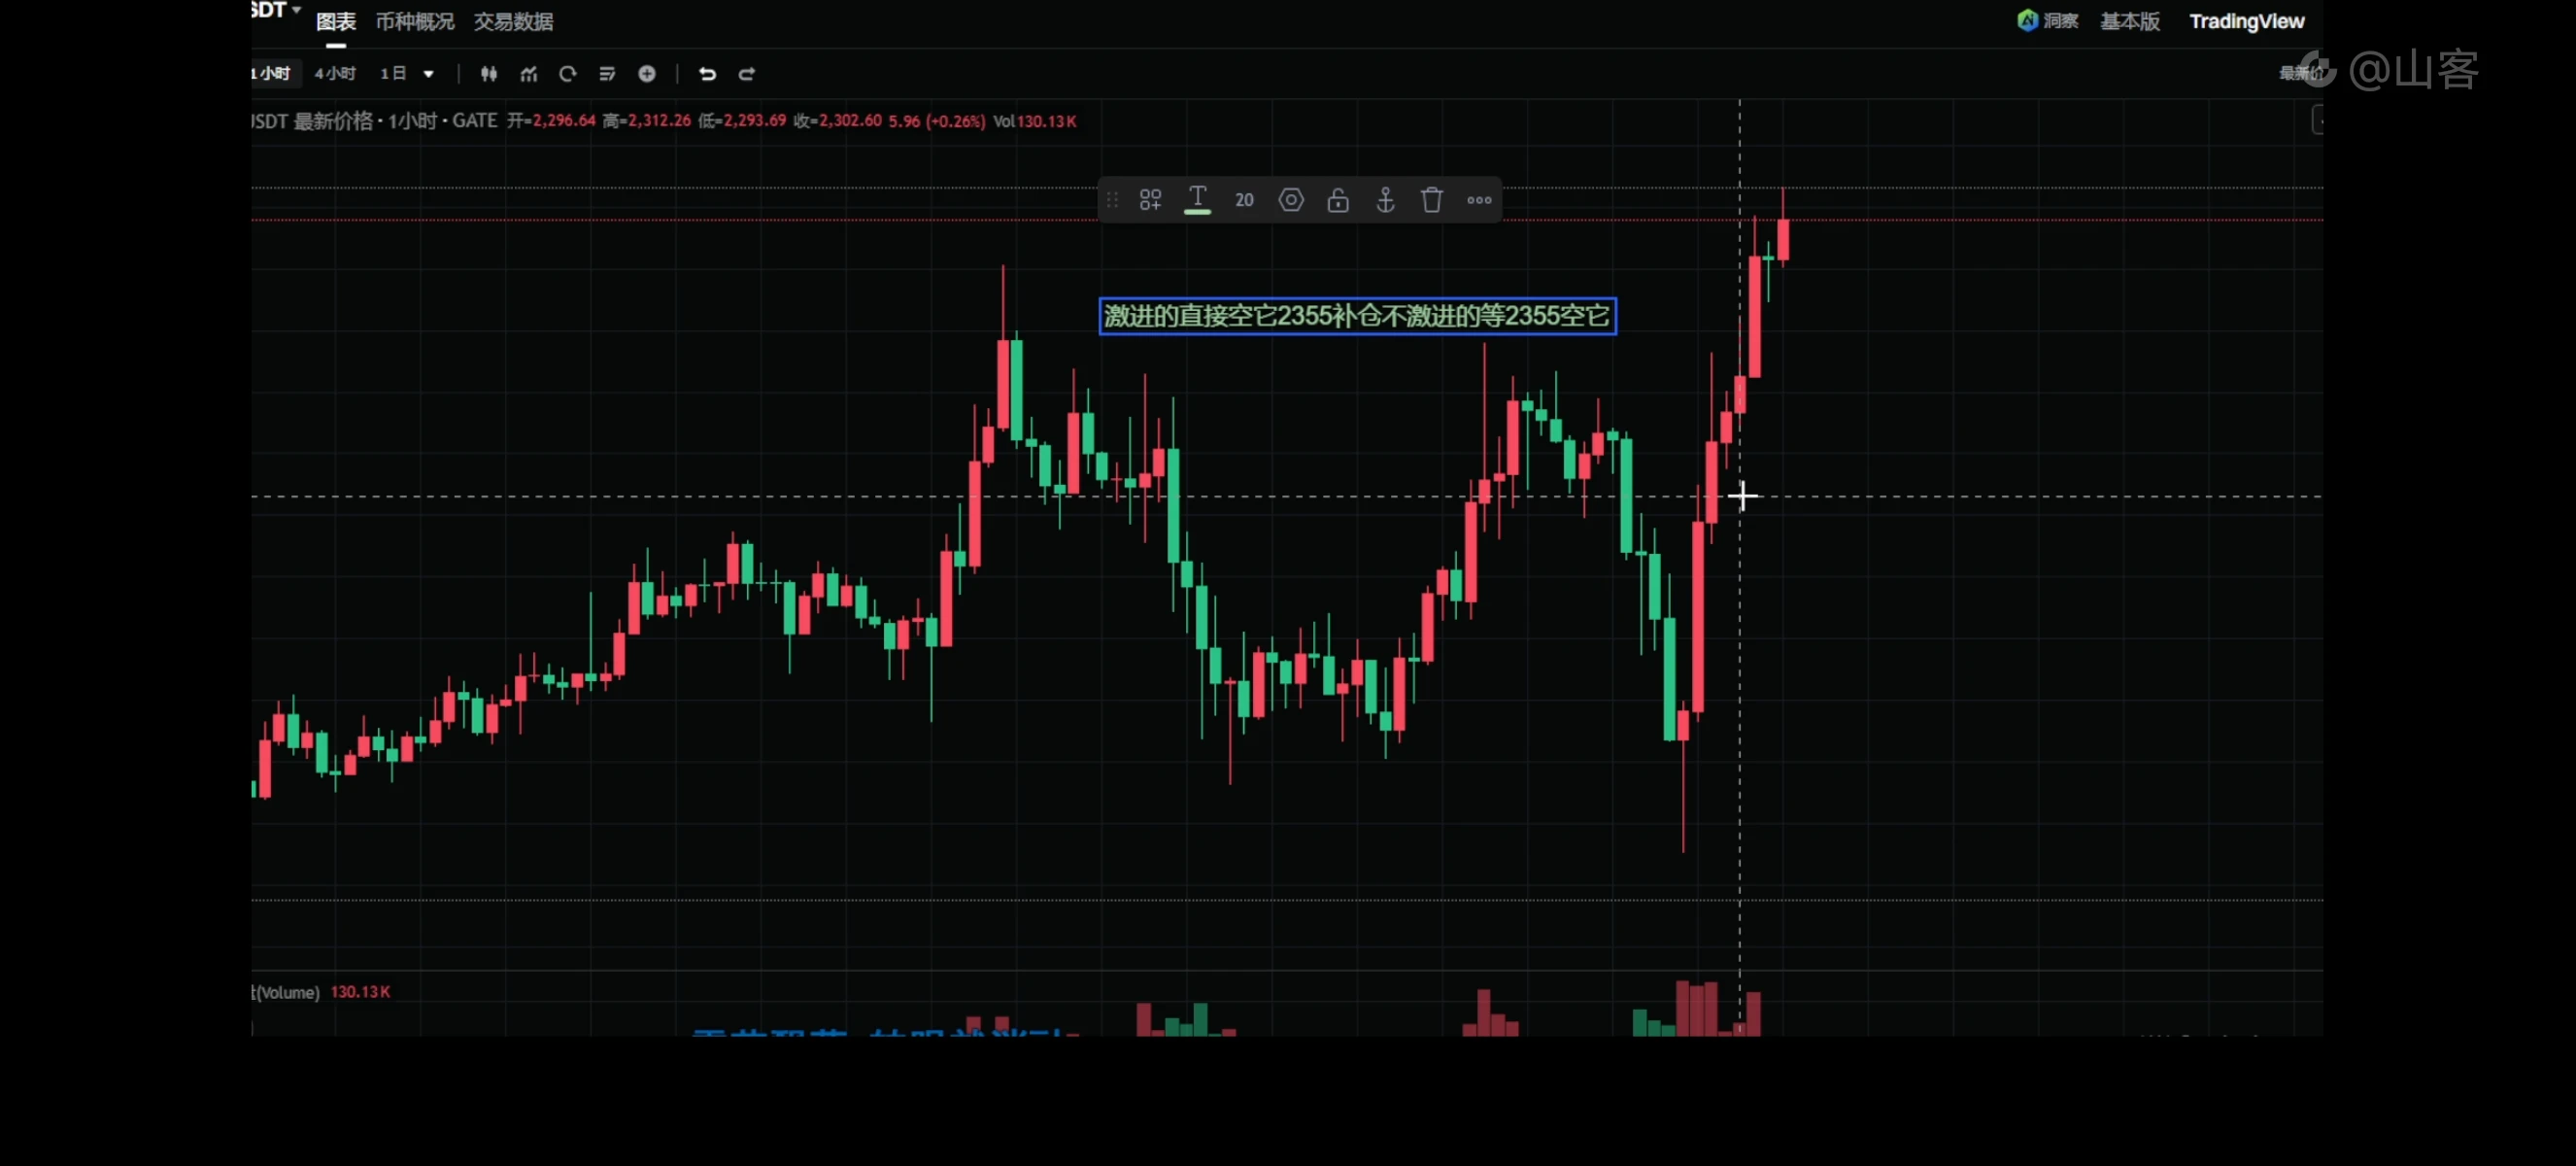
BTC surged from 75700 to 78700 this afternoon. Chasing higher tonight is simply out of the question after a 3000-point rally. Resistance is at 79300, so consider opening a short position near 79300, targeting 76000. Also watch out for surprise news tonight, with a stop above 80000$BTC $ETH #Gate上线台股交易
BTC-0.67%
ETH-1.26%
GM IF U DANCE ☕
post-image
Want to become a top crypto influencer?
Actually, you only need two things:
Grok Bot
KOL Style Town (a temporary website I built)
▌ How to use the website
1/ Open
2/ Search at the top for the KOL you want to learn from
3/ Go to their profile and pick a style
4/ Copy the prompt, paste it into Grok Bot (or any AI assistant), and follow the instructions to add a specific event or viewpoint
5/ Once you have a draft, preview and edit it yourself
The KOLs currently featured include @GuHype, @Wangduanniao, @wolfyxbt, @ai_9684xtpa, @momochenming, @lijiuer1, and others.
I picked some creators with dist
Short sellers, assemble, assemble! Check the chart position and short it! Short sellers, assemble, assemble
post-image
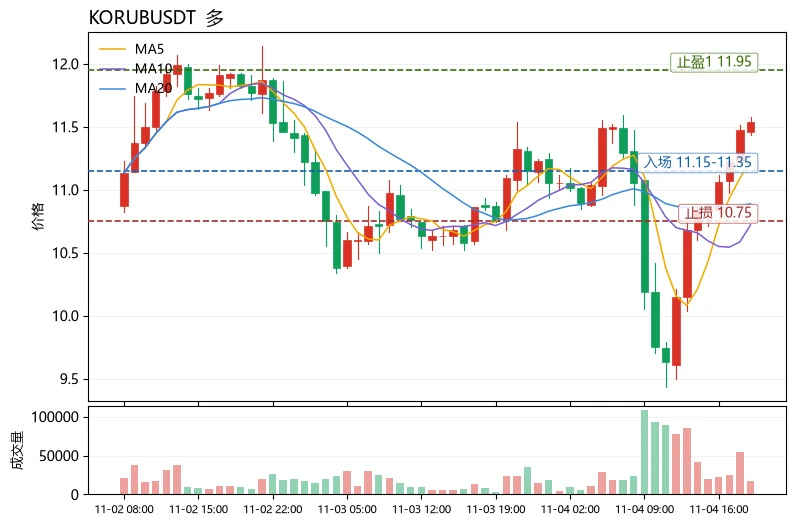
$KORUB, +6.76% over 24h, is not up as much as LSK at +13.69%, but its trading volume of 9.2M is notably higher than LSK’s 5.6M. Its price is just below the Bollinger upper band at 11.9726, approaching the top; MA5=11.23 is above MA20=10.888, forming a bullish alignment, while RSI at 61.1 is strong but not yet overbought. In the same sector, PEPE’s RSI has already reached 70.4, with its price close to the Bollinger upper band at 5.11642e-06, making chasing the rally riskier; $KORUB has healthier relative strength and is the asset that “has risen steadily without rushing, with the strongest str
post-image
KORUB
KORUBSouth Korea Bull
Four.meme
MC:$3.67KHolders:1
0%
LSK-5.32%
PEPE+0.97%
Compounding is a miracle, but knowing when to stop is a matter of chance
post-image
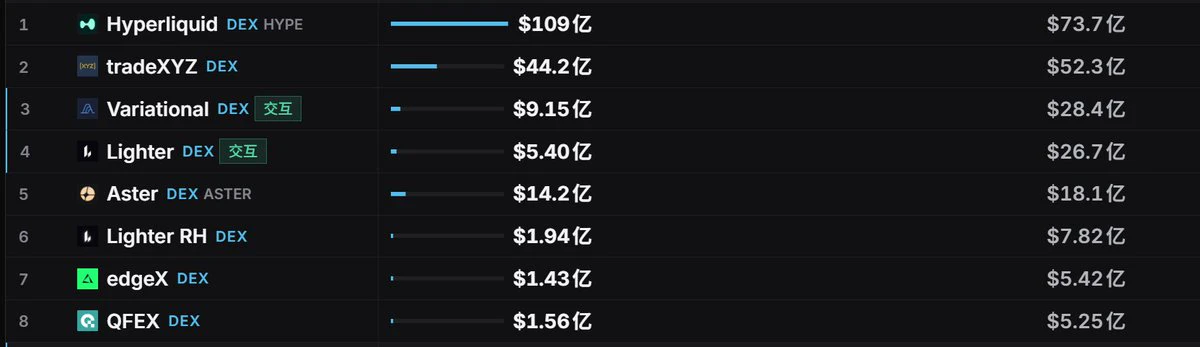
Why are QFEX @QFEX's metrics so good? Is it a potential gem?
post-image
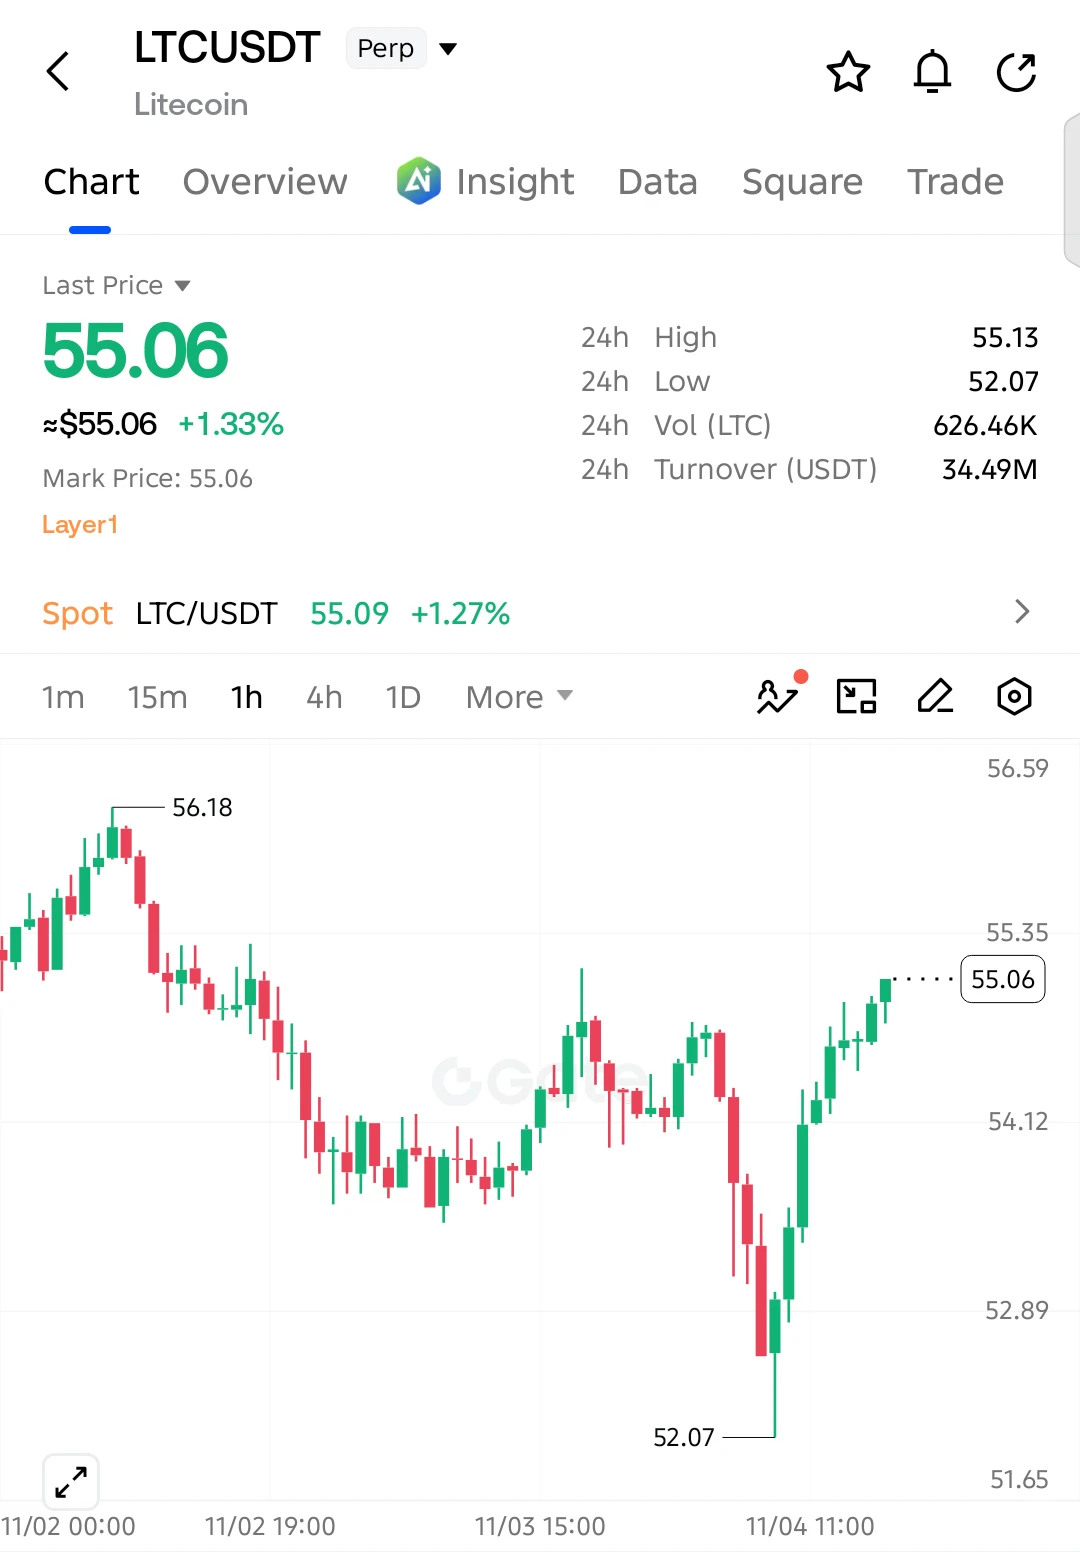
$LTC $LTC LONG SETUP — Bulls Are Back in Control!
Entry: 55.06
SL: 54.55
TP1: 55.35
TP2: 55.75
TP3: 56.18
Final Target: 56.60
$LTC has staged a strong recovery from 52.07, with buyers pushing price higher through consecutive bullish candles. Momentum is improving, and a breakout above 55.13 could open the way toward 55.75–56.18.
Invalidation: A sustained move below 54.55 would weaken the bullish setup.
post-image
LTC-0.07%
  • 4
Analysis crypto coin
live-cover
LIVE2,131
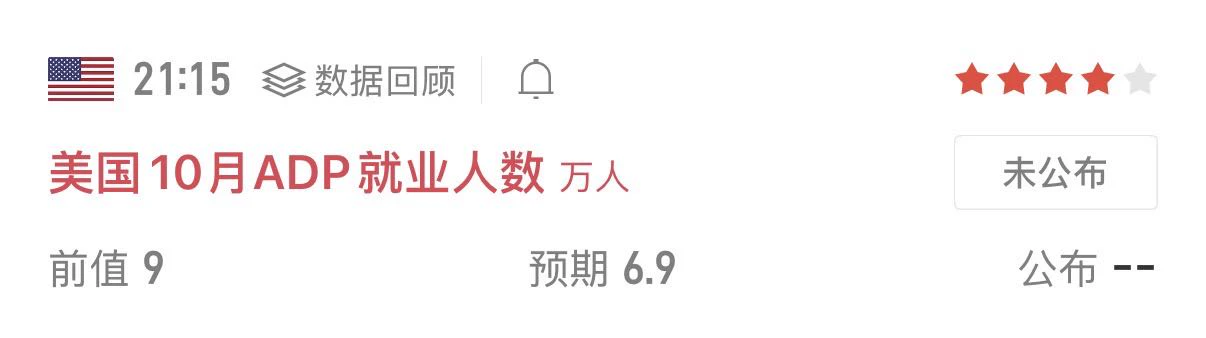
Tonight, pay close attention to the U.S. ADP employment data, a crucial leading indicator ahead of nonfarm payrolls. The previous reading was 90k, and the market expects it to fall to 69k, pointing to expectations of a weakening labor market.
Against the current market backdrop, with midterm election votes still being counted, volatility is already elevated. If the data comes in below expectations, it will reinforce signs of a slowdown, further weighing on Treasury yields and the U.S. dollar and supporting gold prices. If the data significantly exceeds expectations, however, it could reverse r
post-image
XAU+0.38%
Load More

Join 40 M users in our growing community

⚡️ Join 40 M users in the crypto craze discussion

💬 Engage with your favorite top creators

👍 See what interests you

Trending Topics

GateLaunchesTaiwanStockTrading

4.7k Views140 Discussing

Gate has launched Taiwan stock trading with 19 stocks available for direct $USDT trading, including TSMC (2330) and MediaTek (2454). From U.S. and Hong Kong stocks to Japan, Korea and now Taiwan, Gate is connecting users with more global traditional assets. Which Taiwan stock would you most want to access with $USDT — TSMC, MediaTek, or another AI supply-chain name?

DemocratsWinBothChambers

1.91k Views272 Discussing

ChipStocksRebound

6.85k Views2.94k Discussing

View More