Square
Following
Hot
News
Profile
Share your thoughts
placeholder
Article
Overnight trade: go long ETH at 2221 for gains, go long BTC at 76800-76300 for gains
🔹Intel Plunges Over 17 After Hours! Both Earnings and Guidance Disappoint. Is Another Wave of Selli
live-cover
LIVE2,119
Trenches
IDOL
I
bade
b
IDOL
0x3b...ab07
Market Cap
$.
Change
.
24h Vol
$.
Holders
.
ZIG
Z
bade
b
ZIG
0x8c...1145
Market Cap
$.
Change
.
24h Vol
$.
Holders
.
SAFU
S
bade
b
SAFU
0x7c...7777
Market Cap
$.
Change
.
24h Vol
$.
Holders
.
Q
Q
bade
b
Q
0xc0...0589
Market Cap
$.
Change
.
24h Vol
$.
Holders
.
STONK
S
bade
b
STONK
6GmA...UNgx
Market Cap
$.
Change
.
24h Vol
$
Holders
.
[NEWSTREAMER] market update
live-cover
LIVE1,308
  • 1
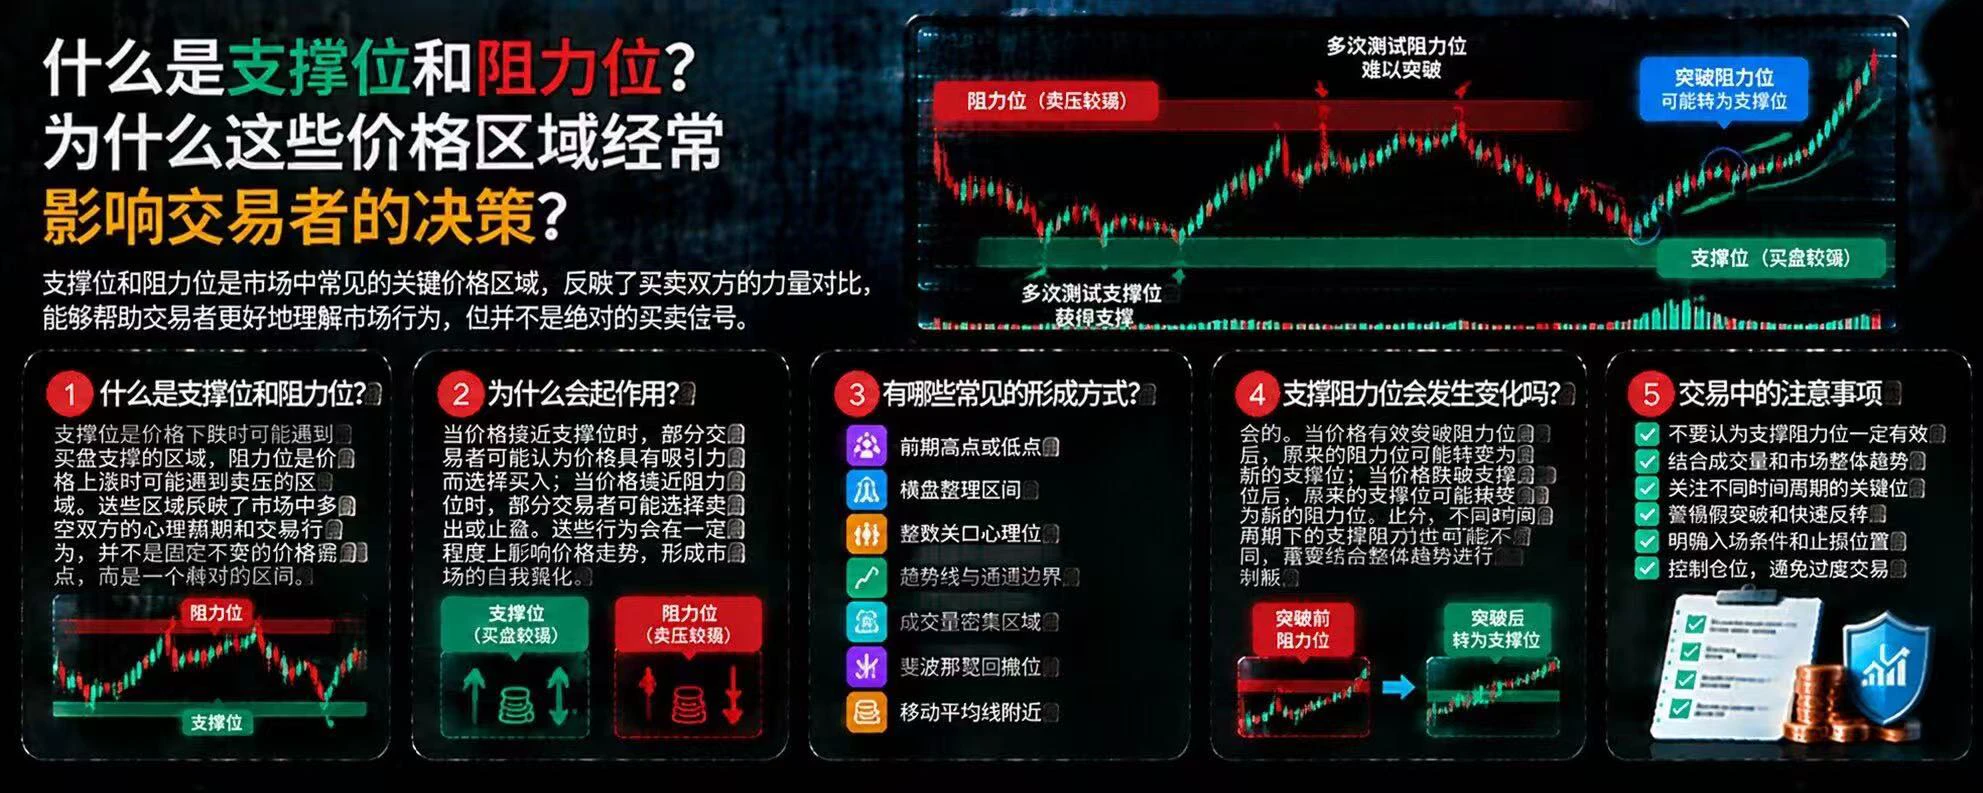
What Are Support and Resistance Levels? Why Do These Price Zones Often Influence Traders’ Decisions?
In crypto markets, prices do not fluctuate randomly. Certain zones repeatedly see buying or selling pressure, causing prices to temporarily stop falling or rising, or even reverse. These zones are commonly known as support and resistance levels, but they are not absolutely reliable price boundaries.
First, what is a support level?
A support level is a zone where strong buying may emerge as prices fall. When the price approaches this zone, some traders may consider it attractive and increase buy
post-image
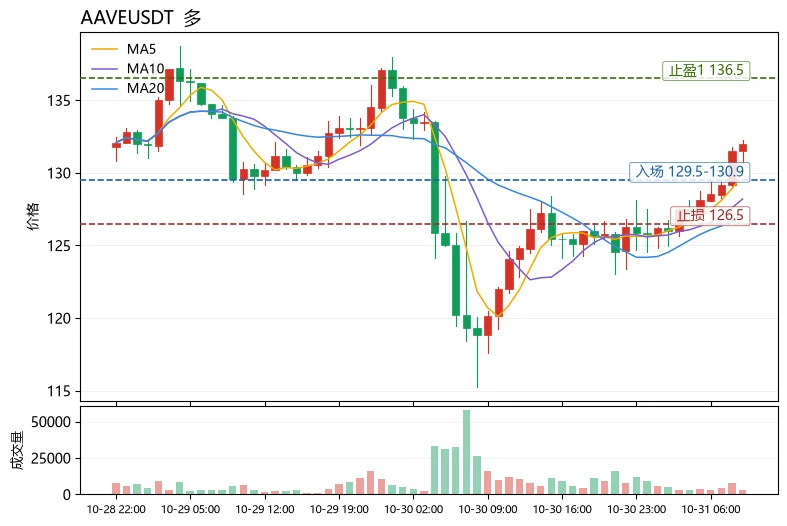
Does a moving average golden cross always mean you should chase longs? Not necessarily—the key is where the price is relative to the Bollinger upper band and whether the funding rate is aligned. Take $AAVE as an example: the current price of 132.02 is above the Bollinger upper band at 130.912, and MA5=129.864 is above MA20=126.969, indicating a healthy trend structure; however, RSI=67.5 is nearing overbought territory, and a short-term pullback is possible after the price broke above the upper band. Notably, the funding rate is -0.0084%, meaning shorts are paying, which indicates that longs a
post-image
AAVE-1.22%
ALPINE+0.16%
$IDOL It surged 68% in one day, climbing from 0.0137 to 0.0314 before crashing back to 0.0239, with 490 million in trading volume—this isn’t the kind of volume retail traders can generate. Clearly, funds swept up tokens around 0.014 and then drove the price up aggressively; it’s now in a high-level rotation phase.
First, the macro backdrop. There’s no major data today, but last week’s Fed minutes were hawkish, market expectations for a June rate cut fell from 70% to below 50%, and the US Dollar Index moved back above 105. With expectations of tighter liquidity, a broad rally in altcoins is unl
IDOL-6.71%
BTC-0.67%
  • 10
$PUNDIX It dropped again from the first resistance we marked. Detailed analysis at 0.11400
post-image
PUNDIX-1.51%
Guys, $BIRB $BIRB is facing strong selling pressure at the highs...‼️ I'm now opening a short (sell) position with leverage of no more than 20x, and setting the take-profit target at $0.075...‼️
post-image
BIRB-16.68%
Ledger, with more than 7 million customers, supports Kaspa's KAS on its hardware wallets through the KasVault app.
Holders keep their KAS keys offline and sign every transfer on the device.
@kaspaunchained
KAS+0.33%
  • 1
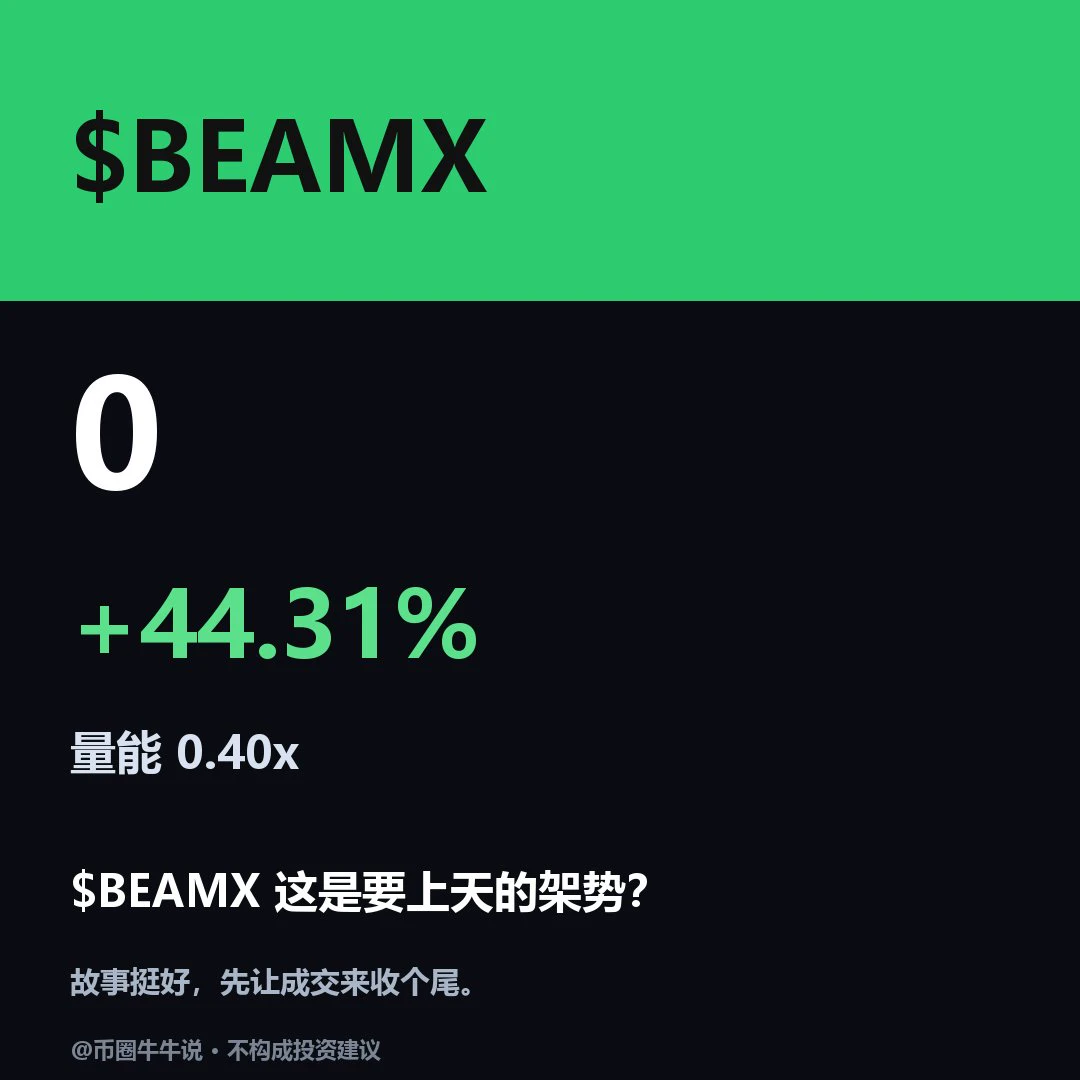
$BEAMX Currently at 0.004739, up 44.31% over 24H (range: 0.003224–0.0053). The 1H trend is strong, with an RSI of 50; the 4H trend is strong, with an RSI of 85. If it breaks above 0.0053 decisively, watch for further upside. If it falls below support at 0.003227, the short-term structure may weaken. Market volatility is high; for observation only.
post-image
BEAMX+5.82%
Just my everyday life.
Don't be too envious.
post-image
Gold is closing in on the 3,900 mark, plunging more than $110 intraday, while silver's losses widen to 5.4%! Another oil tanker attack has been reported in the Strait of Hormuz, sending oil prices higher and stoking inflation worries. Expectations of Fed rate hikes are weighing heavily on precious metals. Is this gold sell-off a panic-driven overreaction or a trend reversal? Friends, can your gold positions hold up tonight?
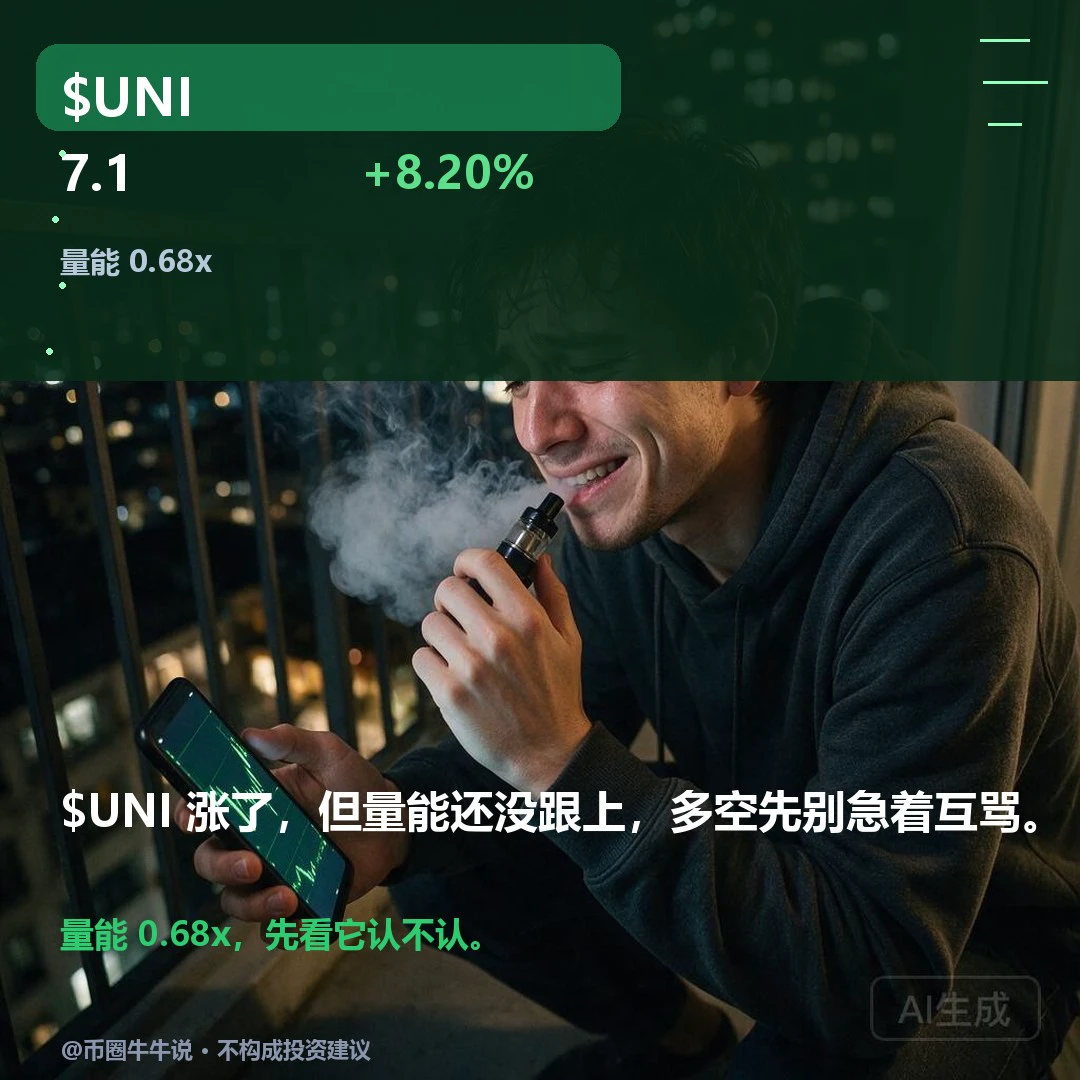
Wait for confirmation. $UNI is currently at 7.098, up more than eight percentage points on the day, but its hourly trading volume is less than 70% of normal, and the price is still hovering near the hourly resistance at 7.247. Can this strength be taken as a signal of continuation? The one-hour and four-hour trends are both strong, but the four-hour RSI is below 50, suggesting this sharp rally is more like a short-term push than a synchronized strengthening of the broader trend. Only if the price breaks above 7.247 on rising volume will this strength be worth taking seriously; if volume contin
post-image
UNI+3.05%
#IntelBeatsEarningsButStockPlunges
Intel's latest earnings report delivered an interesting contradiction: the company beat expectations, yet investors responded with a massive sell-off. This is what happens when the market starts looking beyond quarterly results and focuses on what management expects next.
Intel reported $16.5 billion in Q3 revenue, representing 21% year-over-year growth, while adjusted EPS came in at $0.52 against estimates of $0.40. Its Data Center and AI division also delivered impressive growth, generating $7.3 billion in revenue, up 78%. These figures demonstrate that de
INTC+0.05%
  • 4
  • 2
$INTC No matter what others do, our trading plan is to start buying Intel at 50 and get into the Korean stock index fund koru at 5. The market is a test of patience. In the current stock market, missing out is better than getting trapped. Don't get carried away with assets whose trends haven't played out yet. Take Google, for example: don't go all in at one price; buy in stages and make a trading plan. The market is driven by emotion. Once a stampede begins, more will follow until blood runs in the streets. Only then can the panic stabilize, and recovery comes last. That's because the market
post-image
INTC-28.49%
KORU-16.50%
🚨 #ETHPullsBack – Ethereum Faces Strong Selling Pressure!
Ethereum (ETH) is facing another challenging moment as its price moves lower amid growing uncertainty in the cryptocurrency market. The recent pullback has attracted the attention of traders and investors who are closely watching Ethereum's next move.
ETH has dropped below the important $2,300 price level and is trading near the $2,220–$2,250 area. This decline shows that sellers are currently putting strong pressure on the market.
There are several reasons behind this weakness. Bitcoin's recent decline, uncertainty across the crypto m
post-image
ETH-1.26%
BTC-0.67%
Algorand CEO William Herkelrath says every system banks rely on needs a post-quantum upgrade:
"Everybody's going to have to update."
A Google research paper cites Algorand as a real-world post-quantum deployment.
@Algorand
ALGO+0.50%
What a week we had 🔥
Load More

Join 40 M users in our growing community

⚡️ Join 40 M users in the crypto craze discussion

💬 Engage with your favorite top creators

👍 See what interests you

Trending Topics

BTC大跌

202.76k Views39.52k Discussing

$BTC briefly fell below $77,000 and remains under pressure around the $77K zone, with its 24-hour decline still above 4%. With risk appetite weakening and Fed uncertainty rising, where is the next key support after losing $80K?

IntelBeatsEarningsButStockPlunges

14.39k Views751 Discussing

StrategySTRCNears100ParValue

18.17k Views4.04k Discussing

View More