Square
Following
Hot
News
Profile
Share your thoughts
placeholder
Article
I’m having a hard time reading BTC and ETH.
Even though I wanted to short last night’s pump, I was a bit scared to.
BTC has now broken above the daily resistance at EMA21 and EMA25, showing signs of a rebound. I won’t touch it today; I’ll wait until it stabilizes tomorrow and then take another look.
Unfortunately, I missed this whole move up and down in BTC and ETH. At least gold returned today to the bullish level I mentioned the day before yesterday.
I’ve now gone long on gold and added to my silver position. Let’s see if I can make it out okay this time……
BTC-0.11%
GLDX+0.44%
PAXG-0.73%
XAG-2.14%
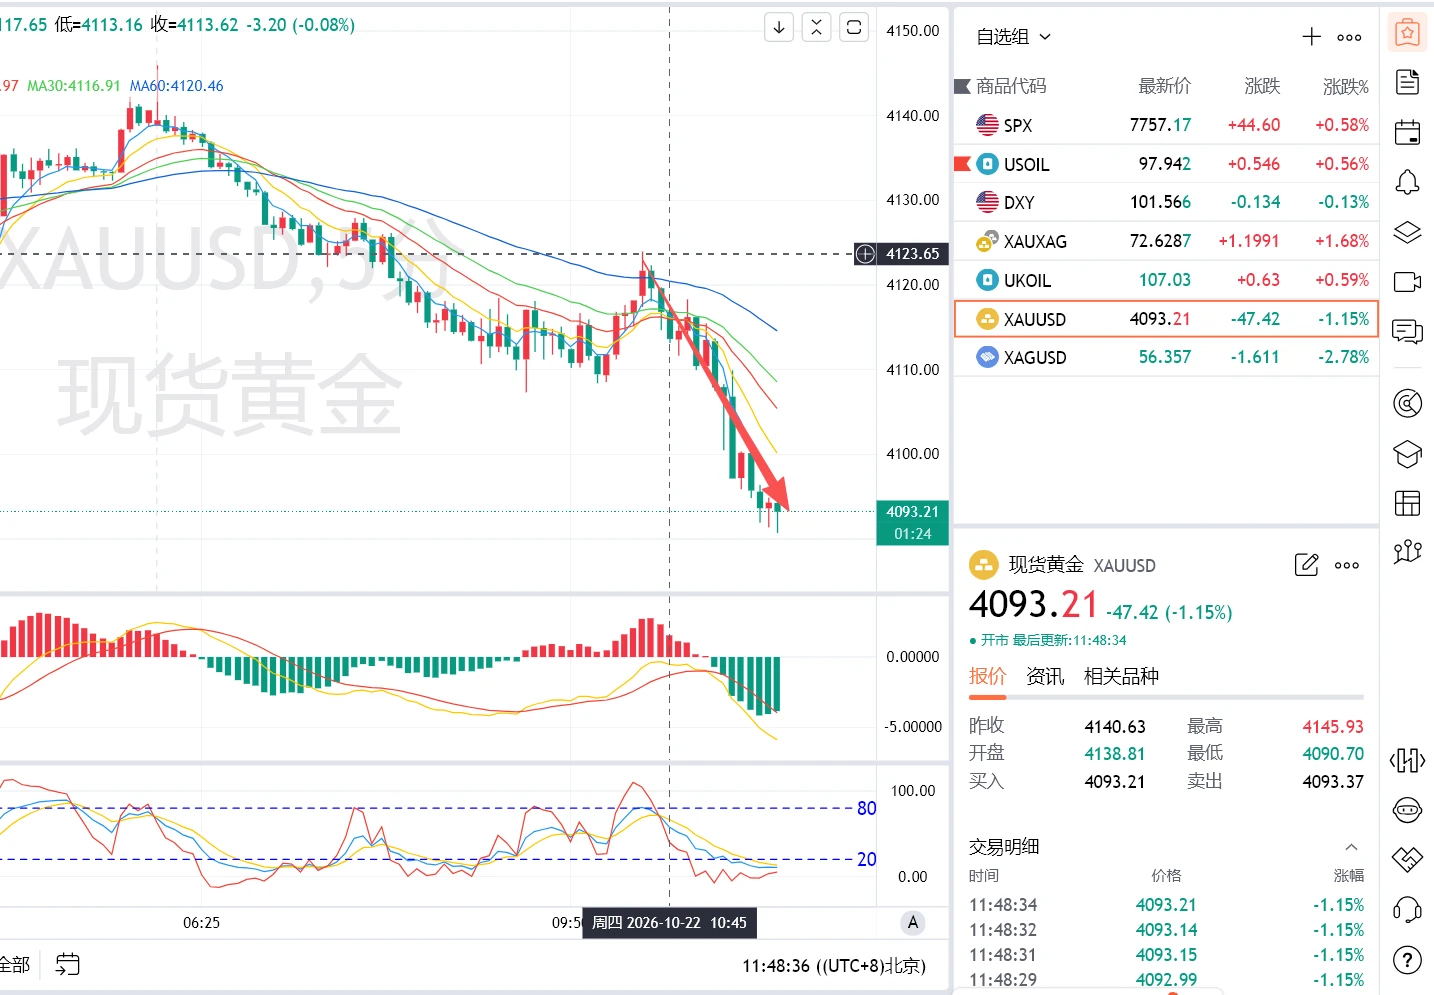
Gold fell from 4145 at the early-session open, then rebounded near 4110, peaking at $4123 before continuing lower in a bearish move. The early-session outlook played out perfectly—congratulations to everyone who followed along and made a profit!#黄金 #伦敦金 $XAUUSD ‌
post-image
ThisIsTranslateContent:DustyA
October 22 Gold Morning Analysis
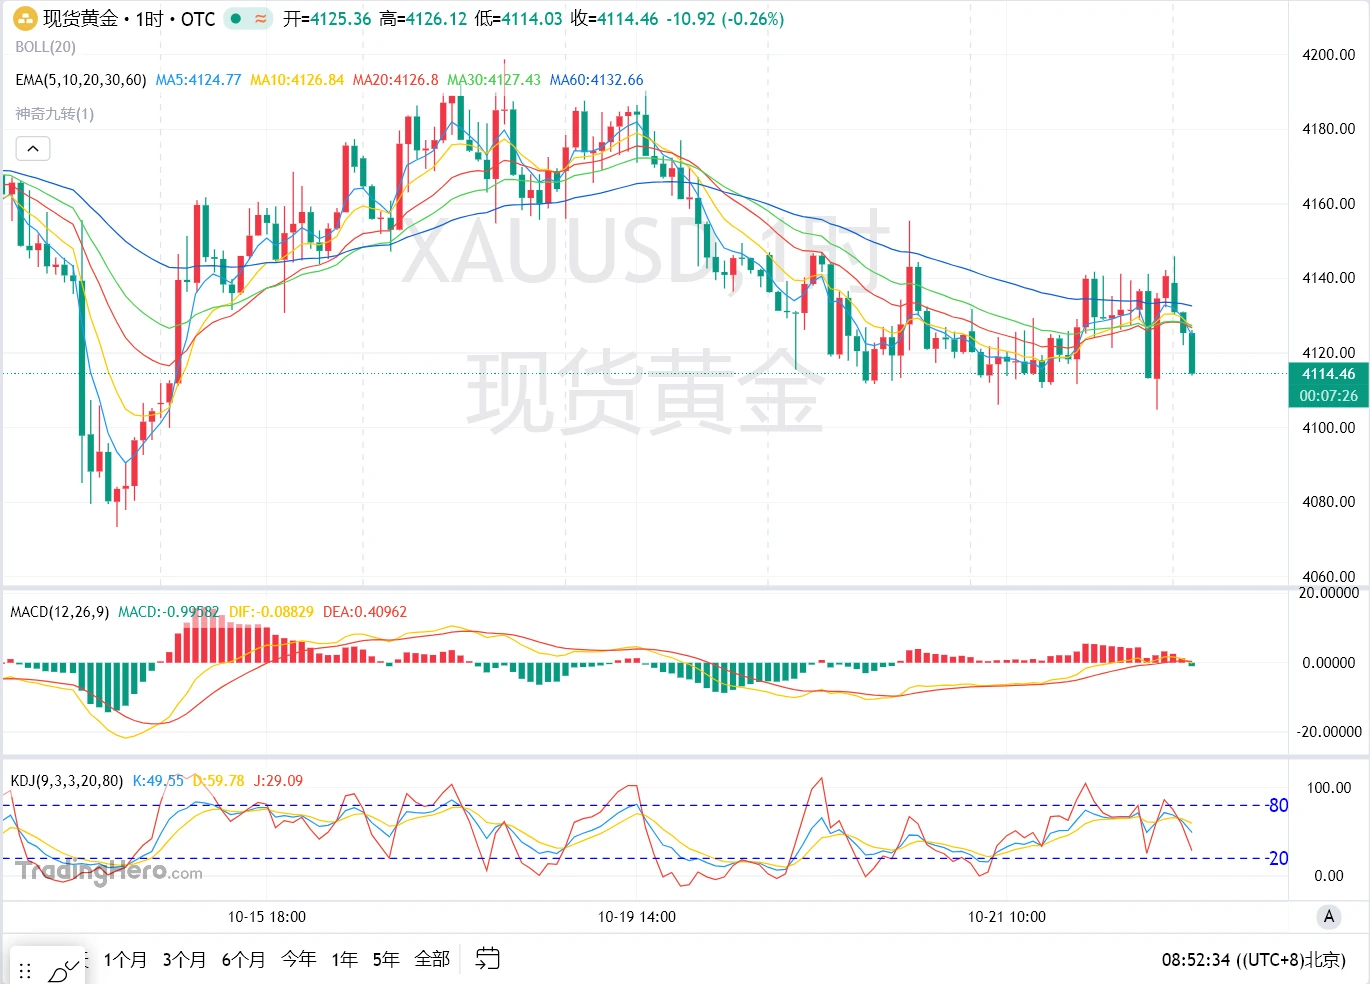
Last night, gold traded sideways within the 4140-4100 range, with limited overall volatility, and closed at $4140 near the end of the session. The daily chart formed a small bullish candle, but after briefly testing resistance at 4145 at today's open, gold fell back again. It is currently trading near $4114, and the rebound still lacks staying power!
Technically, although the daily chart closed with a small bullish candle, the bearish structure of the short-term moving averages remains unchanged. The MACD green bars show signs of contraction, but the fast and slow lines remain below the zero line. Rebound momentum is clearly weak, and the overall bearish trend has yet to reverse. The rebound should be viewed as a technical correction rather than a trend reversal.
On the short-term hourly chart, gold fell back again after meeting resistance around 4145. The short-term moving averages have turned downward again, the MACD fast and slow lines are showing signs of forming a death cross near the zero line, and the KDJ lines have turned down from high levels. Short-term rebound momentum has faded, and the price center of gravity has shifted lower again. The intraday outlook remains bearish.
For today's trading, watch the 4130-4135 range for short-term resistance. If gold rebounds to this area and the hourly chart forms a clear upper wick, a small short position may be considered, with a stop-loss above 4145 and downside targets in the 4110-4100 range. If gold breaks below the key 4100 level directly, follow the move with a short position, with a stop-loss above 4115 and a downside target near 4080.
The above content represents only my personal views and does not constitute investment advice. Investing involves risk; exercise caution when entering the market. Please manage your position size appropriately and make rational decisions based on your own risk tolerance. #黄金 #伦敦金 $XAUUSD ‌
repost-content-media
XAUUSD-1.33%
Trenches
Kimchi
K
bade
b
Kimchi
CSoc...pump
Market Cap
$.
Change
.
24h Vol
$.
Holders
.
CYBER
C
bade
b
CYBER
CMo7...pump
Market Cap
$.
Change
.
24h Vol
$.
Holders
.
PHP
P
bade
b
PHP
Cbkg...pump
Market Cap
$.
Change
.
24h Vol
$.
Holders
.
Dacity
D
bade
b
Dacity
nxPq...pump
Market Cap
$.
Change
.
24h Vol
$.
Holders
.
AGT
A
bade
b
AGT
0x5d...e274
Market Cap
$.
Change
.
24h Vol
$.
Holders
.
October 22: All subscription orders from last night and this morning’s positions were profitable. BTC hit its stop loss. After waking up this morning, I entered a short position on a live signal, and the ETH setup was successfully put in place. I’ll keep pushing to achieve even greater success and prove everything through results.
BTC-0.14%
ETH-0.36%
【10/22 | Gold, SanDisk Perpetuals, Nasdaq: Treat the Rebound as a Recovery for Now】
Gold is around 4108, under pressure again after a 4-hour rebound. Watch 4100 below; if it breaks, then watch 4080–4070. Above, watch 4120–4125 first, then 4139–4150.
SNDK USDT perpetuals are around 1344, having fallen back below the moving average cluster on the 1-hour chart. If 1340 breaks and the rebound is weak, watch 1330 and 1320. The 1366–1375 and 1373–1387 ranges are resistance that must be cleared for a recovery. Perpetual prices should not be confused with U.S. equity spot prices.
The Nasdaq CFD is aro
post-image
GLDX+0.44%
PAXG-0.73%
SNDK-5.07%
NAS100-0.78%
Frozen yoghurt in the tub🛀🤤💗
post-image
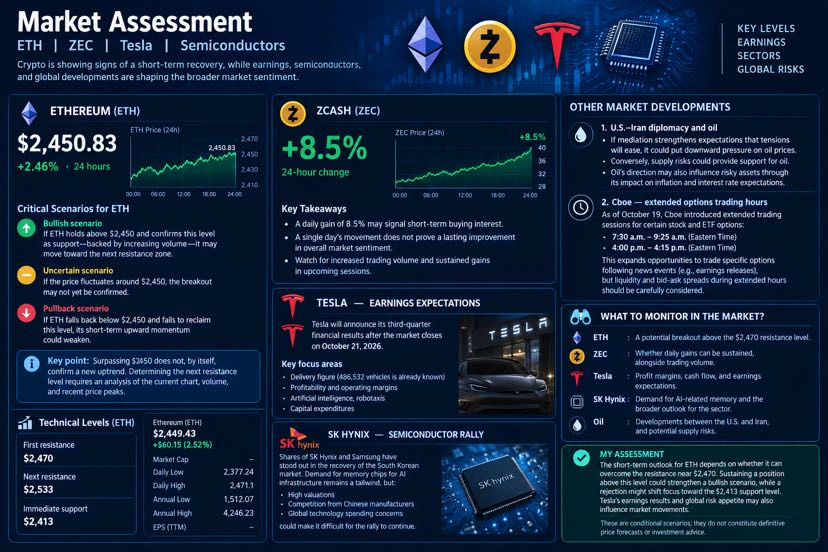
#EthereumReclaims$2450 #ShareWeekly
Market assessment: ETH, ZEC, Tesla, and semiconductors
There are signs of a short-term recovery in the crypto market. However, whether ETH can sustain its position above $2,450 depends not only on its daily percentage gain but also on trading volume, resistance levels, and overall risk appetite.
Ethereum (ETH)
$2,450.83
+2.46% · 24 hours
Zcash (ZEC)
+8.5%
24-hour change
Critical scenarios for ETH
* Bullish scenario: If ETH holds above $2,450 and confirms this level as support—backed by increasing volume—it may move toward the next resistance zone.
* Uncerta
post-image
ETH-0.32%
ZEC+1.36%
TSLA+3.40%
SK Hynix-6.33%
CBOE+1.24%
Trade Worry-Free: Get 100 USDT Loss Protection and Win Up to 800 SUI https://www.gate.com/campaigns/6621?ref=VLARBF1YAG&ref_type=132
post-image
SUI-2.31%
Musk explores merging SpaceX and Tesla! If the two giants join forces, what kind of business landsca
live-cover
LIVE2,315
#GateWCTCS9GlobalTradingCompetition
Gate WCTC S9: Prepare Your Strategy, Build Your Team, and Compete for Global Trading Glory
The countdown to Gate WCTC Season 9 has begun! 🏆
The global trading competition is approaching, bringing together traders who want to challenge themselves, improve their strategies, test their market knowledge, and compete for recognition in a highly competitive trading environment.
For every trader, a successful competition is about more than simply placing orders. It requires preparation, discipline, market awareness, effective risk management, and a clear understa
post-image
  • 1
  • 1
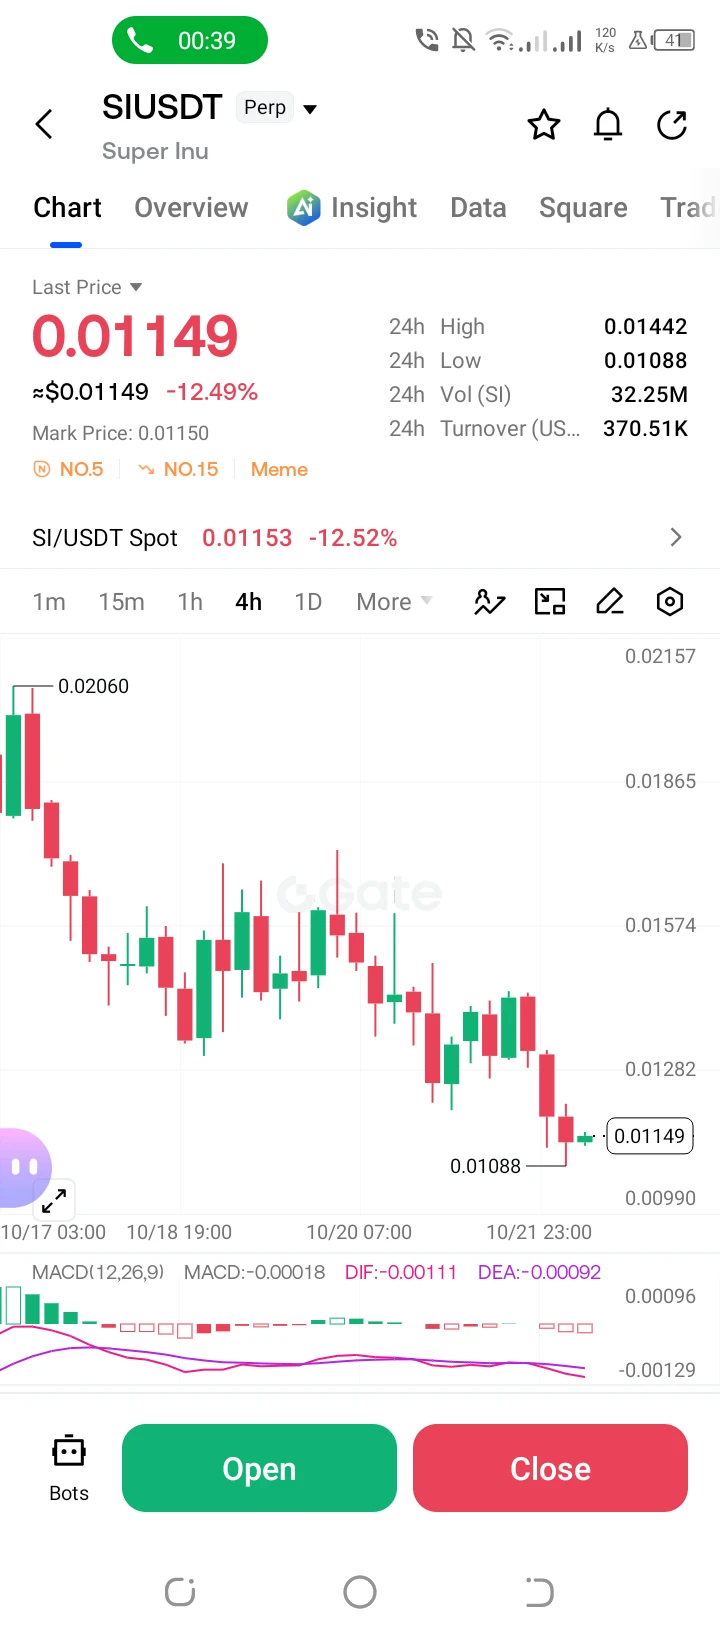
**$SI /USDT Perp – "Extended Downtrend – Short"**
Trading Plan Short $SI
Entry: 0.01200
SL: 0.01282
TP1: 0.01088
TP2: 0.00990
SI is down -12.49% and in a downtrend from the 0.01442 high. MACD is deeply negative; targeting the 0.01088 low.
post-image
SI-14.05%
I'm trading on Gate, a top-tier exchange with a 13-year track record. Come join me and dive into the hottest events right now! https://www.gate.com/campaigns/6469?ref=VLARBF1YAG&ref_type=132
Trade and Win: Every Draw Wins — iPhone DUO, ETH, SNDK & More! https://www.gate.com/campaigns/6576?ref=VLARBF1YAG&ref_type=132
post-image
ETH-0.32%
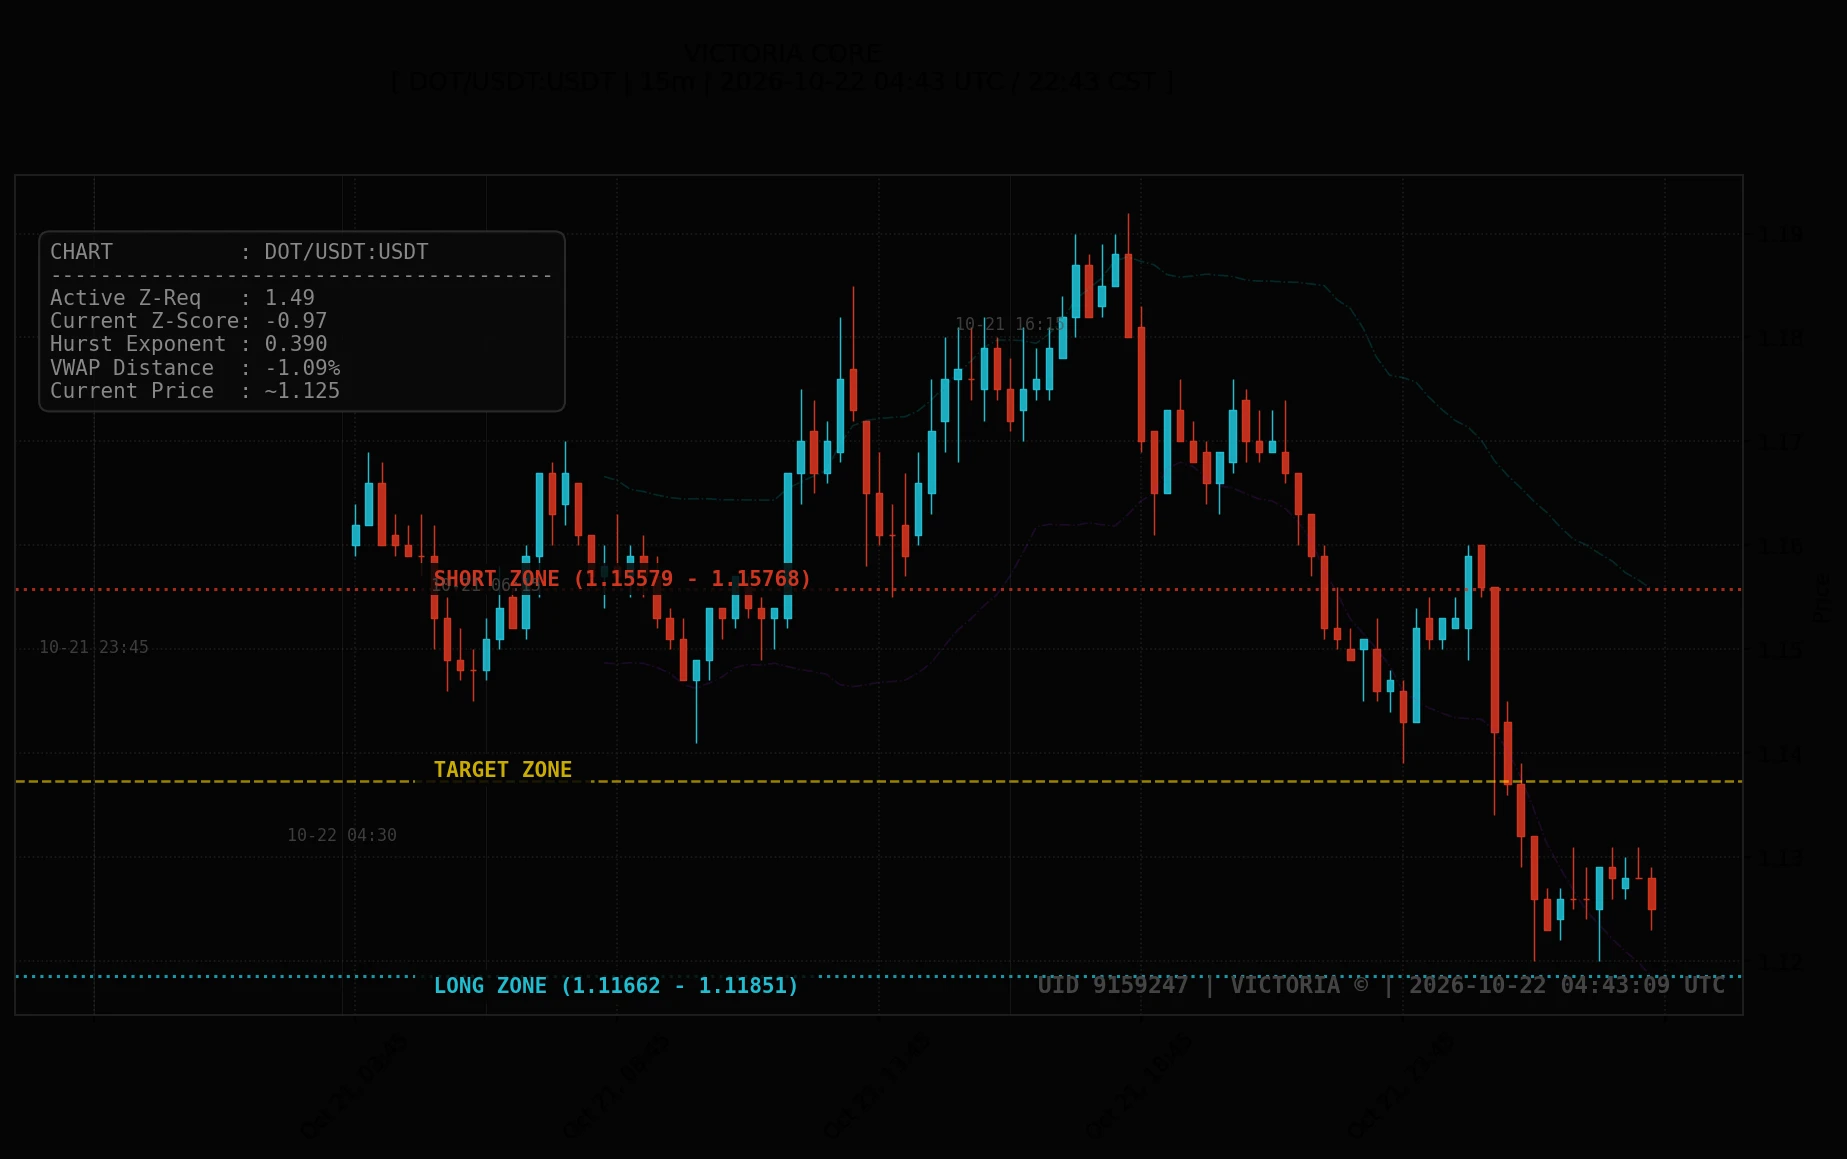
2026-10-22 04:43 UTC. DOT/USDT rejected off its top boundary near 1.1600 USDT and pulled back into the lower section of its channel, currently hovering beneath its mean equilibrium. Action remains bound between SHORT ZONE (1.15579 - 1.15768 USDT) and LONG ZONE (1.11662 - 1.11851 USDT), aiming toward TARGET ZONE (~1.13734 USDT).
TIA/USDT (SHORT: 0.608109 - 0.609603 USDT | LONG: 0.577037 - 0.578531 USDT | TARGET: ~0.591784 USDT).
ONDO/USDT (SHORT: 0.462255 - 0.463135 USDT | LONG: 0.443955 - 0.444835 USDT | TARGET: ~0.451654 USDT).
post-image
DOT-3.11%
TIA-5.82%
ONDO-1.41%
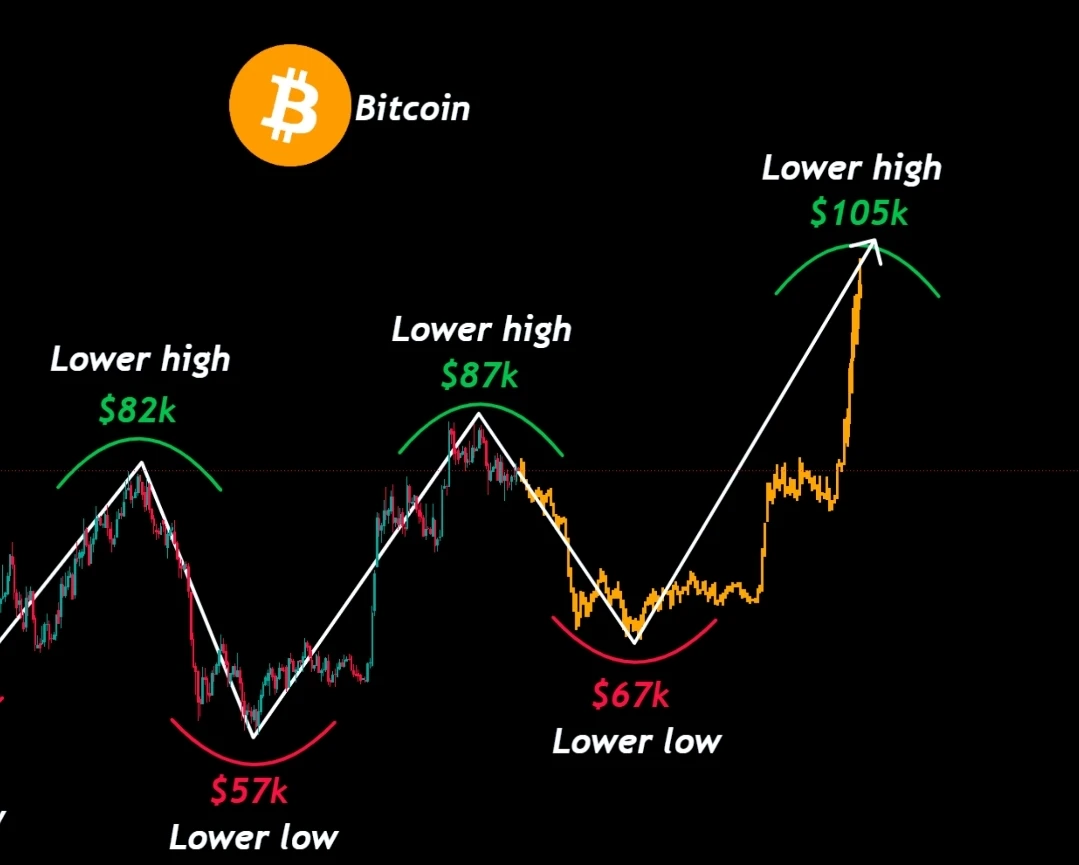
🚨 BITCOIN IS STUCK AT $80K–$83K FOR A REASON.
History is repeating, and $BTC is following the same pattern again.
Btc’s final shakeout comes before the next cycle kicks off.
Senerio 1:
$82K → $75K → $67K
Senerio 2:
$67K → $83K → $105K
Save this chart and come back to it later.
Follow me and turn on notifications. Don’t be late.
post-image
BTC-0.11%
TODAY, our subscriptions are at huge discounted prices.
Get SUBSCRIPTION , ENJOY OUR TRADING SIGNALS, INSIGHTS AND TECHNICAL ANALYSIS
post-image
Great, $ALT surged to 015, then pulled back. I followed for a bit and made some profit. Now I'm going long to see if the next wave will rise 😍😍😍$IRYS $ALT 😍😍😍
post-image
ALT+15.79%
IRYS+58.71%
  • 2
BTC update
live-cover
LIVE1,582
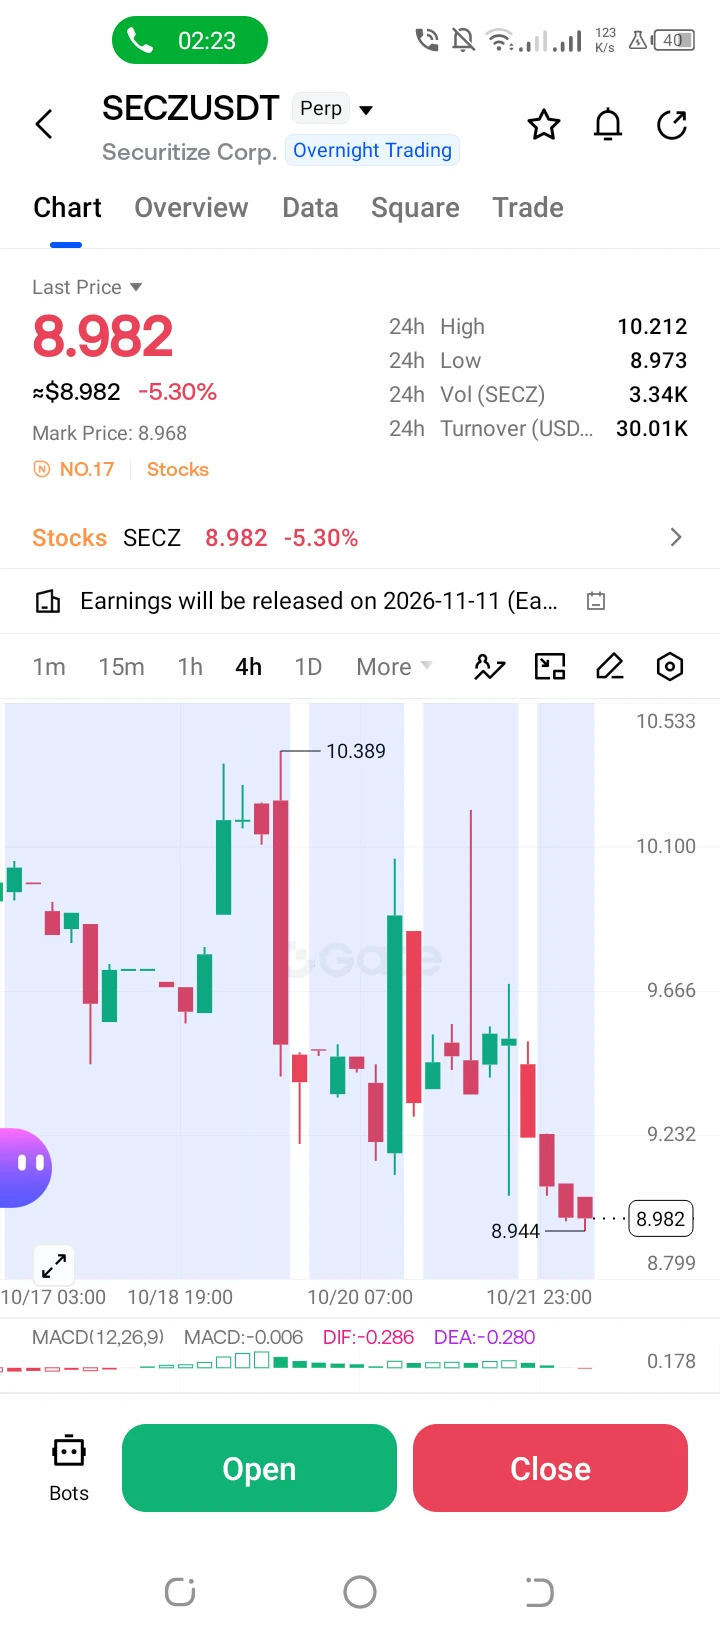
**$SECZ /USDT Perp – "Extended Downtrend – Short"**
Trading Plan Short $SECZ
Entry: 9.100
SL: 9.232
TP1: 8.944
TP2: 8.799
SECZ is down -5.30% and in a downtrend from the 10.212 high. MACD is negative; targeting the 8.944 low.
post-image
SECZ-5.29%
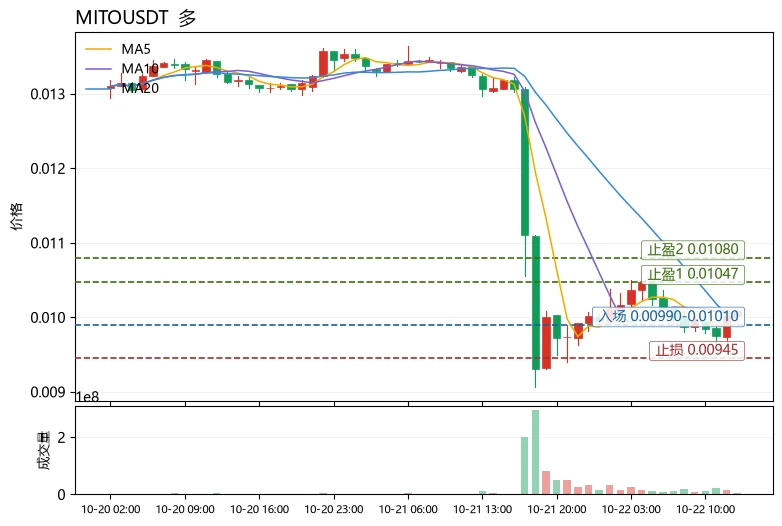
Many people rush to buy the dip after seeing a large bearish candle, mistaking “a big drop” for “the bottom.” The size of a decline is never support; the moving-average structure is. Take $MITO as an example: down 22.62% in 24 hours, with a current price of 0.01009, but MA5=0.009932 remains below MA20=0.0099835. The short-term moving average has not crossed above the medium-term one, so the trend has yet to recover; RSI=37.6 is in a relatively weak zone but not oversold, showing that some selling pressure has eased but has not been fully cleared. What is truly worth noting is that the MACD hi
post-image
MSTRB
MSTRBMSTRB
Four.meme
MC:$3.29KHolders:4
0.07%
MITO-22.99%
XRP+0.50%
Only buying the dip among the biggest losers is one of the easiest ways to lose money in this market. A steep drop does not mean an asset is oversold, and being oversold does not mean it will rebound. The key is to see which asset in the same sector is falling more “moderately.”
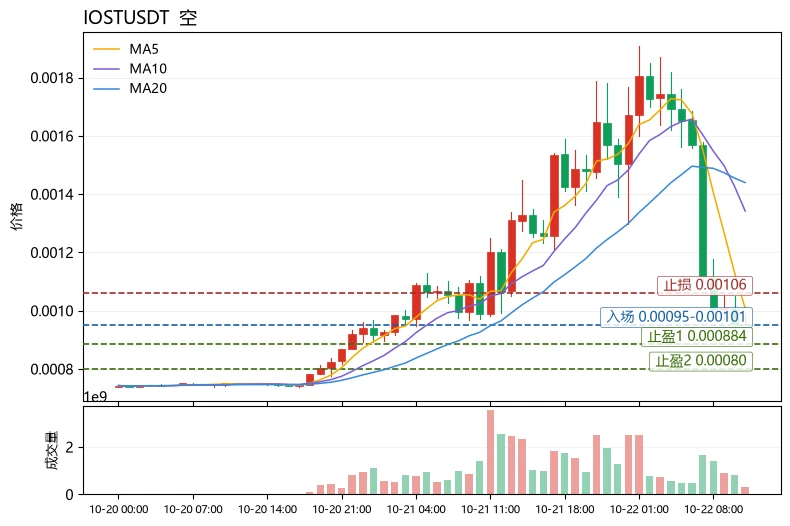
$IOST is down 19.12% over 24 hours, the worst of the three candidates, but its structure is precisely the most informative. At 0.000956, the price is not far above the lower Bollinger Band at 0.000884. MA5=0.0010082 is far below MA20=0.0014396, confirming a fully bearish moving-average alignment; RSI=35.4 has not yet
post-image
IOST-16.40%
ZRO-6.49%
Load More

Join 40 M users in our growing community

⚡️ Join 40 M users in the crypto craze discussion

💬 Engage with your favorite top creators

👍 See what interests you

Trending Topics

GateReserveRatioReaches118.49%

11.07k Views2.76k Discussing

Gate has released its latest reserve data, with total reserves rising to $8.688 billion and the overall reserve ratio reaching 118.49%. As the platform continues to expand, asset backing and transparency are also improving — can this further strengthen user confidence in platform security? [👉 Learn More](tps://www.gate.com/announcements/article/102351)

MetaEarningsBeatExpectations

869 Views440 Discussing

USAIAndCryptoStocksRise

6.25k Views8.24k Discussing

View More