Square
Following
Hot
News
Profile
Share your thoughts
placeholder
Article
A Massive Overnight Surge! The Truth Behind the Crypto Market’s Collective Takeoff Can No Longer Be Hidden
There are no inexplicable surges in crypto—only three forces igniting at the same time.
Last night, $BTC , $ETH , ZEC, and $SOL all rallied. It wasn’t driven by a single piece of news. On the macro front, the SEC paved the way for on-chain trading of tokenized stocks, concerns about rate hikes eased, shorts were forced to cover, and risk appetite recovered.
BTC set the tone with regulatory tailwinds, bullish institutional sentiment, and the “digital gold” narrative; ETH is seeing a valua
BTC+0.77%
ETH+0.20%
SOL+1.02%
Include an image: 1987.10.19 Dow Jones down 22.6% in one day.
Today marks the 39th anniversary. Before the market opens, watch oil prices and yields, not the calendar. Not investment advice.
post-image
Trenches
TSI
T
bade
b
TSI
0xa8...1c1e
Market Cap
$.
Change
.
24h Vol
$.
Holders
.
CNPY
C
bade
b
CNPY
0xc6...ddd2
Market Cap
$.
Change
.
24h Vol
$.
Holders
.
AGT
A
bade
b
AGT
0x5d...e274
Market Cap
$.
Change
.
24h Vol
$.
Holders
.
BOOMER
B
bade
b
BOOMER
0x5a...5c00
Market Cap
$.
Change
.
24h Vol
$.
Holders
.
PIERRE
P
bade
b
PIERRE
D3S6...pump
Market Cap
$.
Change
.
24h Vol
$.
Holders
.
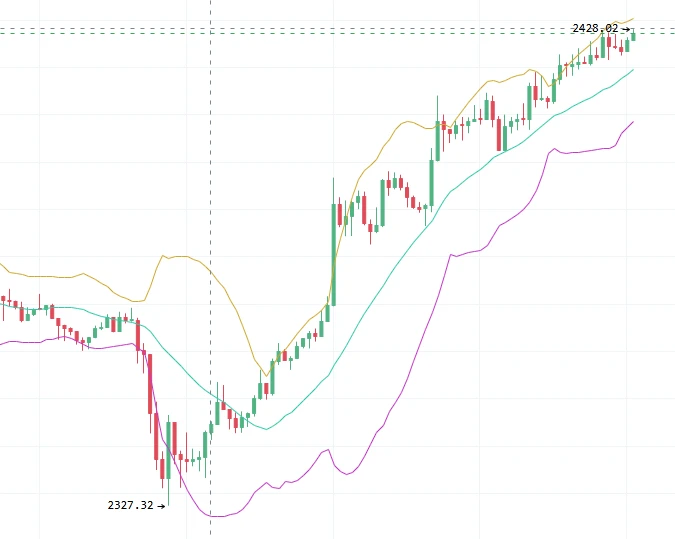
10.19 ETH trading plan$ETH
Entry range: 2430‑2440 short
Stop-loss: above 2470
Take-profit targets: 2400~2350
#Gate两大币种合约成交额跻全球前三
Summary: The market is currently trading in the middle-to-upper region of the Bollinger Bands. The upper band is creating short-term resistance, while the middle band provides important support. Volume has remained active during this rally, and the bulls' momentum remains relatively strong. However, volatility has started to increase as price approaches the upper resistance zone, raising the risk of chasing highs.
The broader short-term uptrend remains intact, and
post-image
ETH+0.20%
Some things may seem complicated, but they’re actually very simple: in product competition, lowering costs is what makes you competitive.
post-image
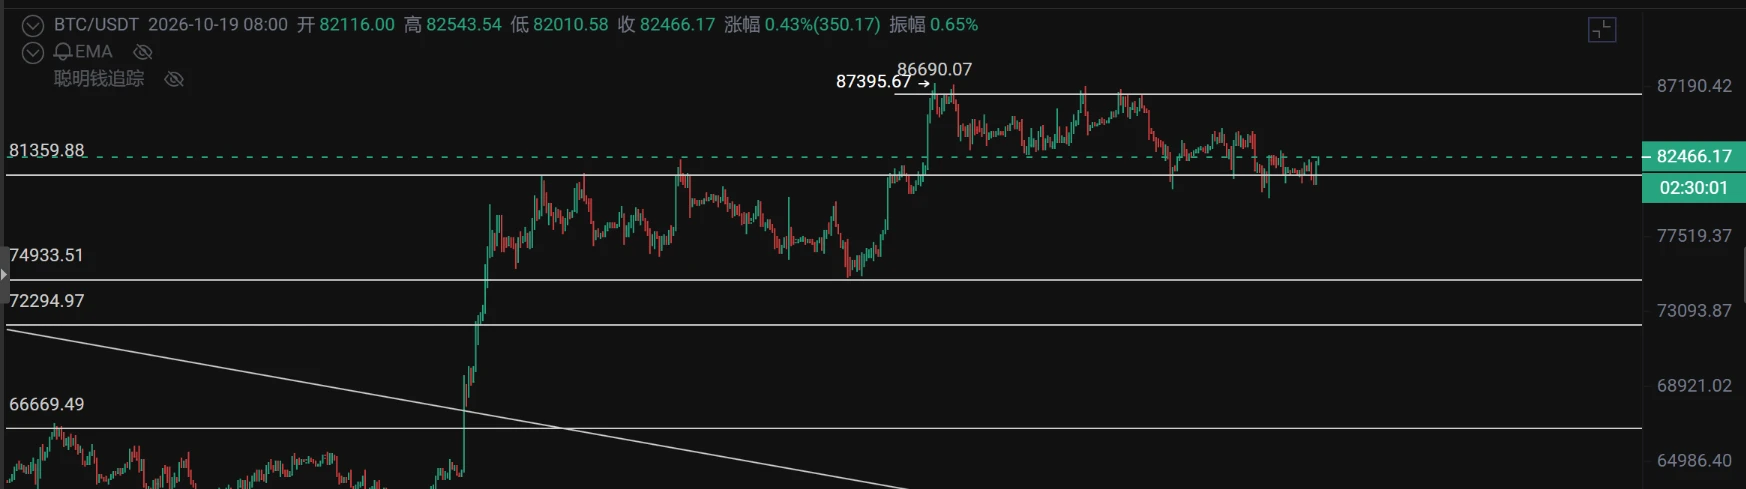
Yesterday, Bitcoin first dipped to a low of 80622, then staged a recovery bounce, climbing all the way to around 82581.
This rebound is only a technical recovery within the broader downtrend; the bearish trend on the daily timeframe has not reversed. On the 4-hour chart, the price rebounded to the upper Bollinger Band. The 1-hour chart has posted consecutive bullish candles, and the KDJ has entered the overbought zone. Short-term rebound momentum has been fully exhausted, while overhead selling pressure remains. The overall trading strategy remains unchanged: favor short positions on rebounds.
post-image
BTC+0.77%
[New Streamer] Whales Moves in Sync!
live-cover
LIVE2,303
live market update
live-cover
LIVE2,056
Someone created a new wallet 10 hours ago and opened a 25x short on 13,826 $ETH ($33.5M).
As the price rebounded, the wallet was partially liquidated.
It still holds a short on 8,849 $ETH ($21.4M), with a new liquidation price of $2,430.28.
ETH+0.20%
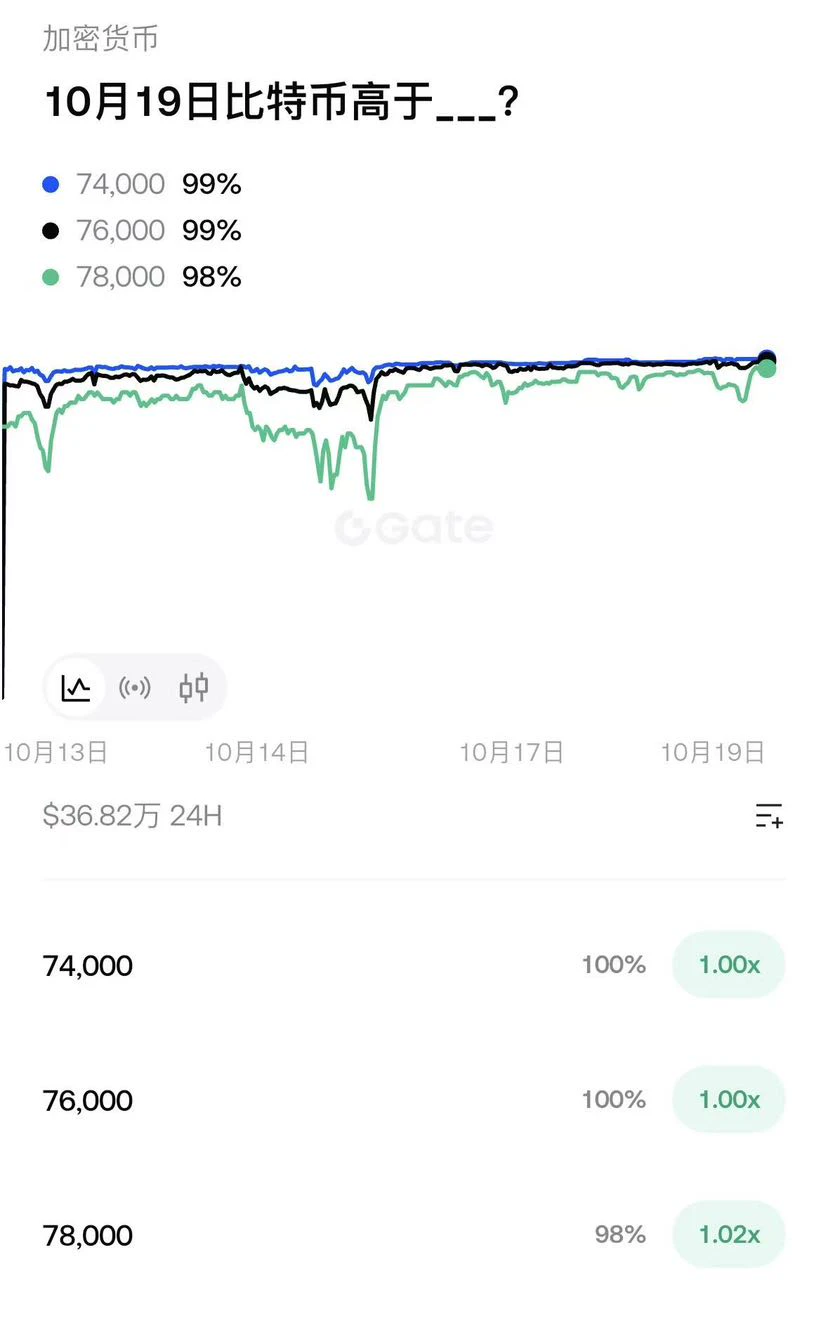
Market consensus is extremely strong: On October 19, BTC is expected to hold firmly above 76000; the probability of the 78000 level is as high as 98%, with the market seeing very little chance of dropping below 78000.
This is a short-term expiry market, on a different time horizon from the previous monthly October targets (80000/85000): expectations are strong that 78000 will hold in the short term, but whether BTC can continue climbing to 85000 this month remains heavily contested.
post-image
BTC+0.77%
Stablecoin supply has barely grown, but payment volume is up 45% year over year.
According to data from Allium, stablecoin payment volume reached $482 billion in the first nine months of 2026, with more than 1 billion transactions, up 71% year over year. Stablecoin card spending reached $3.9 billion, 10 times the level of the same period last year.
Mastercard, Stripe, and Visa have successively integrated stablecoin payments, signaling that the industry is moving from crypto trading toward real-world consumption and commercial settlement.
However, stablecoin card spending currently accounts fo
post-image
V+0.70%
Morning, everyone!
Monday trading starts!
It felt a little chilly on the way to work today
and quite refreshing too
Today is the first day of trading for global financial markets
Hope the market doesn't cool off😂
What do you all think of today's market?
post-image
If a family member insists on doing something you don’t understand, would you try to talk them out of it or go with them once?
post-image
October 19 $BTC Comprehensive Market Analysis
✊News:
Overall, news was relatively quiet over the weekend, with prices mainly influenced by technical recovery and low liquidity
The macro pressure from CPI/PPI coming in above expectations remains, and the market is watching the upcoming Fed meeting (October 27–28). Risk appetite has yet to fully recover, and some altcoins are underperforming BTC
✊Flows:
U.S. spot Bitcoin ETFs remain weak. On October 16, they saw net outflows of about $82.4M (mainly from IBIT), with net outflows of about $228.6M this week (approximately October 12–16). Cumulativ
post-image
BTC+0.79%
🚀 COMPETITION ALERT
💥EVENT LAUNCH: Gate WCTC S9 Global Trading Competition Officially Live
⚡ Executive Summary
The World Crypto Trading Competition Season 9 (WCTC S9) is officially live on Gate. Crossing traditional asset boundaries, WCTC S9 connects crypto, global stocks, and CFDs into a massive multi-asset showdown featuring an 8,000,000 USDT total prize pool.
📊 1. Core Event Highlights
• Massive 8M USDT Prize Pool: Compete across multi-asset tracks, including Spot, Futures, Stocks, ETFs, and CFDs.
• Lucky Launchpad: Integrated reward pool guaranteeing a win every time you draw.
• Event
post-image
mcto
8M USDT. One Board. No Boundaries. 🏁
WCTC S9 is live. Crypto, stocks, and CFDs on the same leaderboard. The pool is 8M USDT. Trade it. Climb it. Take it.
The easy wins
• Lucky Launchpad — free spin. Guaranteed win every time.
• New users — 20 USDT futures voucher on registration.
• Event Contract PK — up to 400,000 USDT.
• Form a team. Hit the volume. Unlock more.
Registration is open. Don’t watch from the side.
‍#GateWCTCS9 #WCTC $GT #GateWCTCS9GlobalTradingCompetition
repost-content-media
BTC+0.79%
USDT+0.00%
GM,
The pullback from the highs in this round of U.S. stocks is pretty much over.
$MU $SKHY and a bunch of other memory stocks have fallen nearly 40% at their worst.
Back during the AI bull market, everyone said they’d buy the dip once SK broke 1,000. Why is nobody daring to now?
But then again, might as well stick with the U.S. market’s golden child, $MU . Feels like the Korean retail investors are about to get completely wiped out.
post-image
MU-5.66%
SKHY-6.62%
SK-3.83%
#BTC跌破8.2万 #ShareWeekly #BitcoinTops$82K
BITCOIN AT $81,621.6: CPI SHOCK, CRITICAL SUPPORT, AND THE ROAD AHEAD
Bitcoin is navigating a critical phase after slipping below the $82,000 level. With BTC currently trading at $81,621.6, the market is balancing renewed inflation concerns, changing Federal Reserve expectations, and uncertainty surrounding leveraged positions. The key question is whether buyers can stabilize the market or whether Bitcoin will face another test near $80,000.
1. Current BTC Market Snapshot
- Current price: $81,621.6
- 24-hour high: $81,880.7
- 24-hour low: $81,196.4
- 2
post-image
Falcon_Official
#BTC跌破8.2万 Bitcoin at $81,570: Has the CPI Shock Been Priced In, or Is $80,000 the Next Test?
Bitcoin’s move below $82,000 has shifted the market’s focus from the possibility of a $90,000 rally to the strength of the current support structure. Trading near $81,570, BTC is facing a combination of renewed US inflation pressure, changing Federal Reserve expectations, and uncertainty over leveraged positioning. The critical distinction is whether the market has already absorbed the inflation shock or whether another round of selling could follow.
September CPI Changed the Macro Picture
The US Bureau of Labor Statistics reported that headline CPI increased 3.7% year over year in September, accelerating from 3.4% in August. Monthly inflation reached 0.6%, compared with 0.4% previously. Core CPI, excluding food and energy, rose 2.6% annually and 0.3% monthly.
Energy was a major contributor. Gasoline prices climbed 9.1% in September, accounting for more than half of the monthly increase in headline CPI. The energy index advanced 5.2% during the month, while shelter costs increased 0.4%.
These figures complicate the outlook for monetary easing. Persistent inflation can keep interest rates restrictive for longer, potentially supporting the dollar and Treasury yields while reducing investors’ appetite for risk-sensitive assets.
However, the inflation report does not automatically guarantee another rate hike. The Fed must evaluate incoming economic data, employment conditions, and the persistence of price pressures before determining its next move.
Why BTC Fell Below $82,000
Bitcoin’s decline reflects the sensitivity of crypto valuations to macroeconomic expectations. When inflation exceeds forecasts, markets may reassess the timing of rate cuts or the possibility of further tightening. Higher expected borrowing costs can make speculative positions less attractive, particularly when leverage is elevated.
Market reporting following the CPI release showed Bitcoin falling to approximately $80,247 before trading around $80,743 in the subsequent session. BTC has since approached the $81,570 level referenced here, but a recovery from the lows alone does not confirm a trend reversal.
The key question is whether buyers are returning through sustained spot demand or whether the rebound is primarily driven by short covering. These two scenarios can produce similar price action initially but have different implications for durability.
The $81,000–$80,000 Support Test
At approximately $81,570, Bitcoin is close to an important psychological area. The $81,000 region deserves attention as a near-term reference, while $80,000 is the next major round-number level traders may monitor if selling pressure resumes.
A sustained recovery above $82,000, supported by stronger spot volume and improving market breadth, would help repair the short-term structure. If BTC repeatedly fails to reclaim that level, sellers may retain control and the market could revisit lower support.
A break below $80,000 would increase downside risk, but it would not automatically establish a prolonged bearish trend. Confirmation would require examining subsequent price acceptance, trading volume, and whether buyers defend the breakdown area.
These levels are technical reference points, not guaranteed turning points.
Liquidations and Leverage: The Hidden Risk
During sharp declines, leveraged long positions can face liquidation as collateral becomes insufficient. Forced selling can amplify downward momentum, creating a feedback loop in which falling prices trigger further position closures.
Open interest helps distinguish between different forms of selling pressure. If BTC declines while open interest contracts sharply, traders may be closing positions or being liquidated. If open interest rises during the decline, new positions may be entering the market, although the direction of those positions cannot be established from open interest alone.
Funding rates provide additional context. Persistently positive funding during weakening price action may indicate that long exposure remains crowded. A reduction in funding and leverage could help stabilize market conditions, but it would not independently confirm a bottom.
Is the CPI Shock Already Priced In?
Markets often react to the difference between expectations and actual data, not simply to whether a headline looks positive or negative. Some of the inflation risk may already be reflected in Bitcoin’s decline, but that cannot be established from price alone.
If Treasury yields stabilize, the dollar loses momentum, and BTC reclaims $82,000 with credible spot demand, the market could begin recovering from the initial shock. If inflation concerns intensify and leveraged positions continue unwinding, $80,000 may come into focus instead.
The most important signal is confirmation across macroeconomic conditions, spot activity, and derivatives positioning.
At $81,570, Bitcoin is at a decision point rather than a confirmed bottom. Preserving capital, controlling leverage, and waiting for price confirmation are more defensible approaches than assuming either an immediate rebound or an inevitable breakdown.
repost-content-media
BTC+0.79%
  • 1
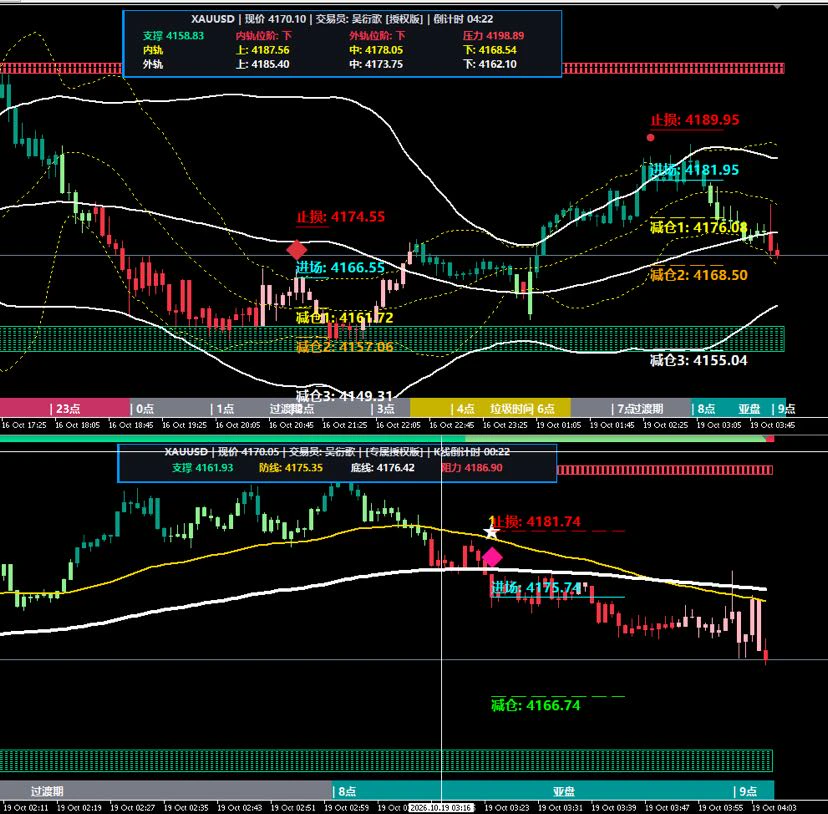
One signal from each this morning: an 81.95 short and a 75.74 short. The first is the new quant running for 5 minutes; the one below is the old one. I’ll test it live for a week before launching.#美国9月PPI大超预期
post-image
Load More

Join 40 M users in our growing community

⚡️ Join 40 M users in the crypto craze discussion

💬 Engage with your favorite top creators

👍 See what interests you

Trending Topics

USSeptemberPPIBeatsExpectations

91.35k Views1.94k Discussing

US September PPI came in at 6.3% YoY, well above the 5.3% market expectation, pointing to renewed producer-side inflation pressure. Weekly jobless claims were 199K, broadly in line with forecasts. Could hotter inflation further reduce room for rate cuts, and what does it mean for $BTC, US stocks, and gold?

GateWCTCS9GlobalTradingCompetition

37.87k Views6.86k Discussing

GateBTCAndETHFuturesVolumeRanksTop3

53.8k Views1.98k Discussing

View More