

Square
Following
Hot
News
Profile
Share your thoughts
placeholder
Article
Staying up a little longer to watch the market is fine.
Right now, I just want to turn my life around and never go back to the way I used to live.
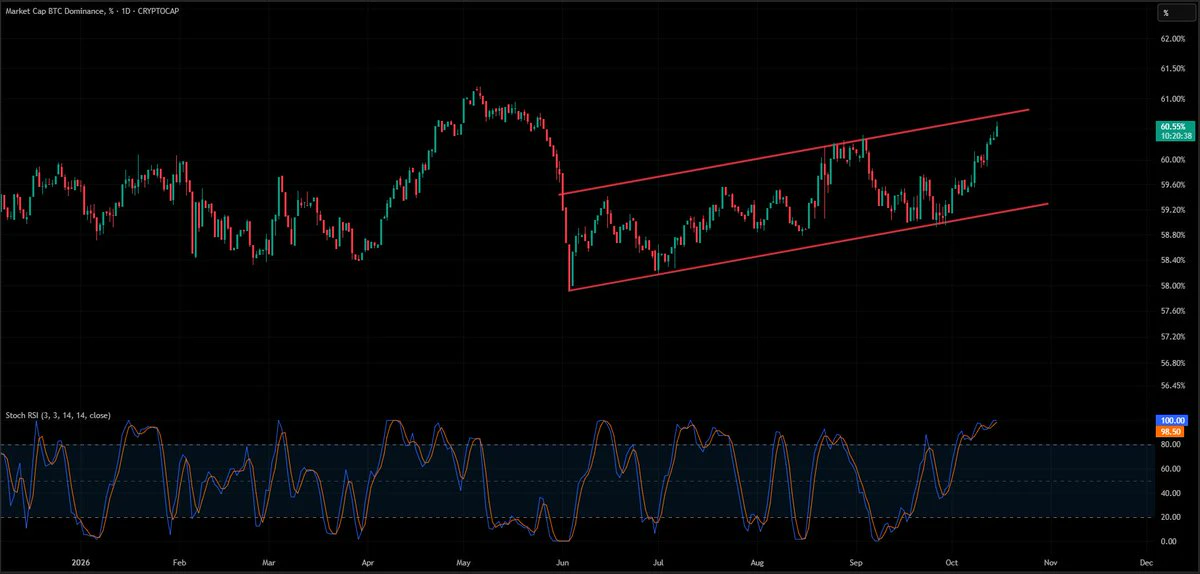
$BTC dominance is testing the upper boundary of its rising channel, with Stoch RSI heavily overbought.
A rejection from 60.7–60.8% could give altcoins some breathing room. A breakout above 61% would likely mean more pressure on altcoins.
post-image
BTC+0.26%
#On-chain metrics analysis
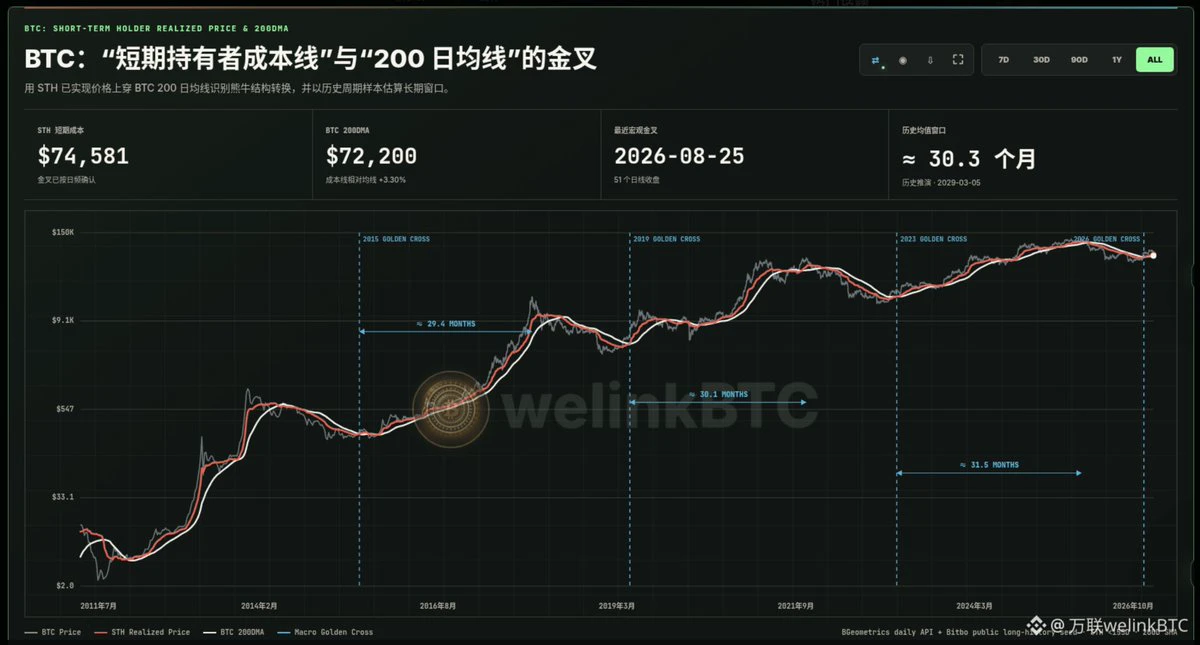
BTC: Golden cross between the "short-term holder cost line" and the "200-day moving average"
When the STH cost line crosses above the 200-day moving average, it indicates that the short-term market cost has been repaired and is once again outperforming the medium- and long-term trends. This is a macroeconomic structural signal, not a short-term buy or sell order.
The macro golden cross has been confirmed.
The cost of STH is approximately $74,581, while that of 200DMA is approximately $72,200, representing a relative difference of approximately +3.30%.
The most recent
post-image
BTC+0.26%
🚀🔥 GATE.IO ⚡ HOT TRADER LIVE | BTC AT A CRITICAL LEVEL! ₿📊 | BIG MOVE AHEAD? 🐂🐻
live-cover
LIVE1,657
Wow!
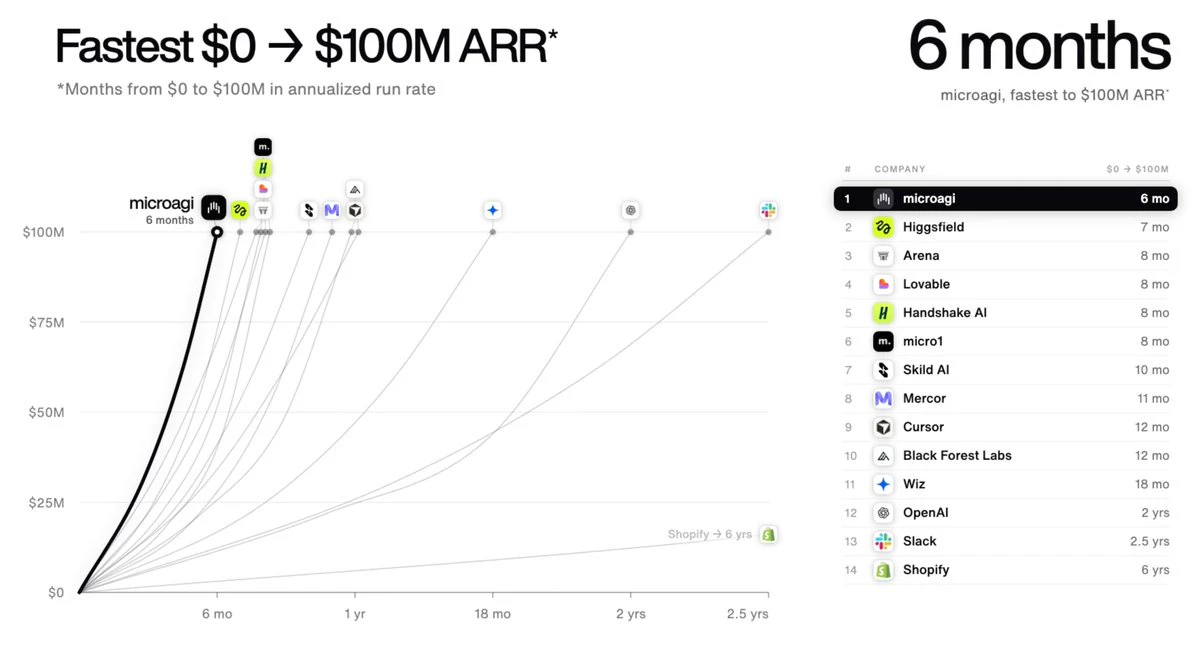
Higgsfield AI is no longer the fastest-growing startup in the world.
Microagi, a robotics data research startup, just hit $100M ARR in 6 months.
The AI race is shifting from who builds the best models to who owns the most valuable data.
Data is the real moat now.
post-image
#美国9月PPI大超预期
US September PPI Surges Above Expectations: What Does It Mean for Markets?
Producer Inflation Returns to the Spotlight
The latest US September Producer Price Index (PPI) report has attracted significant attention across financial markets, with producer inflation rising much more sharply than expected. The reported figures indicate renewed inflationary pressure and raise fresh questions about the Federal Reserve’s monetary policy outlook.
According to the reported data, US September PPI increased 6.3% year over year and 1.3% month over month, exceeding market expectations. These
post-image
BTC+0.26%
ETH-0.03%
XAU+1.63%
  • 4
😁Entering BTC early doesn't matter
If the calculation is right, the pump is tonight
SAND also showed bullish divergence on both the 4-hour and 1-hour charts, and I posted them all today, guys! SAND has pumped too!$BTC $ETH #美国9月PPI大超预期
FyPaymentMadeEasy
10.15
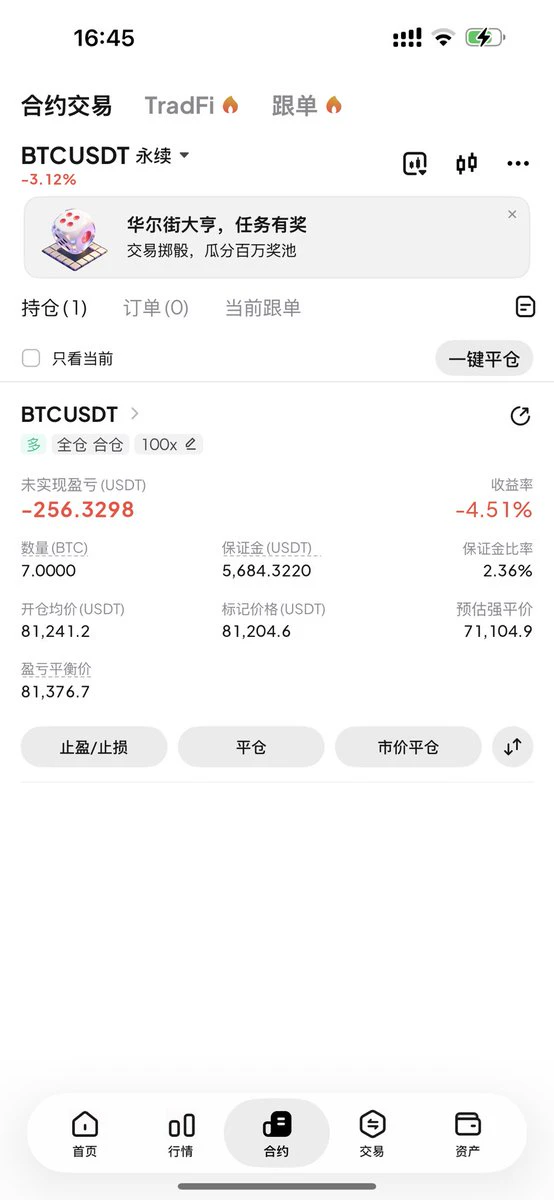
The BTC short opened at 83590 has been fully closed.
Preparing to gradually buy the dip and go long.
There have indeed been quite a lot of negative factors during this period.
The lowest level should be around 78000. Add to the position there, and it should rebound. Keep pushing!
repost-content-media
BTC+0.25%
ETH-0.43%
One arrow pierces the clouds, and countless troops and horses come to meet
post-image
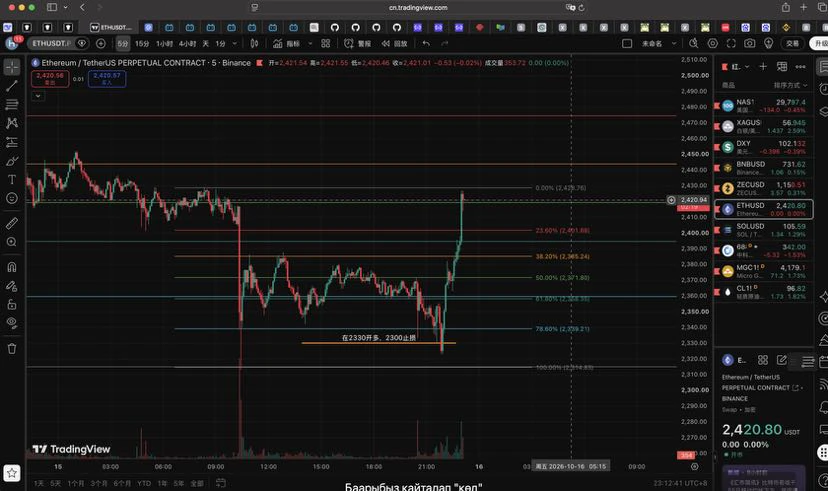
The value of Bitcoin and Ethereum’s evening long/short strategy continues to rise, $ETH 2330 to 2428, $BTC 80300 to 82333, securing 2000+98 points
ChenMingyuan_guanjin
Good evening, October 15! Bitcoin first saw its bullish candle increase to 81896 during the day before turning into a bearish candle and increasing to 80168, perfectly aligning with the 81800 short strategy we gave this morning. It is currently trading at 81000.
Thursday evening
Go long around 80800-80300, targeting
81600-82500
Go long around 2355-2330, targeting
2395-2430
$BTC $ETH
ETH-0.43%
BTC+0.25%
Crypto Market Updates
live-cover
LIVE1,819
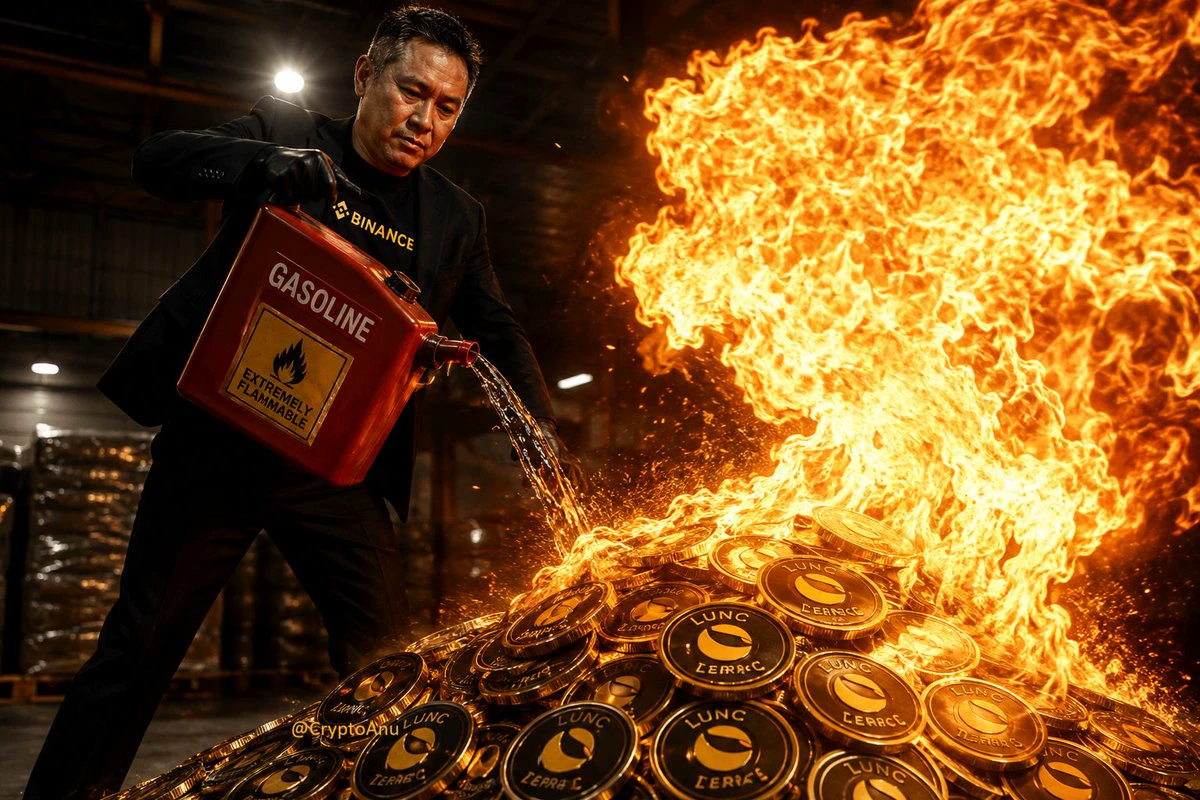
🔥 $LUNC JUST BURNED 1 BILLION TOKENS IN 10 DAYS!
🔥 Oct. 1 alone: 419M burned
🔥 Total burned since May 2022: 460B+
But here's the problem… 👀
📉 Price: ~$0.00005
📊 Volume: Below $10M
The burns are real.
The demand isn't there. YET.
Less supply means nothing without buyers stepping in. 🐻🔥
Will demand finally catch up?
post-image
LUNC+0.91%
one-day, just ussss>>
post-image
Solana is about to lose everything
Help 🤕
post-image
SOL+1.33%
Yesterday, we analyzed this with everyone: sharp declines are often accompanied by rebounds to fill the gap. The logic is simple—sharp declines can easily trigger panic selling; once the market’s selling pressure is released in full, short-term buying enters and drives the price to recover and fill the gap. This is a very common pattern in short-term trading.
We seized the opportunity to open long positions directly and successfully took profits. The original target was set at 825, but the market went straight to 826! We got the timing right and executed properly, so the result was naturally s
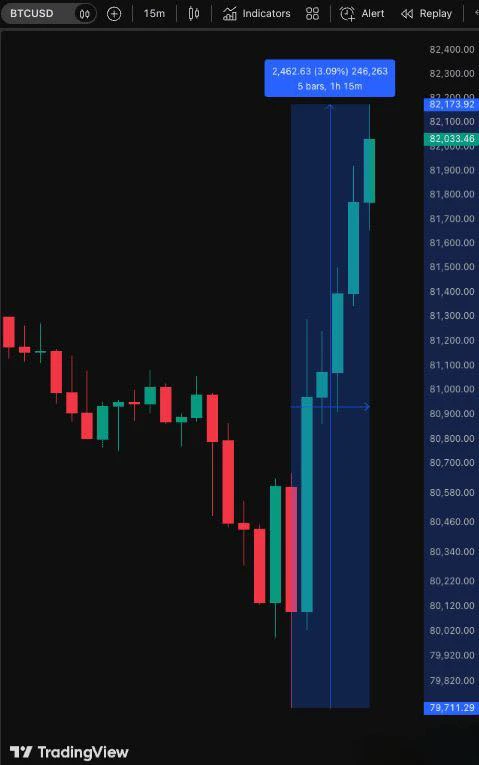
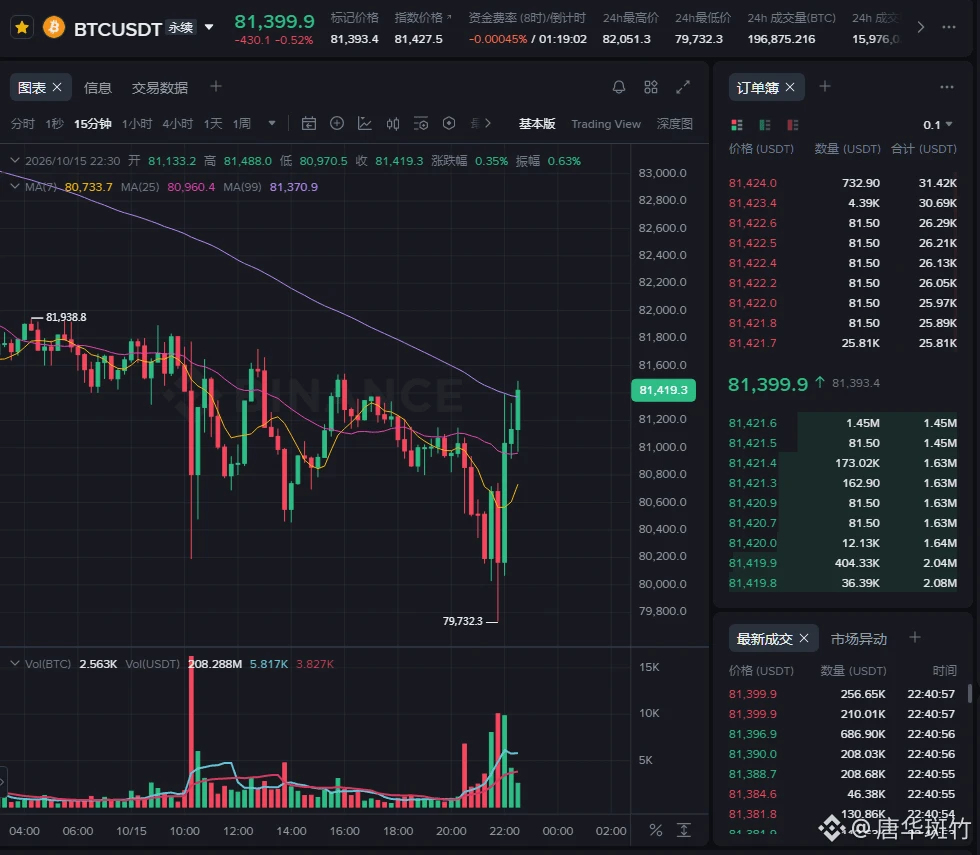
BTC decided to remind everyone who’s in charge here.
79,700 → 82k+. Nearly +3% in just over an hour.
The bears had barely celebrated the sell-off when the market stomped all over their triumph.
They tried to break 80K, but buyers turned the zone into a battlefield and defended it. Sellers were swept off the table, and the price was pushed back up.
Now the main question that should be making short sellers nervous: Is this the start of a new bullish impulse or another trap before the next strike?
If $BTC holds above 82K, it’s time for the bulls to stop knocking on the door and start ripping it
post-image
BTC+0.26%
  • 1
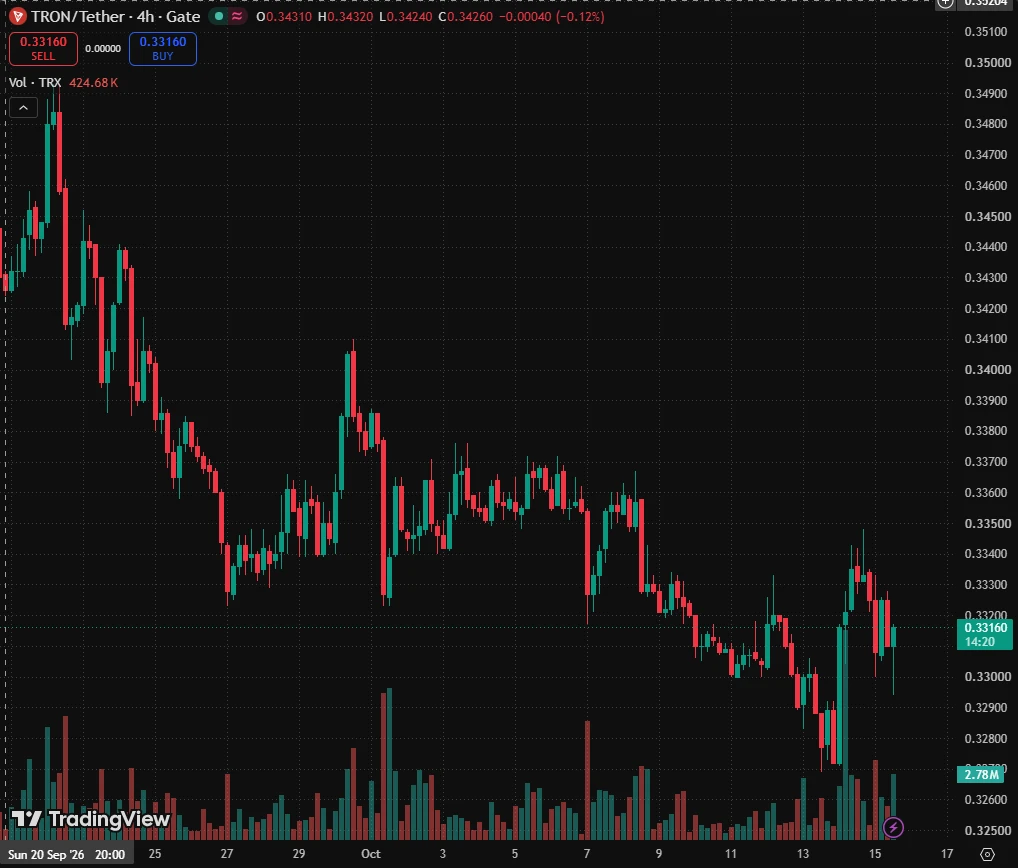
$TRX TRON: Bullish Breakout Signals a Potential Move Toward $0.3470
TRON: Bullish Breakout Signals a Potential Move Toward $0.3470
TRX broke out of a strong bearish pattern, indicating a possible bullish move is underway.
Also, BTC and ETH have been holding strong recently, increasing the chances that the crypto market could also recover.
On the other hand, we have seen that TRX tends to be strong often and this has clearly reflected our past analysis. That is why I am updating it again.
I think TRX could rise soon, with targets:
0.3360
0.3400
0.3470
You can find more details on the chart.
Tha
post-image
TRX-0.65%
JupiterZ, Jupiter's RFQ engine where market makers quote swaps directly, handled $1.78B in volume in September, up 48.01% from August. It was its biggest month since January.
@JupiterExchange
JUP-2.29%
Bitcoin just pulled a reverse fakeout, quietly dipping below $80,000 before quickly recovering—a classic way to flush leverage in a bull market🔥
According to Coinglass data, $91.65 million was liquidated across the market over the past hour. $BTC accounted for $40.45 million, while ETH liquidations followed at $13.39 million. The overwhelming majority were long positions getting swept out, while short liquidations were minimal. Put simply, this was specifically aimed at clearing out leveraged funds chasing the rally at high levels.
On the macro side, the PPI data came in stronger than expect
post-image
BTC+0.25%
ETH-0.43%
  • 7
  • 2
Load More

Join 40 M users in our growing community

⚡️ Join 40 M users in the crypto craze discussion

💬 Engage with your favorite top creators

👍 See what interests you

Trending Topics

USSeptemberPPIBeatsExpectations

91.35k Views1.85k Discussing

US September PPI came in at 6.3% YoY, well above the 5.3% market expectation, pointing to renewed producer-side inflation pressure. Weekly jobless claims were 199K, broadly in line with forecasts. Could hotter inflation further reduce room for rate cuts, and what does it mean for $BTC, US stocks, and gold?

DrLinHanSpeaksAtOxfordUnion

135.63k Views1.86k Discussing

JapanAndKoreaStocksPlunge

47.27k Views1.75k Discussing

View More