Square
Following
Hot
News
Profile
Share your thoughts
placeholder
Article
KORUG Shows a “Long Lower Wick” After the Crash! 4H Oversold Rebound—Bottom-Fishing or Bull Trap?
KORUG suffered an extremely brutal plunge, getting bloodbath-routed from 18.322 to 10.080 and currently trading at 11.481 (down 16.56%). Looking at the 4-hour chart, short-term bearish momentum is finally showing signs of exhaustion, and the battle between bulls and bears has entered a critical phase:
1. Bollinger Bands (BOLL): The earlier break below the lower band (10.176) triggered a rebound. The price is currently struggling around 11.48, with significant room remaining before reaching the mid
post-image
KORUG-11.47%
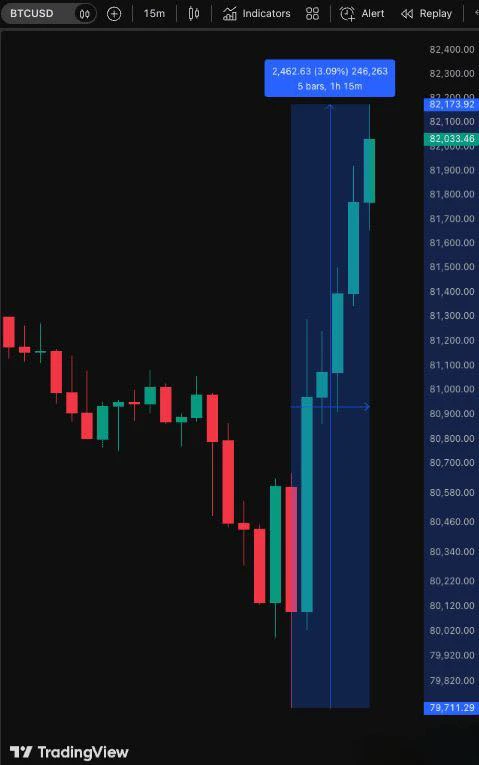
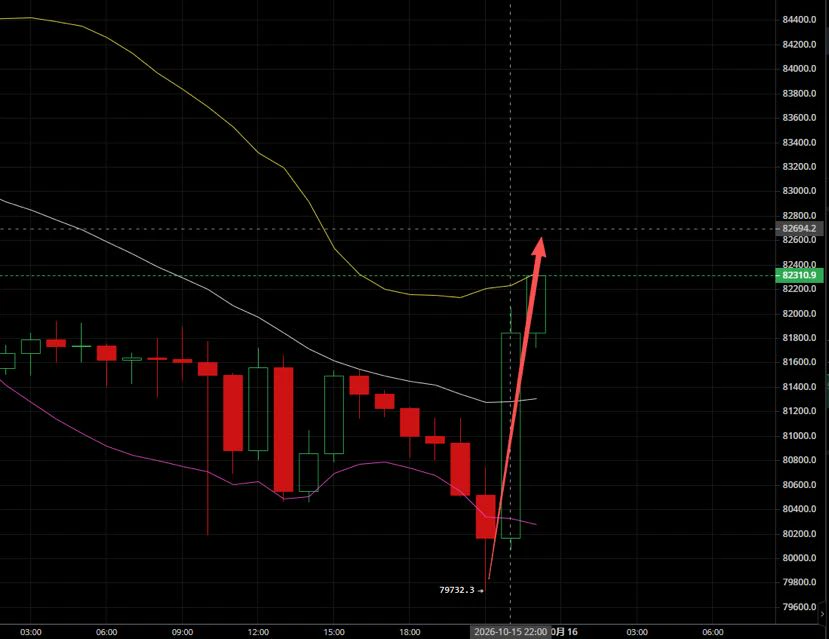
BTC decided to remind everyone who’s in charge here.
79,700 → 82k+. Nearly +3% in just over an hour.
The bears had barely celebrated the sell-off when the market stomped all over their triumph.
They tried to break 80K, but buyers turned the zone into a battlefield and defended it. Sellers were swept off the table, and the price was pushed back up.
Now the main question that should be making short sellers nervous: Is this the start of a new bullish impulse or another trap before the next strike?
If $BTC holds above 82K, it’s time for the bulls to stop knocking on the door and start ripping it
post-image
BTC+0.26%
  • 1
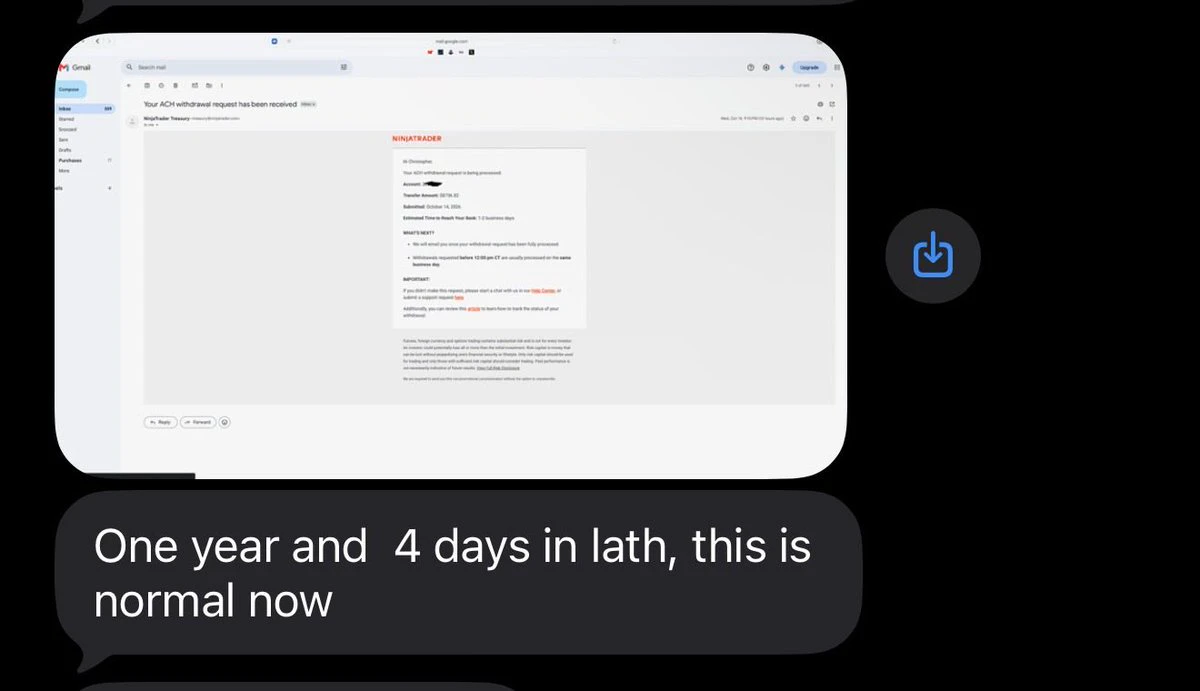
I told you I’d share their results.
Summit student. Cohort 2.
From cycle blowing accounts, to consistent 5 figure personal months.
Don’t be surprised. I’ll continue to show you the fruits of their labour.
post-image
Does your phone support translating into provincial languages? Why can mine translate into Acehnese? 🫶😭
post-image
Men only want one thing.
post-image
Invite friends and receive DOGE. Register to receive a $10 voucher
  • 1
ETF outflows reached $150 million yesterday, and could be even larger today

After the inflation data came out, ETF funds also began flowing out.

On October 14, U.S. spot Bitcoin ETFs recorded $150.5 million in net outflows, reversing the $175.7 million in net inflows recorded the previous day. The figure is not particularly large, but the direction is negative.

During the rebound from late September to early October, ETFs had significantly increased their holdings. From September 21 to October 6, these funds bought nearly $3 billion in total, marking their fastest buying pace since Novem
MU-0.37%
$DUSK This 17.98% bullish candle—I almost got no fill on the order I placed at 0.098 yesterday, and now I’m kicking myself.
Let’s review this trade: entered at 0.0985 and exited at 0.115, running after making less than 17 points. At the time, I saw the 24h low of 0.0975 hold twice and thought it was safe, but then it surged to 0.1204 and left me behind. I was tense the entire two hours I held it; once it rose to 0.11, I wanted to lock in profits—a typical bear-market mindset I haven’t shaken off.
The lesson is simple: with 39.6M in volume right there, that’s not volume retail traders can push
DUSK+12.81%
Can we please grab that?
post-image
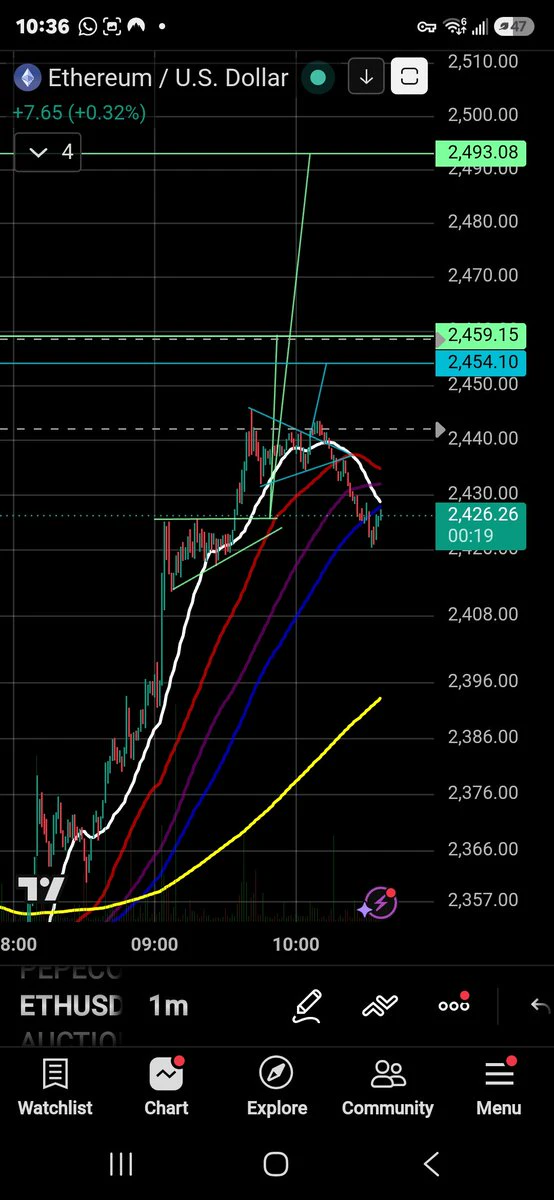
$ETH Bullish Restest Of The Green Ascending Triangle!? 👀
post-image
ETH-0.03%
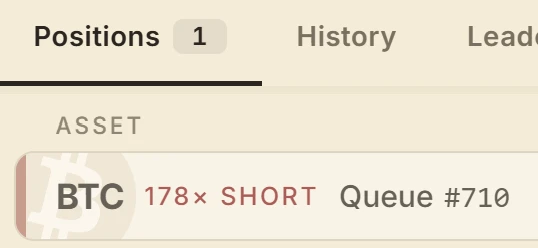
Only 710 trades ahead of mine on @papertrade_xyz
its been 4 minutes already and it hasn´t executed
post-image
$BTC Bitcoin evening outlook | The 825 level determines the trend
After briefly dipping and rebounding, it has now reached the key resistance level at 825.
This level is the one to watch:
Only a firm break above 825 will give the bulls momentum to continue higher, so go long with the trend; if it repeatedly tests but fails to break through, the rebound is a bull trap, so continue opening short positions directly
The chart shows signs of short-term bullish momentum exhaustion after the rapid surge, with clear overhead resistance. Do not blindly chase the rally; before the resistance level is br
post-image
BTC+0.25%
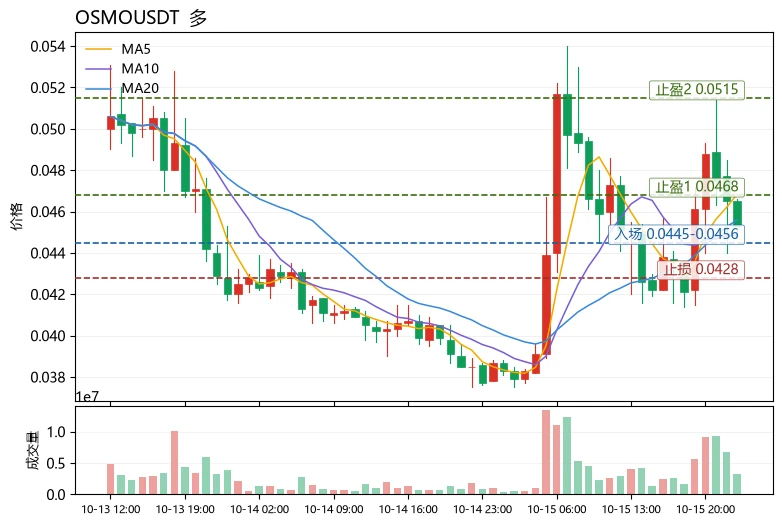
$OSMO Current price: 0.0453. The first resistance above is at 0.0468 (MA5), while support below is at 0.0456 (MA20); this area is the short-term bull-bear dividing line.
At the broader market level, the Fear & Greed Index is 53, in the neutral range. There is neither panic selling pressure nor overheated chasing, and BTC and ETH lack directional drivers, with capital more inclined to seek rotation opportunities among small- and mid-cap sectors. $OSMO Up nearly 20% in 24 hours, with trading volume of only 5.0M USDT, this is a typical low-liquidity impulse move. The 36.42% amplitude indicates i
post-image
OSMO+15.84%
ETH-0.03%
BAT+12.14%
This volatility has shaken everyone numb.
Market: Want to take a position? Ah, just kidding with you.
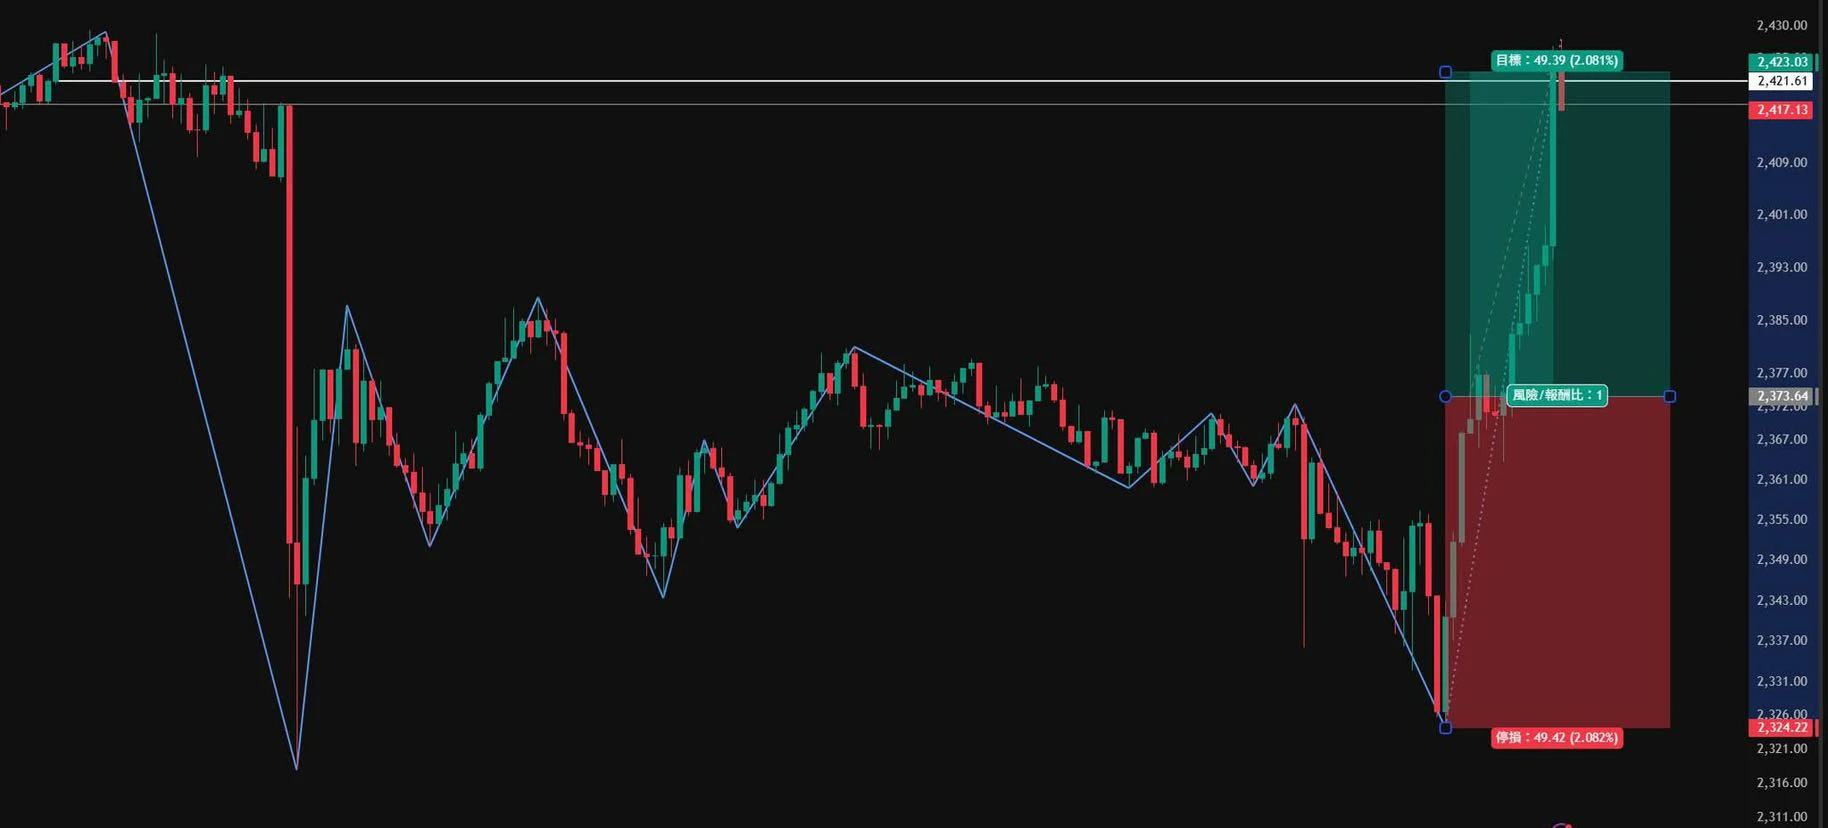
$XAUUSD ‌
post-image
XAUUSD+1.06%
BREAKING: Korea's Meritz Securities signed an MOU with the Canton Foundation to work on tokenizing Korean financial assets. Shinhan Asset Management became Korea's first Canton super validator this month.
@CantonNetwork
Crypto Market Updates
live-cover
LIVE1,819
For a second i thought something might actually happen, now i have 10 new long positions betting that it wont.
Full circle.
post-image
PPI rose 6.3% year-on-year and 1.3% month-on-month—this figure is even more alarming than CPI

Yesterday, CPI came in above expectations, and I fell from 83,900 to 81,850. I was still thinking, “Maybe tomorrow’s PPI will be a little better.” But when today’s PPI data was released, I stared at the numbers on the screen and fell silent.

September PPI rose 6.3% year-on-year, versus expectations of 5.4% and a previous reading of 5.4%. It rose 1.3% month-on-month, versus expectations of 0.6% and a previous reading of 0.4%. Core PPI rose 5.0% year-on-year, versus expectations of 4.4%. Core PPI ro
SPCX-4.11%
10/15 Market Call Validation:
The trading opportunity posted earlier hit the take-profit target in under an hour! Lucky! Continue holding and go for another wave!
post-image
🚀🔥 GATE.IO ⚡ HOT TRADER LIVE | BTC AT A CRITICAL LEVEL! ₿📊 | BIG MOVE AHEAD? 🐂🐻
live-cover
LIVE1,657
Load More

Join 40 M users in our growing community

⚡️ Join 40 M users in the crypto craze discussion

💬 Engage with your favorite top creators

👍 See what interests you

Trending Topics

USSeptemberPPIBeatsExpectations

91.35k Views1.85k Discussing

US September PPI came in at 6.3% YoY, well above the 5.3% market expectation, pointing to renewed producer-side inflation pressure. Weekly jobless claims were 199K, broadly in line with forecasts. Could hotter inflation further reduce room for rate cuts, and what does it mean for $BTC, US stocks, and gold?

DrLinHanSpeaksAtOxfordUnion

135.63k Views1.86k Discussing

JapanAndKoreaStocksPlunge

47.27k Views1.75k Discussing

View More