










ETH Technical Outlook: Ethereum Drops to $2.35K as Selling Pressure Intensifies
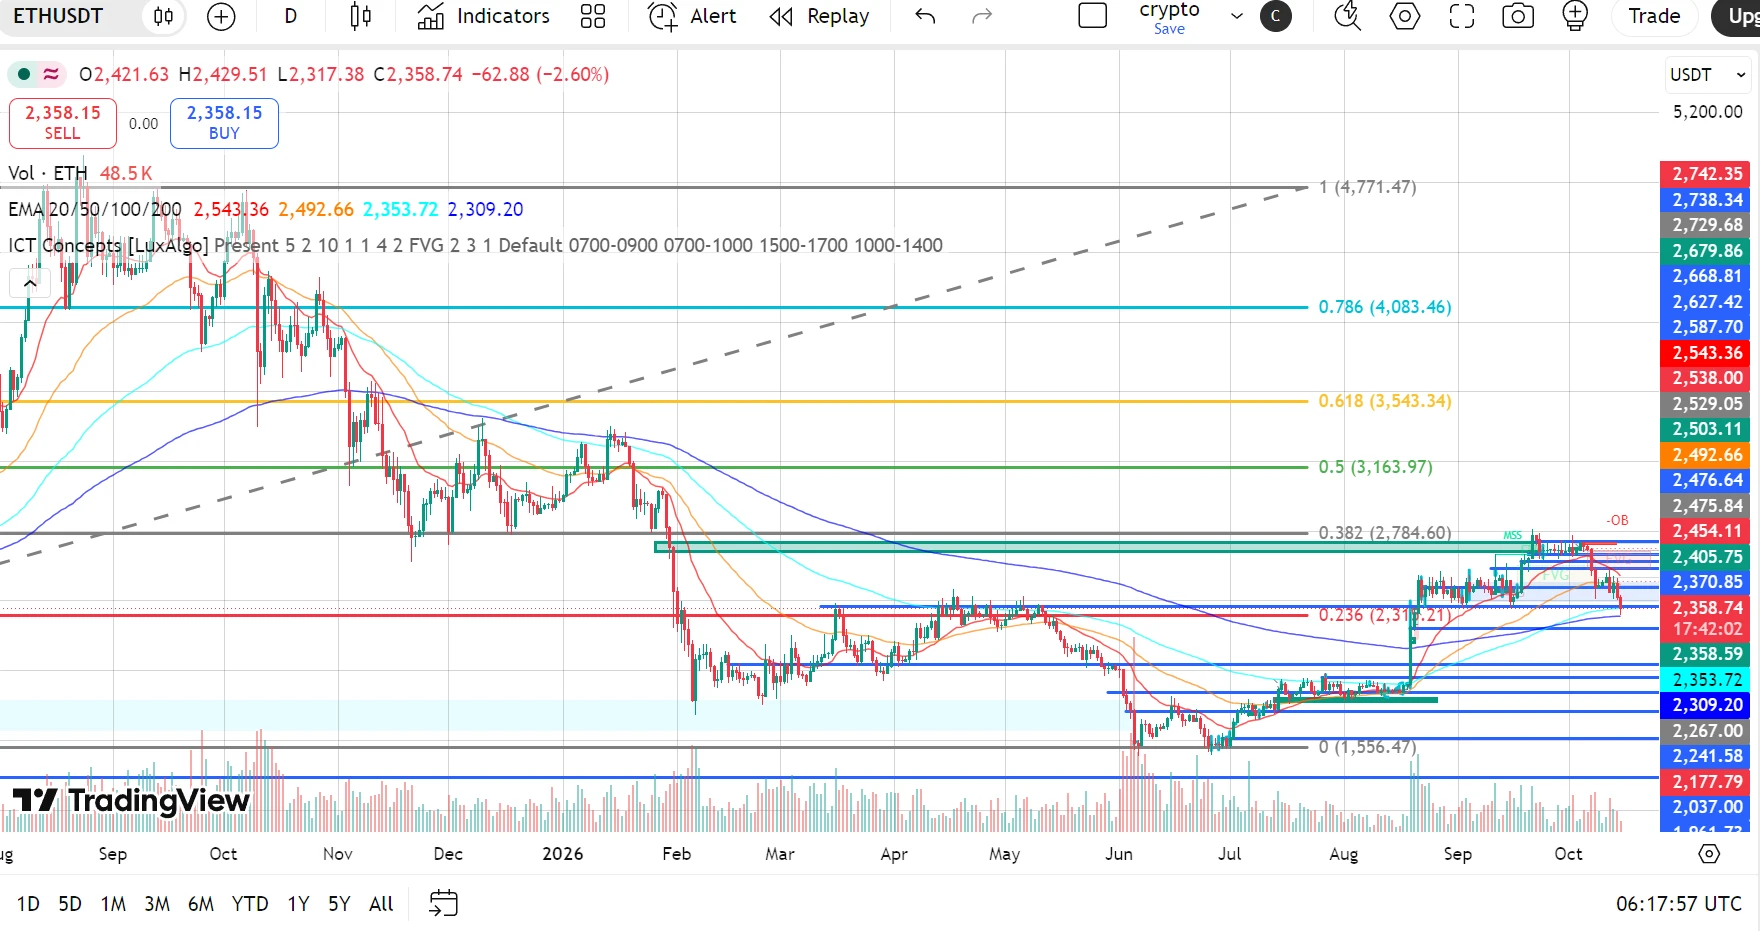
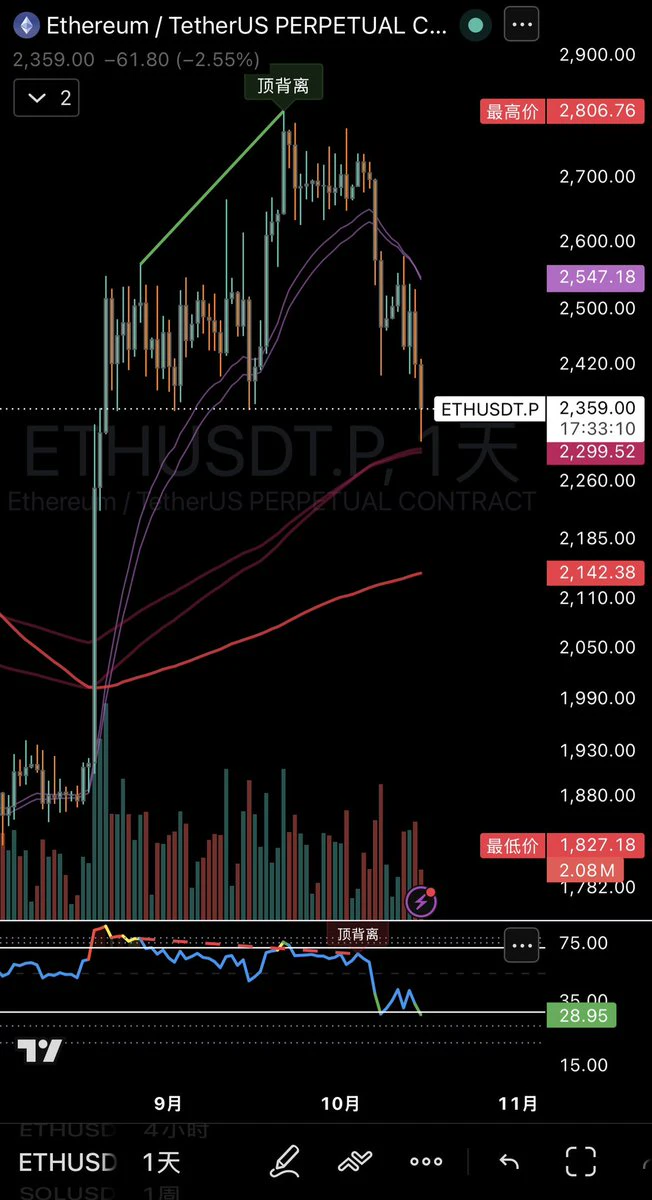
ETH is currently trading around $2,358.15, facing strong selling pressure after being rejected from the $2,405–$2,420 resistance region.
The latest move has pushed ETH below the 20 EMA and 50 EMA, while price is now testing the 100 EMA near $2,353.71. RSI has dropped to 33.99, showing weak momentum and approaching oversold territory.
The broader recovery structure is under pressure. Buyers need to defend the current support zone and reclaim nearby resistance to prevent a deeper correction.
📈 EMA Structure
20 EMA: $2,543.31
50 EMA: $2,492.64
100 EMA: $2,353.71
200 EMA: $2,309.20
ETH is trading significantly below the 20 EMA and 50 EMA, indicating strong short-term bearish momentum.
Price is currently testing the 100 EMA around $2,353.71, making this an important level for buyers to defend. The 200 EMA near $2,309.20 is the next major moving-average support.
A recovery above $2,492–$2,543 would be needed to significantly improve the short-term structure.
📐 Fibonacci Levels
0: $1,556.47
0.236: $2,315.21
0.382: $2,784.60
0.5: $3,163.97
0.618: $3,543.34
0.786: $4,083.46
1.0: $4,771.47
ETH has pulled back sharply from the recent recovery zone and is now trading near the 100 EMA, with the 0.236 Fibonacci level at $2,315.21 becoming an important downside reference.
The next major Fibonacci resistance remains at $2,784.60, but ETH would first need to reclaim the $2,405–$2,543 resistance region to build a stronger recovery.
🟢 Bullish Scenario
Immediate resistance is around $2,370.85, followed by $2,405.75.
A recovery above these levels could open the path toward:
🎯 $2,454.11
🎯 $2,492.64
🎯 $2,503.11–$2,543.31
🎯 $2,587.70
🎯 $2,627.42–$2,668.81
🎯 $2,784.60
The first sign of improvement would be a sustained reclaim of $2,405.75, followed by a move above the $2,454–$2,493 resistance zone.
A stronger recovery would require ETH to reclaim the 20 EMA at $2,543.31. Until then, any bounce could remain a relief rally within the current short-term bearish structure.
🔴 Pullback Scenario
Key support levels:
$2,353.71 — 100 EMA
$2,315.21 — 0.236 Fibonacci
$2,309.20 — 200 EMA
$2,267.00
$2,241.58
$2,177.79
$2,037.00
$1,961.73
The $2,309–$2,315 region is particularly important because it combines the 200 EMA with the 0.236 Fibonacci level.
If ETH loses the $2,353 support area and fails to recover it, the price could test $2,315–$2,309 next.
A sustained breakdown below this zone would weaken the broader recovery structure and could expose $2,267 and $2,241.58. If selling pressure continues, the lower support region around $2,177.79 could come into focus.
🧠 Market Structure & Liquidity
Recovery → Resistance Rejection → Lower High → Breakdown → Support Test → Potential Relief Bounce or Further Decline
ETH previously recovered from the June low near $1,556.47, moving toward the $2,400–$2,420 region.
However, the latest rejection has brought renewed selling pressure and pushed price below the short-term moving averages.
The current decision area is $2,309–$2,353. A successful defense could trigger a relief bounce toward $2,405 and the EMA resistance cluster. A breakdown could lead to another liquidity test around $2,267–$2,241.
📊 RSI Momentum
RSI: 33.99
RSI MA: 47.46
RSI is approaching the conventional oversold threshold of 30 and remains well below its moving average.
This indicates strong bearish momentum, although an oversold reading alone does not confirm that a bottom has formed.
If RSI stabilizes and moves back above 40 while ETH reclaims $2,405, a relief recovery could develop. If RSI remains weak and price loses $2,309, downside pressure may continue.
🎯 Key Levels
Resistance:
$2,370.85 → $2,405.75 → $2,454.11 → $2,492.64 → $2,543.31 → $2,587.70 → $2,668.81 → $2,784.60
Support:
$2,353.71 → $2,315.21 → $2,309.20 → $2,267.00 → $2,241.58 → $2,177.79
Major EMA Levels:
20 EMA: $2,543.31
50 EMA: $2,492.64
100 EMA: $2,353.71
200 EMA: $2,309.20
📌 Final Outlook
ETH's short-term structure has weakened significantly after price fell below the 20 EMA and 50 EMA.
The immediate battle is around the $2,309–$2,353 support zone, where the 100 EMA, 200 EMA and Fibonacci support levels become important reference points.
A successful defense could trigger a relief bounce toward $2,405, $2,454 and $2,493. However, ETH needs to reclaim $2,543 to show a stronger recovery.
On the downside, a sustained break below $2,309 could expose $2,267 and $2,241, with $2,177.79 as a deeper support reference.
Bias: Bearish below $2,492–$2,543. Holding $2,309–$2,353 could allow a relief bounce, but a confirmed breakdown below $2,309 would increase downside risk.
$ETH
ETH is currently trading around $2,358.15, facing strong selling pressure after being rejected from the $2,405–$2,420 resistance region.
The latest move has pushed ETH below the 20 EMA and 50 EMA, while price is now testing the 100 EMA near $2,353.71. RSI has dropped to 33.99, showing weak momentum and approaching oversold territory.
The broader recovery structure is under pressure. Buyers need to defend the current support zone and reclaim nearby resistance to prevent a deeper correction.
📈 EMA Structure
20 EMA: $2,543.31
50 EMA: $2,492.64
100 EMA: $2,353.71
200 EMA: $2,309.20
ETH is trading significantly below the 20 EMA and 50 EMA, indicating strong short-term bearish momentum.
Price is currently testing the 100 EMA around $2,353.71, making this an important level for buyers to defend. The 200 EMA near $2,309.20 is the next major moving-average support.
A recovery above $2,492–$2,543 would be needed to significantly improve the short-term structure.
📐 Fibonacci Levels
0: $1,556.47
0.236: $2,315.21
0.382: $2,784.60
0.5: $3,163.97
0.618: $3,543.34
0.786: $4,083.46
1.0: $4,771.47
ETH has pulled back sharply from the recent recovery zone and is now trading near the 100 EMA, with the 0.236 Fibonacci level at $2,315.21 becoming an important downside reference.
The next major Fibonacci resistance remains at $2,784.60, but ETH would first need to reclaim the $2,405–$2,543 resistance region to build a stronger recovery.
🟢 Bullish Scenario
Immediate resistance is around $2,370.85, followed by $2,405.75.
A recovery above these levels could open the path toward:
🎯 $2,454.11
🎯 $2,492.64
🎯 $2,503.11–$2,543.31
🎯 $2,587.70
🎯 $2,627.42–$2,668.81
🎯 $2,784.60
The first sign of improvement would be a sustained reclaim of $2,405.75, followed by a move above the $2,454–$2,493 resistance zone.
A stronger recovery would require ETH to reclaim the 20 EMA at $2,543.31. Until then, any bounce could remain a relief rally within the current short-term bearish structure.
🔴 Pullback Scenario
Key support levels:
$2,353.71 — 100 EMA
$2,315.21 — 0.236 Fibonacci
$2,309.20 — 200 EMA
$2,267.00
$2,241.58
$2,177.79
$2,037.00
$1,961.73
The $2,309–$2,315 region is particularly important because it combines the 200 EMA with the 0.236 Fibonacci level.
If ETH loses the $2,353 support area and fails to recover it, the price could test $2,315–$2,309 next.
A sustained breakdown below this zone would weaken the broader recovery structure and could expose $2,267 and $2,241.58. If selling pressure continues, the lower support region around $2,177.79 could come into focus.
🧠 Market Structure & Liquidity
Recovery → Resistance Rejection → Lower High → Breakdown → Support Test → Potential Relief Bounce or Further Decline
ETH previously recovered from the June low near $1,556.47, moving toward the $2,400–$2,420 region.
However, the latest rejection has brought renewed selling pressure and pushed price below the short-term moving averages.
The current decision area is $2,309–$2,353. A successful defense could trigger a relief bounce toward $2,405 and the EMA resistance cluster. A breakdown could lead to another liquidity test around $2,267–$2,241.
📊 RSI Momentum
RSI: 33.99
RSI MA: 47.46
RSI is approaching the conventional oversold threshold of 30 and remains well below its moving average.
This indicates strong bearish momentum, although an oversold reading alone does not confirm that a bottom has formed.
If RSI stabilizes and moves back above 40 while ETH reclaims $2,405, a relief recovery could develop. If RSI remains weak and price loses $2,309, downside pressure may continue.
🎯 Key Levels
Resistance:
$2,370.85 → $2,405.75 → $2,454.11 → $2,492.64 → $2,543.31 → $2,587.70 → $2,668.81 → $2,784.60
Support:
$2,353.71 → $2,315.21 → $2,309.20 → $2,267.00 → $2,241.58 → $2,177.79
Major EMA Levels:
20 EMA: $2,543.31
50 EMA: $2,492.64
100 EMA: $2,353.71
200 EMA: $2,309.20
📌 Final Outlook
ETH's short-term structure has weakened significantly after price fell below the 20 EMA and 50 EMA.
The immediate battle is around the $2,309–$2,353 support zone, where the 100 EMA, 200 EMA and Fibonacci support levels become important reference points.
A successful defense could trigger a relief bounce toward $2,405, $2,454 and $2,493. However, ETH needs to reclaim $2,543 to show a stronger recovery.
On the downside, a sustained break below $2,309 could expose $2,267 and $2,241, with $2,177.79 as a deeper support reference.
Bias: Bearish below $2,492–$2,543. Holding $2,309–$2,353 could allow a relief bounce, but a confirmed breakdown below $2,309 would increase downside risk.
$ETH